Stock Pitch For Watch Manufacturing Companies PowerPoint Presentation Ppt Sli...
Relative Performanace in Bonus Plans
1. 300 Trade Center, Suite 3460 | Woburn, MA 01801 | 781.392.3600 | www.dolmatconnell.com
Relative Performance Measurement in Annual Incentive Plans Can Help Mitigate
Forecast Challenges
One of the most significant challenges in designing an annual incentive plan (AIP) is the forecasting of
performance goals that will determine the plan’s payouts. This is true not only in stable, predictable economic
environments but becomes exacerbated in volatile and uncertain times, like the ones we are in now. As the
global markets continue to digest the “fiscal cliff” delay in the US, and companies continue to navigate the
unsteady macro-economic waters, confidence in goal setting remains nebulous.
At the time of this writing, negative guidance resulting in downward revisions to earnings estimates for Q4 far
exceeded the positives and analysts were already cutting Q1 and Q2 2013 estimates. Consequently, if your
company’s incentive plan goals have been established for 2013, you may already need to reconsider whether they
remain appropriate, and it is only the second week of January! With such uncertainty, oftentimes outside of
employees’ control, companies can utilize relative performance assessments to mitigate the impact this
uncertainty has on incentive plans, and at the same time, measure how they performed against their peers,
thereby gaining valuable insights into their goal setting and forecasting capabilities.
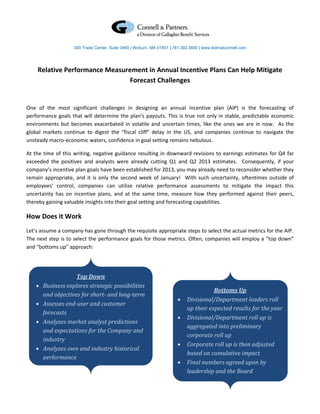
How Does it Work
Let’s assume a company has gone through the requisite appropriate steps to select the actual metrics for the AIP.
The next step is to select the performance goals for those metrics. Often, companies will employ a “top down”
and “bottoms up” approach:
Top Down
Business explores strategic possibilities
Bottoms Up
and objectives for short- and long-term
Divisional/Department leaders roll
Assesses end-user and customer
up their expected results for the year
forecasts
Divisional/Department roll up is
Analyzes market analyst predictions
aggregated into preliminary
and expectations for the Company and
corporate roll up
industry
Corporate roll up is then adjusted
Analyzes own and industry historical
based on cumulative impact
performance
Final numbers agreed upon by
CEO and Board expectations established
leadership and the Board
Final “budget” communicated to
stakeholders
2. 300 Trade Center, Suite 3460 | Woburn, MA 01801 | 781.392.3600 | www.dolmatconnell.com
While these approaches are rigorous, robust, comprehensive, and defensible, even the best prognosticators
cannot account for every contingency (e.g., Hurricane Sandy). Thus, by also incorporating a relative performance
feature, a company can mitigate the potential for misalignment in its pay for performance strategy in the event
that internal forecasts are materially different from external performance relative to peers.
For Example:
Let’s assume a company is focused on revenue growth, margin and EPS. It goes through the Bottoms Up and Top
Down exercise described above to set its targets:
Metric Target
Revenue Growth 8%
EBIT Margin 6%
EPS $1.25
Unfortunately, the company’s actual performance missed the targets on a couple of the metrics, leading to a
below-target result and payout:
Actual Potential
Metric Target Performance Payout
Revenue Growth 8% 6% 75%
EBIT Margin 6% 6% 100%
EPS $1.25 $1.19 95%
Total 90%
Target Incentive (@ 100%) $20,000
Actual Payout (based on performance) $18,000
If the company had, however, incorporated a relative performance metric, in addition to its internal, absolute
metrics, the outcome may have been different. The Company may have fallen short on its internal measures, but
it actually outperformed its peers on each of the metrics, suggesting that the internal goals may have been more
difficult to attain than originally thought.
3. 300 Trade Center, Suite 3460 | Woburn, MA 01801 | 781.392.3600 | www.dolmatconnell.com
Illustration I
Actual Potential
Metric Target Performance Payout
Revenue Growth 8% 6% 75%
EBIT Margin 6% 6% 100%
Cash Flow $300M 285 95%
Relative Performance* 50th %ile 125% 150%
Total 105%
Actual Payout (based on performance) $21,000
Difference $3,000
* Relative performance in this example is the composite score
of the company relative to peers on all 3 performance metrics
The above example contemplates comparing the individual metrics against the peers and developing a composite
score based on the results with all metrics weighted equally. Alternatively, a company may wish to consider using
only one metric to compare against peers, e.g., revenue growth, or EPS, etc. or weight the relative performance
metric differently from the others (higher or lower), depending on what was the most strategically relevant
comparison.
If a company was interested in allowing relative performance to have a more significant impact on the ultimate
results, the entire award could be modified based on relative performance (vs. using relative performance as an
additional metric in Illustration I):
Illustration II
Actual Potential Relative Final
Metric Target Performance Payout Performance Payout %
Revenue Growth 8% 6% 75%
EBIT Margin 6% 6% 100% X 150% 135%
Cash Flow $300M 285 95%
Total 90%
Actual Payout (based on performance) $27,000
Difference $9,000
* Relative performance in this example is the composite score
of the company relative to peers on all 3 performance metrics
4. 300 Trade Center, Suite 3460 | Woburn, MA 01801 | 781.392.3600 | www.dolmatconnell.com
While these examples illustrate over-performance and payouts, incorporating a relative performance feature can
also have the opposite effect. For example, if the company exceeds its internal targets but under-performs the
peer group, the peer performance factor would be below target, reducing the overall payout. Thus, incorporating
the relative performance feature facilitates the calibration of internal goal setting with overall performance.
Illustration III
Actual Potential
Metric Target Performance Payout
Revenue Growth 8% 6% 75%
EBIT Margin 6% 6% 100%
Cash Flow $300M 285 95%
Relative Performance* 25th %ile 25% 50%
Total 80%
Actual Payout (based on performance) $16,000
Difference -$4,000
* Relative performance in this example is the composite score
of the company relative to peers on all 3 performance metrics
Key Considerations
1. Robust Internal Process – Even if you are not considering a relative metric, the techniques in the Bottoms
Up and Tops Down should be considered for inclusion in the internal goal setting exercise.
2. Appropriate Peer Group – The selected peer group against which relative performance will be measured
must be reasonable, appropriate, and defensible. It may or may not be the same one that the company
uses for your executive compensation benchmarking comparisons. It should be similar in size, industry,
geographic and market scope, business cycle, reflect competitors for financial capital, etc. Depending on
peer group compatibility, a broader industry or market index may also be considered for comparisons.
3. Goals to Be Measured – Since you have selected the appropriate metrics based on your business strategy,
those are the goals that should be measured on a relative basis, as opposed to some broader bucket of
metrics. Total Shareholder Return (TSR) should also be avoided since it is a long-term measure of
performance, beyond the annual plan.
4. Measurement Period – The challenge with relative performance in annual plans is that the annual peer
financial results are not usually available until after the time the company has to roll up its own results,
submit them for Board approval, and then pay out bonuses to participants. Companies typically disclose
5. 300 Trade Center, Suite 3460 | Woburn, MA 01801 | 781.392.3600 | www.dolmatconnell.com
fourth quarter and annual results within 60 days after the close of the period. To address this timing gap,
companies may consider trailing twelve month or rolling four quarter results through the end of the third
quarter of the performance period, which would still provide 12 months / 4 quarters of performance data
and deliver a directional view on how your company is performing relative to peers.
5. Prevalence – While this type of relative feature is used by a minority of companies (less than 10% of the
Top 200 S&P companies according to a recent study by our colleagues at James F. Reda & Associates, also
a Division of Gallagher Benefits Services), we anticipate more companies will be examining the merits of
relative performance metrics in these enduring uncertain times.
Conclusion
Relative performance is just one concept among many to be considered when designing an annual incentive plan.
Given the current and expected future languishing economic uncertainty, using relative performance not only can
help mitigate some of the challenges in forecasting goals but also help calibrate internal and external firm
performance.
For More Information
This article is intended for informational purposes only and is not meant to be relied upon as specific advice. For
more information about this article, please contact the author, Justin Fossbender at 781-496-3406 or at
Justin_Fossbender@ajg.com. Justin is a Principal consultant out of the firm’s Boston office.
About Connell & Partners
At Connell & Partners, we help clients develop strategic compensation plans that are aligned with shareholder
interests and deliver competitive advantage to attract, motivate and retain a high caliber workforce. We
specialize in executive compensation consulting that is dedicated to providing independent, insightful, and
innovative advice in all areas of executive compensation and Board of Directors remuneration.
Connell & Partners is an independently run division of Gallagher Benefit Services, which is a division of Arthur J.
Gallagher (NYSE:AJG), a $2.4B insurance brokerage and risk management services firm.