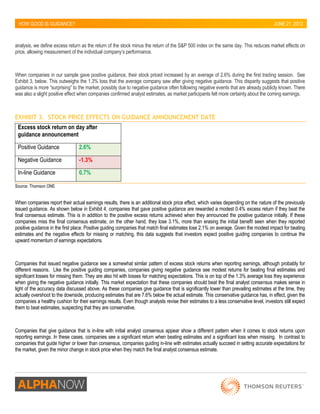
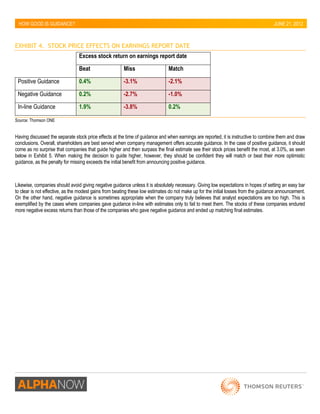
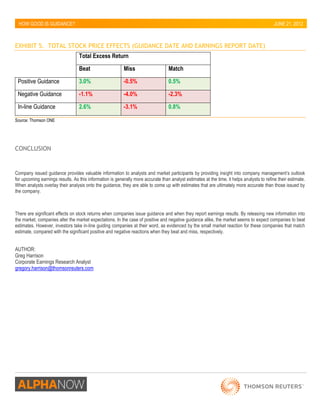
This revolutionary tool uses current and historical Form 5500 data to deliver a comprehensive report on plan health in a format that's easily understood and communicated to plan sponsors. With the power of meaningful metrics in an attractive format, you can benchmark return on investments, participation levels, and utilization against a plan's peer group and industry. The Plan Diagnostic is recognized for its speed of delivery and objectivity - offering a report with independent analysis rather than subjective ratings and hard-to-interpret correlations. Make your next plan conversation a truly consultative one that clearly distinguishes your approach from the "performance and cost" crowd.
SMC Capitals Equity Head Jagannadham Thunuguntla said: "The enthusiasm that was there among the PE firms two years back is subsiding. They are gradually resorting to low premium model of operation to cut down costs."
Stock Return Predictability with Financial Ratios: Evidence from PSX 100 Inde...Wasim Uddin
The objective of the current study is to investigate the stock return’s predictability by using financial ratios and control variable of PSX 100 Index companies during period from 2001-2014.
Hi Friends
This is supa bouy
I am a mentor, Friend for all Management Aspirants, Any query related to anything in Management, Do write me @ supabuoy@gmail.com.
I will try to assist the best way I can.
Cheers to lyf…!!!
Supa Bouy
New highs in the equity markets prompt the questions, "Is it a good time to invest?" and "What is a good strategy?" Read on to see what Cornerstone Wealth Management's Chief Investment Officer Alan Skrainka, CFA, has to say.
Blog 1 - which was written during my workinggyj19921118
Roberto Cavalli Fashion has always been luxury and elegant. The materials of each quarter’s Roberto Cavalli outlet are increasingly luxury. My dream is to wear an Roberto Cavalli dress meeting my Prince Charming. That will be gorgeous!!
Through AGL's "day-after" Action-Focused Budget Bulletin you will be able to review how yesterday's summer budget could affect you and your financial planning needs and objectives. We also offer Tax Tips and Planning Points to keep your Financial Plan on track as well as Tax Tables.
A new approach to making organisations more responsiveBart Vanderhaegen
When the complexity and speed of the markets requires organisations to change, they typically implement top-down measures: creating new organizational structures , incentives, roles and rules ... and deciding on many new projects in many different areas of the organisation. All this give the impression of speed and control , but is that really true ? The impact often is only increased complexity inside.
What is really needed is an effective trigger for goal based action in a large group, in response to the complexity outside (a challenge/ an opportunity). We developed a new approach including a web platform to sustain and steer this flow of action in the group.
As a consequence, less and less goal based action is stimulated , and thus the response to the increasingly complex market demands is more and more sub- optimal.
What is needed, is an effective trigger for the flow of goal based actions throughout the organization.
Detailed economic, industrial and company analysis is conducted here to measure performance of banking industry with special reference to public sector banks by Fundamental Analysis.
Introduction to DuPont model. This presentation tries to understand the DuPont equation and explain its components. Author Sagnik Monga is Research Intern with Adroit Research.
Private Equity Valuation Methods improve active equity portfolio by valuing a business/company that is the core task of the financial analyst. Most PE/VC firms estimate a company’s value with the help of Equity Valuation Methods. To evaluate an organization, there should be enough understanding of Venture Valuation, which is considered as the most holistic evaluation approach.
Create a 4-6 page report that analyzes financial ratios for a compCruzIbarra161
Create a 4-6 page report that analyzes financial ratios for a company, uses the data to tell the financial story of that company, and concludes with a recommendation on whether the company would be a viable partner based on its financial condition.
Introduction
It’s essential for senior management to know the financial condition of an organization in order to make strategic decisions. In this assessment, you will apply the financial management skills learned thus far.
· Tell the financial story based on financial statements.
· Conduct a financial analysis and identify focus areas for enhancing shareholder value.
· Interpret ratio computations that are meaningful and inform business decisions and strategies.
· Make three recommendations that maximize shareholder value.
Scenario
Maria Gomez is founder and president of ABC Healthcare Corporation, a company that owns hospitals, ambulatory surgical centers, urgent care centers, and outpatient clinics. She has called on you to review various financial documents and to make recommendations to maximize shareholder value.
Your Role
You are one of Maria's high-performing financial analyst managers at ABC Healthcare Corporation and she trusts your work and leadership.
Requirements
Here is what your report should provide for Maria:
· A summary of the financial strength of the company through your analysis of the price/earnings and price/book ratios.
The CFO for ABC Healthcare Corporation assessed the market value by reviewing its price/earnings ratios. The price/earnings ratio determines the market value of a stock as compared to the company's earnings. The price/earnings ratios are listed in the chart below. To calculate the price/earnings ratio, the CFO took the earnings per share and divided that into the market value. As an example, this means that in 2019 investors were willing to pay $12.10 for $1 of earnings.
Price/Earnings Ratio
2019
2018
2017
Market Price
83.62
83.62
83.62
Earnings Per Share
6.91
7.87
9.15
Price/Earnings Ratio
12.10
10.63
9.14
To further assess market value, the CFO looked at book value per share. The book value per share ratio is the per share value of a company in terms of the equity available to stockholders. The book values per share over the past three years are listed in the chart below:
Price/Ratio Ratio
2019
2018
2017
Market Price
83.62
83.62
83.62
Book Value per Share
199.1
209.05
226
Price to Book Ratio
.42
.40
.37
The price-to-book ratio (P/B ratio) compares a firm's market capitalization to its book value. It's calculated by dividing the company's stock price per share by book value per share. Here, for fiscal year 2019, the book value per share ratio was 0.42. This explains that investors were willing to pay $0.42 for $1 of book value equity. Price to book value is an important measure to see how much equity shareholders are paying for the net assets value of the company. P/B ratios under 1 are typically considered solid investments.
· Based on your analysis ...
General Electric 14General ElectricFinanc.docxbudbarber38650
General Electric 14
General Electric
Financial Analysis
Nicole Henry
EXECUTIVE SUMMARY
General Electric has been in business for over a century now and the inception of the dynamo has been the key to one of the largest global names. The company has been able to financially provide for the electrical and then today in the financial sector as well. This is reflected in the financial position of the company which has performed in the double digits during tough times. When analyzing the financial position of the company, it is evident that the performance that the company had been gaining for over a period has now started seeing a settlement impact. This means that the growth perspective that the company was seeing over the last couple of years have now subsided. The impact of growth is visible in the current year where the company’s financial position took a dip. Although the dip is the settlement of the exceeding performance; and has a subsided impact from the financial crunch in the previous decade around the globe.
ANALYSIS OVERVIEW
In order to analyze a company which has its operations in different business factions there are certain questions that need to be raised. The first question is that with such a gigantic business across the globe, is it feasible to break the financial analysis on a business wise or is the company feasible to be analyzed in a single entity perspective. The perspective reveals that the company analyzes its performance as a single entity and hence all the stakeholders are considered under a single arena. Thence, the review has to be taken in the single entity perspective. Along with this, there is a portion of performance review which is to set the trends for the future. The perspective cannot be taken as the downward trend, but this has to be taken as a moving average of the recent years. The financial analysis will reveal what factions of the company underperformed and led to a decrease in the financial position. The financial ratios used in the study reveal the position and performance of the company in the perspective of how each pillar has performed. This ratio analysis will also be an intricate combination of the businesses of the company to augment each pillar.
ASSUMPTIONS
The basis for carrying out the financial analysis for the company involves the changing trends of the company and the industry itself. Although the company’s financial positions appear to present strong performance, the underlying belief is that the company is now in a position where the product and service demand is increasing. Connecting the dots, the company is carrying out the sales with controlled receivables. The assumption set here is that the company’s growth in sales trends for products and services is not driven through increasing credit exposure. Along with this, there is an increased trend for cost hikes. This is assumed to be driven from the pricing positions in the market and the underlying costs requir.
Jazzit Score is a financial reporting tool that automatically creates a comprehensive 32 page financial report analyzing the health of your clients’ business. Drawing on the trial balance info already entered in CaseWare Working Papers, it includes ratio analysis, trend analysis, comparative industry and custom defined benchmarks with insightful commentary.
Founded in 2000, Jazzit is Canada’s leading supplier of premium CaseWare templates for accountants. Our products include Jazzit Fundamentals, Jazzit Checklists and Jazzit Score, creating a powerful suite of automated solutions for SME practioners. Jazzit Fundamentals, the flagship product, is an integrated suite of over 115 templates and letters that assist public accountants in completing year-end engagements with their corporate clients. With offices in Calgary, Alberta, and Kelowna, B.C., Jazzit’s software serves over 5,000 accounting professionals across Canada.
Jazzit Score is a financial reporting tool that automatically creates a comprehensive 32 page financial report analyzing the health of your clients' business. Drawing on the trial balance info already entered in CaseWare Working Papers, it includes ratio analysis, trend analysis, comparative industry and custom defined benchmarks with insightful commentary.
Founded in 2000, Jazzit is Canada's leading supplier of premium CaseWare templates for accountants. Our products include Jazzit Fundamentals, Jazzit Checklists and Jazzit Score, creating a powerful suite of automated solutions for SME practioners. Jazzit Fundamentals, the flagship product, is an integrated suite of over 100 templates and letters that assist public accountants in completing year-end engagements with their corporate clients. With offices in Calgary, Alberta, and Kelowna, B.C., Jazzit's software serves over 5,000 accounting professionals across Canada.
Enterprise Excellence is Inclusive Excellence.pdfKaiNexus
Enterprise excellence and inclusive excellence are closely linked, and real-world challenges have shown that both are essential to the success of any organization. To achieve enterprise excellence, organizations must focus on improving their operations and processes while creating an inclusive environment that engages everyone. In this interactive session, the facilitator will highlight commonly established business practices and how they limit our ability to engage everyone every day. More importantly, though, participants will likely gain increased awareness of what we can do differently to maximize enterprise excellence through deliberate inclusion.
What is Enterprise Excellence?
Enterprise Excellence is a holistic approach that's aimed at achieving world-class performance across all aspects of the organization.
What might I learn?
A way to engage all in creating Inclusive Excellence. Lessons from the US military and their parallels to the story of Harry Potter. How belt systems and CI teams can destroy inclusive practices. How leadership language invites people to the party. There are three things leaders can do to engage everyone every day: maximizing psychological safety to create environments where folks learn, contribute, and challenge the status quo.
Who might benefit? Anyone and everyone leading folks from the shop floor to top floor.
Dr. William Harvey is a seasoned Operations Leader with extensive experience in chemical processing, manufacturing, and operations management. At Michelman, he currently oversees multiple sites, leading teams in strategic planning and coaching/practicing continuous improvement. William is set to start his eighth year of teaching at the University of Cincinnati where he teaches marketing, finance, and management. William holds various certifications in change management, quality, leadership, operational excellence, team building, and DiSC, among others.
The world of search engine optimization (SEO) is buzzing with discussions after Google confirmed that around 2,500 leaked internal documents related to its Search feature are indeed authentic. The revelation has sparked significant concerns within the SEO community. The leaked documents were initially reported by SEO experts Rand Fishkin and Mike King, igniting widespread analysis and discourse. For More Info:- https://news.arihantwebtech.com/search-disrupted-googles-leaked-documents-rock-the-seo-world/
Attending a job Interview for B1 and B2 Englsih learnersErika906060
It is a sample of an interview for a business english class for pre-intermediate and intermediate english students with emphasis on the speking ability.
VAT Registration Outlined In UAE: Benefits and Requirementsuae taxgpt
Vat Registration is a legal obligation for businesses meeting the threshold requirement, helping companies avoid fines and ramifications. Contact now!
https://viralsocialtrends.com/vat-registration-outlined-in-uae/
Premium MEAN Stack Development Solutions for Modern BusinessesSynapseIndia
Stay ahead of the curve with our premium MEAN Stack Development Solutions. Our expert developers utilize MongoDB, Express.js, AngularJS, and Node.js to create modern and responsive web applications. Trust us for cutting-edge solutions that drive your business growth and success.
Know more: https://www.synapseindia.com/technology/mean-stack-development-company.html
Buy Verified PayPal Account | Buy Google 5 Star Reviewsusawebmarket
Buy Verified PayPal Account
Looking to buy verified PayPal accounts? Discover 7 expert tips for safely purchasing a verified PayPal account in 2024. Ensure security and reliability for your transactions.
PayPal Services Features-
🟢 Email Access
🟢 Bank Added
🟢 Card Verified
🟢 Full SSN Provided
🟢 Phone Number Access
🟢 Driving License Copy
🟢 Fasted Delivery
Client Satisfaction is Our First priority. Our services is very appropriate to buy. We assume that the first-rate way to purchase our offerings is to order on the website. If you have any worry in our cooperation usually You can order us on Skype or Telegram.
24/7 Hours Reply/Please Contact
usawebmarketEmail: support@usawebmarket.com
Skype: usawebmarket
Telegram: @usawebmarket
WhatsApp: +1(218) 203-5951
USA WEB MARKET is the Best Verified PayPal, Payoneer, Cash App, Skrill, Neteller, Stripe Account and SEO, SMM Service provider.100%Satisfection granted.100% replacement Granted.
Unveiling the Secrets How Does Generative AI Work.pdfSam H
At its core, generative artificial intelligence relies on the concept of generative models, which serve as engines that churn out entirely new data resembling their training data. It is like a sculptor who has studied so many forms found in nature and then uses this knowledge to create sculptures from his imagination that have never been seen before anywhere else. If taken to cyberspace, gans work almost the same way.
[Note: This is a partial preview. To download this presentation, visit:
https://www.oeconsulting.com.sg/training-presentations]
Sustainability has become an increasingly critical topic as the world recognizes the need to protect our planet and its resources for future generations. Sustainability means meeting our current needs without compromising the ability of future generations to meet theirs. It involves long-term planning and consideration of the consequences of our actions. The goal is to create strategies that ensure the long-term viability of People, Planet, and Profit.
Leading companies such as Nike, Toyota, and Siemens are prioritizing sustainable innovation in their business models, setting an example for others to follow. In this Sustainability training presentation, you will learn key concepts, principles, and practices of sustainability applicable across industries. This training aims to create awareness and educate employees, senior executives, consultants, and other key stakeholders, including investors, policymakers, and supply chain partners, on the importance and implementation of sustainability.
LEARNING OBJECTIVES
1. Develop a comprehensive understanding of the fundamental principles and concepts that form the foundation of sustainability within corporate environments.
2. Explore the sustainability implementation model, focusing on effective measures and reporting strategies to track and communicate sustainability efforts.
3. Identify and define best practices and critical success factors essential for achieving sustainability goals within organizations.
CONTENTS
1. Introduction and Key Concepts of Sustainability
2. Principles and Practices of Sustainability
3. Measures and Reporting in Sustainability
4. Sustainability Implementation & Best Practices
To download the complete presentation, visit: https://www.oeconsulting.com.sg/training-presentations
Affordable Stationery Printing Services in Jaipur | Navpack n PrintNavpack & Print
Looking for professional printing services in Jaipur? Navpack n Print offers high-quality and affordable stationery printing for all your business needs. Stand out with custom stationery designs and fast turnaround times. Contact us today for a quote!
Memorandum Of Association Constitution of Company.pptseri bangash
www.seribangash.com
A Memorandum of Association (MOA) is a legal document that outlines the fundamental principles and objectives upon which a company operates. It serves as the company's charter or constitution and defines the scope of its activities. Here's a detailed note on the MOA:
Contents of Memorandum of Association:
Name Clause: This clause states the name of the company, which should end with words like "Limited" or "Ltd." for a public limited company and "Private Limited" or "Pvt. Ltd." for a private limited company.
https://seribangash.com/article-of-association-is-legal-doc-of-company/
Registered Office Clause: It specifies the location where the company's registered office is situated. This office is where all official communications and notices are sent.
Objective Clause: This clause delineates the main objectives for which the company is formed. It's important to define these objectives clearly, as the company cannot undertake activities beyond those mentioned in this clause.
www.seribangash.com
Liability Clause: It outlines the extent of liability of the company's members. In the case of companies limited by shares, the liability of members is limited to the amount unpaid on their shares. For companies limited by guarantee, members' liability is limited to the amount they undertake to contribute if the company is wound up.
https://seribangash.com/promotors-is-person-conceived-formation-company/
Capital Clause: This clause specifies the authorized capital of the company, i.e., the maximum amount of share capital the company is authorized to issue. It also mentions the division of this capital into shares and their respective nominal value.
Association Clause: It simply states that the subscribers wish to form a company and agree to become members of it, in accordance with the terms of the MOA.
Importance of Memorandum of Association:
Legal Requirement: The MOA is a legal requirement for the formation of a company. It must be filed with the Registrar of Companies during the incorporation process.
Constitutional Document: It serves as the company's constitutional document, defining its scope, powers, and limitations.
Protection of Members: It protects the interests of the company's members by clearly defining the objectives and limiting their liability.
External Communication: It provides clarity to external parties, such as investors, creditors, and regulatory authorities, regarding the company's objectives and powers.
https://seribangash.com/difference-public-and-private-company-law/
Binding Authority: The company and its members are bound by the provisions of the MOA. Any action taken beyond its scope may be considered ultra vires (beyond the powers) of the company and therefore void.
Amendment of MOA:
While the MOA lays down the company's fundamental principles, it is not entirely immutable. It can be amended, but only under specific circumstances and in compliance with legal procedures. Amendments typically require shareholder
Discover the innovative and creative projects that highlight my journey throu...dylandmeas
Discover the innovative and creative projects that highlight my journey through Full Sail University. Below, you’ll find a collection of my work showcasing my skills and expertise in digital marketing, event planning, and media production.
1. HOW GOOD IS GUIDANCE?
_________________________________________________________________________________
FUNDAMENTAL RESEARCH JUNE 21, 2012
HOW GOOD IS GUIDANCE?
WHO MAKES THE BEST PREDICTIONS, ANALYSTS OR COMPANIES THEMSELVES, AND WHAT DOES THAT MEAN FOR STOCK PRICES?
HIGHLIGHTS
Companies are more accurate than analysts at estimating their future earnings per share results. However, after companies issue guidance, analysts adjust their estimates, ultimately creating estimates that are more accurate than those issued by the company.
Companies issuing positive guidance saw the greatest increase in estimate accuracy post-guidance, suggesting that positive guidance is more “surprising” to analysts than negative or in-line guidance.
The excess stock returns associated with company issued guidance are split between the date that guidance was issued and the date the company reported earnings results. On the guidance date, companies giving positive guidance see an excess stock return of 2.6%, while those guiding lower lose 1.3%, and those that guide in-line gain 0.7%.
Companies that offer guidance – positive or negative – see a minimal additional positive excess return if they beat the final analyst estimate, but significant negative excess returns if they miss or match estimates, suggesting that the market expects both groups of companies to beat estimates. Investors should be aware of these expectations when assessing the risk of their positions as companies report earnings.
Strategies of guiding lower to enable a company to beat estimates or guiding higher when the company’s fundamentals don’t support it to take advantage of the stock price effect on guidance day would not be effective, as both have negative returns on average.
DEFINITIONS
Initial Consensus: The consensus analyst earnings per share estimate at the time that the company issued guidance.
Company Issued Guidance: A public statement provided by the company estimating earnings per share for the coming period.
Final Consensus: The consensus analyst earnings per share estimate at the time that the company reports quarterly earnings per share results.
Actual: Quarterly earnings per share results reported by the company.
Positive Guidance: Company issued guidance projecting higher EPS when rounded to two decimal places than the consensus analyst
estimate at the time guidance is issued.
2. HOW GOOD IS GUIDANCE?
JUNE 21, 2012
Negative Guidance: Company issued guidance projecting lower EPS when rounded to two decimal places than the consensus analyst estimate at the time guidance is issued.
In-line Guidance: Company issued guidance projecting the same EPS when rounded to two decimal places as the consensus analyst estimate at the time guidance is issued.
METHODOLOGY
To evaluate the accuracy of company issued guidance and the effects of guidance on stock prices, we examined every instance of quarterly earnings per share guidance given by S&P 500 companies over the past eight quarters, a total of 972 guidance announcements. For each guidance announcement, we compiled the consensus analyst estimate at the time guidance was given, the guidance estimate given by the company, the final analyst estimate prior to the earnings announcement, and the actual earnings per share reported by the company. This allowed the determination of relative accuracy of the analyst and company earnings estimates. Stock returns were compiled for the applicable dates to measure the effect on stock prices when companies announced their guidance and when they reported actual earnings results.
This analysis is limited to instances in which companies provided quarterly earnings per share estimates with a specific dollar value or range of values. In cases where a range was given, we used the midpoint of the range. All values were rounded to the cent for the purposes of comparing actual results with estimates and guidance.
WHY DO COMPANIES ISSUE GUIDANCE?
The primary reason that corporations issue guidance is to frame expectations for their upcoming financial results. Companies differ on the scope and detail of their guidance, with some companies limiting themselves to qualitative descriptions of their earnings trend, and others providing detailed estimates for revenue, earnings, margins, and more.
Only a subset of companies chooses to issue guidance. Over the past two years, on average 122 of the 500 companies in the S&P 500 index have issued quarterly earnings guidance. Many of these companies routinely issue guidance, while others only do so as needed. Of the 187 companies that issued guidance during the period examined, 44% of them did so in all eight quarters. On the other hand, 34% of the companies in the study only offered guidance in one or two quarters.
Companies that provide earnings guidance are more likely to give guidance that is below the consensus analyst estimate than above it. During our study period, 59% of the guidance estimates were negative, compared with 32% positive. There are a couple of potential explanations for this. One is that some companies only provide guidance if there is negative material nonpublic information that the company wants to make investors aware of. However, when looking at companies that gave guidance while reporting their previous quarter’s earnings, we see that they give negative guidance at a higher rate than those companies that give guidance at a later point in the quarter. Another explanation for the negative bias in guidance is that companies tend to be conservative when forecasting their results to avoid promising earnings that they will not be able to deliver. This explanation is more likely to be the reason for more of the companies giving negative guidance, especially considering the effects on stock prices of missing earnings estimates, discussed below.
3. HOW GOOD IS GUIDANCE?
JUNE 21, 2012
IS GUIDANCE ACCURATE?
Given the far greater amount of information that a company’s management team has about their operations than any outside analyst could have, it
seems logical that company issued guidance should be more accurate than analyst estimates. Overall, this is the case – on an absolute basis, the
average initial consensus differs from the actual earnings by 17.9%. Company issued guidance, on the other hand, differs from actual results by
9.8%, a significant improvement. When companies give earnings guidance, the analysts covering the company usually revise their estimates towards
the guidance that was given. Guidance is not taken as a given, though, as analysts interpret the guidance and add their own analysis, and continue to
revise their estimates. The final analyst consensus estimate, incorporating company issued guidance and information gained since the guidance
announcement, is the most accurate, differing from actual results on average by 8.0%.
EXHIBIT 1. ABSOLUTE ESTIMATE ERROR
Positive Guidance Negative Guidance In-line Guidance All Guidance
Initial Consensus 17.9% 9.9% 6.9% 12.2%
Guidance 9.8% 10.1% 6.8% 9.8%
Final Consensus 8.4% 8.1% 6.1% 8.0%
0%
2%
4%
6%
8%
10%
12%
14%
16%
18%
Source: Thomson ONE
As shown above in Exhibit 1, the relative accuracy of company issued guidance varies depending on the type of guidance given. When companies
give positive guidance, they tend to be significantly more accurate than initial analyst consensus, lowering absolute error from 17.9% to 9.8%. Again,
we see the effect of additional analyst revisions, as the final consensus estimate differs from the actual EPS results by 8.4%.
4. HOW GOOD IS GUIDANCE?
JUNE 21, 2012
In the case of companies issuing guidance in line with expectations, the error doesn’t change significantly (small difference due to rounding), and the
estimates exceed actual earnings by 6.9%. The error in these instances is lower than for companies issuing positive or negative guidance. These
companies also see additional accuracy as a result of further analyst revisions, but to a lesser extent. Accuracy increases by 0.8%, giving the final
consensus estimate accuracy of 6.1%.
When companies give negative guidance, they are slightly less accurate on an absolute basis, differing from actual earnings by 10.1%, compared to
the 9.9% difference between initial analyst estimates and actual earnings. Final consensus estimates for negatively guiding companies are again
more accurate, with error of 8.1%.
When viewed on a simple average basis, as shown in Exhibit 2, below, it becomes apparent that, even though the accuracy is similar on an absolute
basis, companies giving negative guidance are significantly less accurate than initial analyst estimates because their inaccuracy is in the opposite
direction and is more extreme. In other words, the initial analyst estimates are higher than the eventual earnings reports by 2.7% on average. The
guidance given by these companies, however, is lower than actual earnings by 7.6%, implying that when a company decides to give negative
guidance, they are very conservative so as to avoid the possibility of missing a lowered target.
EXHIBIT 2. AVERAGE ESTIMATE ERROR
Initial Consensus, 2.7%
Guidance, -7.6%
Final Consensus, -5.2%
-10.0%
-8.0%
-6.0%
-4.0%
-2.0%
0.0%
2.0%
4.0%
6.0%
8.0%
10.0%
Source: Thomson ONE
WHAT HAPPENS TO STOCK PRICES?
To evaluate the effect of giving guidance on stock prices, we analyzed the excess returns of the companies that gave guidance during the study
period on the day they announced their guidance (or the following day for companies that announced guidance after the market close). For this
5. HOW GOOD IS GUIDANCE?
JUNE 21, 2012
analysis, we define excess return as the return of the stock minus the return of the S&P 500 index on the same day. This reduces market effects on price, allowing measurement of the individual company’s performance.
When companies in our sample gave positive guidance, their stock priced increased by an average of 2.6% during the first trading session. See Exhibit 3, below. This outweighs the 1.3% loss that the average company saw after giving negative guidance. This disparity suggests that positive guidance is more “surprising” to the market, possibly due to negative guidance often following negative events that are already publicly known. There was also a slight positive effect when companies confirmed analyst estimates, as market participants felt more certainty about the coming earnings.
EXHIBIT 3. STOCK PRICE EFFECTS ON GUIDANCE ANNOUNCEMENT DATE
Excess stock return on day after guidance announcement
Positive Guidance 2.6%
Negative Guidance -1.3%
In-line Guidance 0.7%
Source: Thomson ONE
When companies report their actual earnings results, there is an additional stock price effect, which varies depending on the nature of the previously issued guidance. As shown below in Exhibit 4, companies that gave positive guidance are rewarded a modest 0.4% excess return if they beat the final consensus estimate. This is in addition to the positive excess returns achieved when they announced the positive guidance initially. If these companies miss the final consensus estimate, on the other hand, they lose 3.1%, more than erasing the initial benefit seen when they reported positive guidance in the first place. Positive guiding companies that match final estimates lose 2.1% on average. Given the modest impact for beating estimates and the negative effects for missing or matching, this data suggests that investors expect positive guiding companies to continue the upward momentum of earnings expectations.
Companies that issued negative guidance see a somewhat similar pattern of excess stock returns when reporting earnings, although probably for different reasons. Like the positive guiding companies, companies giving negative guidance see modest returns for beating final estimates and significant losses for missing them. They are also hit with losses for matching expectations. This is on top of the 1.3% average loss they experience when giving the negative guidance initially. This market expectation that these companies should beat the final analyst consensus makes sense in light of the accuracy data discussed above. As these companies give guidance that is significantly lower than prevailing estimates at the time, they actually overshoot to the downside, producing estimates that are 7.6% below the actual estimate. This conservative guidance has, in effect, given the companies a healthy cushion for their earnings results. Even though analysts revise their estimates to a less conservative level, investors still expect them to beat estimates, suspecting that they are conservative.
Companies that give guidance that is in-line with initial analyst consensus appear show a different pattern when it comes to stock returns upon reporting earnings. In these cases, companies see a significant return when beating estimates and a significant loss when missing. In contrast to companies that guide higher or lower than consensus, companies guiding in-line with estimates actually succeed in setting accurate expectations for the market, given the minor change in stock price when they match the final analyst consensus estimate.
6. HOW GOOD IS GUIDANCE?
JUNE 21, 2012
EXHIBIT 4. STOCK PRICE EFFECTS ON EARNINGS REPORT DATE
Excess stock return on earnings report date
Beat
Miss
Match
Positive Guidance 0.4% -3.1% -2.1%
Negative Guidance 0.2% -2.7% -1.0%
In-line Guidance 1.9% -3.8% 0.2%
Source: Thomson ONE
Having discussed the separate stock price effects at the time of guidance and when earnings are reported, it is instructive to combine them and draw conclusions. Overall, shareholders are best served when company management offers accurate guidance. In the case of positive guidance, it should come as no surprise that companies that guide higher and then surpass the final estimate see their stock prices benefit the most, at 3.0%, as seen below in Exhibit 5. When making the decision to guide higher, however, they should be confident they will match or beat their more optimistic guidance, as the penalty for missing exceeds the initial benefit from announcing positive guidance.
Likewise, companies should avoid giving negative guidance unless it is absolutely necessary. Giving low expectations in hopes of setting an easy bar to clear is not effective, as the modest gains from beating these low estimates do not make up for the initial losses from the guidance announcement. On the other hand, negative guidance is sometimes appropriate when the company truly believes that analyst expectations are too high. This is exemplified by the cases where companies gave guidance in-line with estimates only to fail to meet them. The stocks of these companies endured more negative excess returns than those of the companies who gave negative guidance and ended up matching final estimates.
7. HOW GOOD IS GUIDANCE?
JUNE 21, 2012
EXHIBIT 5. TOTAL STOCK PRICE EFFECTS (GUIDANCE DATE AND EARNINGS REPORT DATE)
Total Excess Return
Beat
Miss
Match
Positive Guidance 3.0% -0.5% 0.5%
Negative Guidance -1.1% -4.0% -2.3%
In-line Guidance 2.6% -3.1% 0.8%
Source: Thomson ONE
CONCLUSION
Company issued guidance provides valuable information to analysts and market participants by providing insight into company management’s outlook for upcoming earnings results. As this information is generally more accurate than analyst estimates at the time, it helps analysts to refine their estimate. When analysts overlay their analysis onto the guidance, they are able to come up with estimates that are ultimately more accurate than those issued by the company.
There are significant effects on stock returns when companies issue guidance and when they report earnings results. By releasing new information into the market, companies alter the market expectations. In the case of positive and negative guidance alike, the market seems to expect companies to beat estimates. However, investors take in-line guiding companies at their word, as evidenced by the small market reaction for these companies that match estimate, compared with the significant positive and negative reactions when they beat and miss, respectively.
AUTHOR:
Greg Harrison
Corporate Earnings Research Analyst
gregory.harrison@thomsonreuters.com