Fabrication of an experimental setup to analyse the thermodynamic propriety of water

Abstract An experimental setup was made to analyse some of thermodynamic properties of water. In these setup two pressure cookers was used. They were connected with a brass pipe having a gateway i.e., throttling valve in it. There was a pressure gauge and a temperature gauge fixed on the cap of each pressure cooker. A flow meter connected to brass pipe by poly urethane pipe was used to measure the volume flow rate of water vapour. Steam was generated in one of the pressure cooker by boiling water and second had left empty. Now generated steam was passes through brass pipe having gateway towards second pressure cooker. In this way, all the required reading of each measuring instrument was taken by this experimental setup. Thus all the thermodynamic properties of water like Joule-Thomson curve, P-V, T-s and h-s diagrams were studying by this setup. Keywords- Pressure cookers, throttling device, free expansion, Joule-Kelvin effect, P-V, T-s and P-h diagrams

Recommended
Recommended
More Related Content
What's hot
What's hot (20)
Viewers also liked
Viewers also liked (19)
Similar to Fabrication of an experimental setup to analyse the thermodynamic propriety of water
Similar to Fabrication of an experimental setup to analyse the thermodynamic propriety of water (20)
More from eSAT Journals
More from eSAT Journals (20)
Recently uploaded
Recently uploaded (20)
Fabrication of an experimental setup to analyse the thermodynamic propriety of water
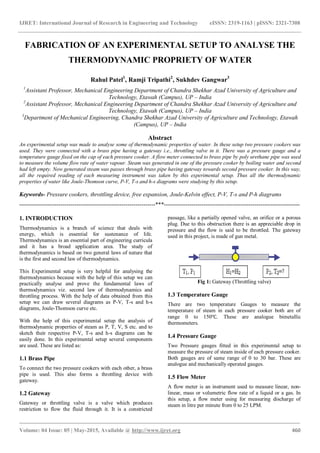
- 1. IJRET: International Journal of Research in Engineering and Technology eISSN: 2319-1163 | pISSN: 2321-7308 _______________________________________________________________________________________ Volume: 04 Issue: 05 | May-2015, Available @ http://www.ijret.org 460 FABRICATION OF AN EXPERIMENTAL SETUP TO ANALYSE THE THERMODYNAMIC PROPRIETY OF WATER Rahul Patel1 , Ramji Tripathi2 , Sukhdev Gangwar3 1 Assistant Professor, Mechanical Engineering Department of Chandra Shekhar Azad University of Agriculture and Technology, Etawah (Campus), UP – India 2 Assistant Professor, Mechanical Engineering Department of Chandra Shekhar Azad University of Agriculture and Technology, Etawah (Campus), UP – India 3 Department of Mechanical Engineering, Chandra Shekhar Azad University of Agriculture and Technology, Etawah (Campus), UP – India Abstract An experimental setup was made to analyse some of thermodynamic properties of water. In these setup two pressure cookers was used. They were connected with a brass pipe having a gateway i.e., throttling valve in it. There was a pressure gauge and a temperature gauge fixed on the cap of each pressure cooker. A flow meter connected to brass pipe by poly urethane pipe was used to measure the volume flow rate of water vapour. Steam was generated in one of the pressure cooker by boiling water and second had left empty. Now generated steam was passes through brass pipe having gateway towards second pressure cooker. In this way, all the required reading of each measuring instrument was taken by this experimental setup. Thus all the thermodynamic properties of water like Joule-Thomson curve, P-V, T-s and h-s diagrams were studying by this setup. Keywords- Pressure cookers, throttling device, free expansion, Joule-Kelvin effect, P-V, T-s and P-h diagrams ---------------------------------------------------------------------***--------------------------------------------------------------------- 1. INTRODUCTION Thermodynamics is a branch of science that deals with energy, which is essential for sustenance of life. Thermodynamics is an essential part of engineering curricula and it has a broad application area. The study of thermodynamics is based on two general laws of nature that is the first and second law of thermodynamics. This Experimental setup is very helpful for analysing the thermodynamics because with the help of this setup we can practically analyse and prove the fundamental laws of thermodynamics viz. second law of thermodynamics and throttling process. With the help of data obtained from this setup we can draw several diagrams as P-V, T-s and h-s diagrams, Joule-Thomson curve etc. With the help of this experimental setup the analysis of thermodynamic properties of steam as P, T, V, S etc. and to sketch their respective P-V, T-s and h-s diagrams can be easily done. In this experimental setup several components are used. These are listed as: 1.1 Brass Pipe To connect the two pressure cookers with each other, a brass pipe is used. This also forms a throttling device with gateway. 1.2 Gateway Gateway or throttling valve is a valve which produces restriction to flow the fluid through it. It is a constricted passage, like a partially opened valve, an orifice or a porous plug. Due to this obstruction there is an appreciable drop in pressure and the flow is said to be throttled. The gateway used in this project, is made of gun metal. Fig 1: Gateway (Throttling valve) 1.3 Temperature Gauge There are two temperature Gauges to measure the temperature of steam in each pressure cooker both are of range 0 to 150℃. These are analogue bimetallic thermometers. 1.4 Pressure Gauge Two Pressure gauges fitted in this experimental setup to measure the pressure of steam inside of each pressure cooker. Both gauges are of same range of 0 to 30 bar. These are analogue and mechanically operated gauges. 1.5 Flow Meter A flow meter is an instrument used to measure linear, non- linear, mass or volumetric flow rate of a liquid or a gas. In this setup, a flow meter using for measuring discharge of steam in litre per minute from 0 to 25 LPM.
- 2. IJRET: International Journal of Research in Engineering and Technology eISSN: 2319-1163 | pISSN: 2321-7308 _______________________________________________________________________________________ Volume: 04 Issue: 05 | May-2015, Available @ http://www.ijret.org 461 1.6 Polyurethane Pipe Polyurethane pipe has been produced for many years in an extruded thermoplastic form however the production of thermoses polyurethane has been limited. Very durable, wide range of properties, non-abrasive and wear characteristic of polyurethane is allowing its use in many applications. Fig 2: Components used in experimental setup 2. FABRICATION OF EXPERIMENTAL SETUP To complete the experimental setup first of all base of the setup is prepared and after that all other equipment’s are fixed. Experimental setup is made with frame which consists of all required equipment’s fitted with following methods: 2.1 Frame Frame is the basic requirement which provides support to the experimental setup. It may also be called as stand for this setup. It carries a stove with a gas burner on which whole assembled experimental setup is put for working. Dimensions of the frame are 57 × 34 × 57 inches, with one door at front and two windows in sides. Both the door and the windows are covered with transparent fibre sheet. This frame carries rollers to make it movable. 2.2 Drilling on the Caps of Pressure Cookers To mount the temperature gauges and pressure gauge on the each cap of pressure cookers two holes of diameter 18 mm and 16 mm respectively are required. This is done by drilling on each cap with the help of drill machine. 2.3 Drilling on the Side Wall of Pressure Cookers To connect the pressure cookers to each other with brass pipe hole of 38 mm diameter on the side wall of each pressure cookers are required. This is also done by drilling processes with the help of drill machine. 2.4 Drilling on Brass Pipe To mount the fittings on the brass pipe to connect it with flowmeter with polyurethane pipe two holes of diameter with 16 mm each are required on both side of gateway valve. 2.5 Threads Cutting Since the melting point of aliminium is lower than that of brass, pressure cookers and brass pipe cannot be welded. So use of nut and bolt assembly is more approprate. For this manufacturing of two reduce parts having external threads 32 mm and two chuck nuts having internal threads is done to tight the brass pipe with cookers. 2.6 Welding on Brass Pipe Welding of the gateway valve and other mountings on brass pipe is done with oxy-accetelyne welding because gateway valve is made of gun metal and other mounting are made of brass. Thin mild steel washer with reduce part is also welded in brass pipe so that there will no leakage of steam from pressure cookers. 2.7 Fitting Work on Caps Thermal gauge and pressure gauge are fitted on each pressure cooker cap in holes of 18 mm and 16 mm diameters repectively with the help of male-female connecters which have the external threads. Washers and Nuts are used to tightened these. Gaskits, teflon tape and anabond gaskit maker solution are used to make leak proof so that there will be no steam leakage. 3. WORKING PROCEDURE Working procedure of the experimental setup is explained in six sections as- 3.1 Procedure to Analyse Throttling Process and Joule-Kelvin Effect A steam is made to undergo continuous throttling process by a valve. The pressure and temperature of the steam in the insulated pipe upstream and downstream of the valve are measured with suitable pressure gauge and temperature gauge. Let Pi and Pf be the arbitrarily chosen pressure and temperature before throttling and let them kept constant. By operating the valve manually, the steam is throttled successively to different pressure and temperature Pf1, Tf1; Pf2, Tf2; and soon. These are then plotted on the T-P coordinates. All the points represent equilibrium states of some constant mass of steam, at which the steam has the same enthalpy. hi = hf The curve passing through all these points is an isenthalpic curve. This graph is not the graph of a throttling process, but the graph passing through the points of equal enthalpy.
- 3. IJRET: International Journal of Research in Engineering and Technology eISSN: 2319-1163 | pISSN: 2321-7308 _______________________________________________________________________________________ Volume: 04 Issue: 05 | May-2015, Available @ http://www.ijret.org 462 Fig 3: Isenthalpic Curve & Throttling Process The initial temperature and pressure of the steam before throttling are then set to new values and by throttling to different states, a family an isenthalpic is obtained for the steam. The curve passing through the maximum of these isenthalpes is called the inversion curve. The numerical value of the slope of an isenthalpe on a T-P diagram at any point is called the Joule-Kelvin coefficient and is denoted by µJT. Thus the locus of all points at which µJT is zero is the inversion curve. The region inside the inversion µJT is positive is called the cooling region and the region outside where µJT is negative is called the heating region. 𝛍𝐉𝐓 = 𝛅𝐓 𝛅𝐏 𝐡=𝐜𝐨𝐧𝐬. 0 temperature increases JT = = 0 temperature remains constant 0 temperature decreases Thus there is no change in temperature when an ideal gas made to undergo a Joule-Kelvin expansion for achieving the effect of cooling by Joule-Kelvin expansion, the initial temperature of the steam must be below the point where the inversion curve intersects the maximum inversion temperature. Fig 4: Isenthalpic Curves and Inversion Curve 3.2 Procedure to Analyse P-V Diagram To analyse and draw the P-V diagram with the help of this experimental setup one pressure cooker unit and rota-meter are required. There is no requirement of second pressure cooker unit. At starting the rota-meter and throttling valve are completely closed. Sufficient water has been taken in the pressure cooker and heats it until the pressure of steam in pressure cooker reach 15 bar where dead weight safety valve lifts. Now stop the heating pressure cooker. Gradually opening of the control valve of rota-meter shift the position of points and reading of both the pressure gauge and the rota-meter want to be noted down. From these reading P-V diagram can be draw. 3.3 Procedure to Analyse P-T Diagram To analyse and draw the P-T diagram with the help of the experimental setup only one pressure cooker unit is used. Here gateway and control valve of rota-meter is to be closed. As water starts boiling there will be fluctuation on the dials of both pressure gauge and temperature gauge. Reading of pressure and corresponding temperature are to be note down and P-T diagram can be drawn. 3.4 Procedure to Analyse T-V Diagram To analyse and draw the P-V diagram with the help of the experimental setup only one pressure cooker unit and rota meter are required. At starting the rota meter and throttling valve are completely closed. Sufficient water has been taken in the pressure cooker and heats it until the pressure of steam in pressure cooker reach 15 bar where dead weight safety valve lifts. Gradually opening of the control valve of rota meter shifts the position of points and reading of both the temperature gauge and the rota meter want to be noted down. From these reading T-V diagram can be draw.
- 4. IJRET: International Journal of Research in Engineering and Technology eISSN: 2319-1163 | pISSN: 2321-7308 _______________________________________________________________________________________ Volume: 04 Issue: 05 | May-2015, Available @ http://www.ijret.org 463 3.5 Procedure to Analyse Free Expansion To analyse the free expansion process with the help of this experimental setup both throttling valve and control valve of rota-meter are kept closed. Now generate the steam in first pressure cooker unit and kept its temperature and pressure constant Ti, Pi arbitrary. Now suddenly opening of the gateway valve allow the steam pass towards second pressure cooker unit. Initially its temperature decreases to temperature say, Tint but after a very short time, steam temperature increases and reaches its final temperature which is equal to temperature of pressure cooker unit i.e. Ti = Tf. This increase in temperature is due to friction between wall of pipe and molecules of steam. In this way, note down readings of Ti, Tf at different initial condition and make a table and draw the curve with dotted line because it is an irreversible process. 4. RESULT & ANALYSIS This setup is very useful in having practical approach in thermodynamics. Many experiments on this setup have done and the readings are notted down of pressure, temperature and volume. After these other corresponding characteristics are find out like enthalpy, Joule Kelvin Coefficient, drawn P- T, P-V and T-V diagrams. 4.1 Analysis of Throttling Process & Joule-Kelvin Effect To analyze throttling process and Joule-Kelvin Effect, Joule- Kelvin curve had drawn and the Joule-Kelvin coefficient (µJT) also calculated on each point of each isenthalpe and draw the 0inversion curve where the value of µJT is zero. The region inside the inversion for which µJTis positive is cooling region and the region for which µJTis negative is heating region. The coordinates of joule kelvin curve enlisted in table-1. Table 1: Coordinates of Joule-Kelvin Curves Isenthalpe 1 Isenthalpe 2 Isenthalpe 3 Pressure(bar) Temperature(O C) Pressure(bar) Temperature(O C) Pressure(bar) Temperature (O C) 15.0 050 14.0 070 14.0 090 14.5 055 13.5 075 13.0 100 14.0 060 13.0 080 12.5 105 13.5 065 12.5 085 12.0 110 13.0 070 12.0 090 11.5 115 12..5 075 11.5 095 11.0 117 12.0 080 11.0 097 10.5 120 11.5 085 10.5 100 09.5 125 11.0 087 09.5 105 08.5 128 10.5 090 08.5 108 08.0 130 09.5 095 08.0 112 07.0 135 08.5 098 07.0 112 06.0 135 08.0 100 06.0 112 05.0 135 07.0 100 05.0 112 04.0 135 06.0 100 04.0 110 03.0 130 05.0 095 03.0 107 02.5 125 04.0 090 02.5 102 02.0 120 03.0 080 02.0 097 01.5 115 02.0 070 01.5 090 01.0 110 01.0 060 01.0 080 00.5 100 00.0 050 00.0 070 00.0 090 Calculated value of Joule-Kelvin coefficients are enlisted in following tables: Table 2: Joule-Kelvin Coefficients for isenthalpe 1 T1 T2 P1 P2 ∂T=T2-T1 ∂P=P2-P1 ∂T/∂P=µJT Effect 070 080 02 03.0 10 01 10>0 Cooling 090 095 04 05.0 05 01 5>0 Cooling 050 060 00 01.0 10 01 10>0 Cooling 100 100 07 08.0 00 01 0 Inversion 098 095 08 08.5 -3.0 0.5 -6<0 Heating 095 090 9.5 10.5 -5.0 01 -5<0 Heating 087 085 11 11.5 -2.0 0.5 -4<0 Heating
- 5. IJRET: International Journal of Research in Engineering and Technology eISSN: 2319-1163 | pISSN: 2321-7308 _______________________________________________________________________________________ Volume: 04 Issue: 05 | May-2015, Available @ http://www.ijret.org 464 Table 3: Joule-Kelvin Coefficients for isenthalpe 2 T1 T2 P1 P2 ∂T=T2-T1 ∂P=P2-P1 ∂T/∂P=µJT Effect 090 097 01.5 02 07 0.5 14>0 Cooling 102 107 02.5 03 05 0.5 10>0 Cooling 070 080 00.0 01 10 1.0 10>0 Cooling 112 112 07.0 08 0.0 1.0 0 Inversion 108 105 08.5 9.5 -3.0 1.0 -03<0 Heating 100 097 10.5 11 -3.0 0.5 -06<0 Heating 075 070 13.5 14 -5.0 0.5 -10<0 Heating Table 4: Joule-Kelvin Coefficients for isenthalpe 3 T1 T2 P1 P2 ∂T=T2-T1 ∂P=P2-P1 ∂T/∂P=µJT Effect 100 110 00.5 01.0 10 0.5 20>0 Cooling 115 120 01.5 02.0 05 0.5 10>0 Cooling 125 130 02.5 03.0 05 0.5 10>0 Cooling 135 135 06.0 07.0 0.0 1.0 00.0 Inversion 130 128 08.0 08.5 -02 0.5 -04<0 Heating 117 115 11.0 11.5 -02 0.5 -04<0 Heating 100 090 13.0 14.0 -10 1.0 -10<0 Heating Fig 5: Joule-Kelvin Curve For ideal condition from steady state energy equation : dQ - dWx= dh + V.dv + g.dz ⇒ dh +V.dv + g.dz = 0 here dQ = 0 ( due to insulation) ⇒ dh = 0 ⇒ h2- h1 = 0 ⇒ h1= h2 Fig 6: P-h Curve of water vapour Each isenthalpe should carry constant enthalpy on each point on curve. Since there is irreversbility and heat dissippation towards surrounding. There is some variation in enthalpies at different points on isenthalpe’s. If we draw the P-h curve for better understanding, there should ideally be a vertical line but actual line is not vertical due to irreversibility and heat dissipation. 4.2 Analysis of P-T diagram After taking the readings of pressure and temperature with the experimental setup, P-T diagram can be drawn. As water is saturated vapour so these temperature and pressure are saturated temperature and saturated pressure. Hence formed P-T diagram shows only the line of vaporization of whole P- T diagram. This shows that as temperature increases, pressure also increases with it. Real diagrams are at least similar to ideal diagram. 0 2 4 6 8 10 12 14 16 2600 2620 2640 2660 2680 Pressureinbar Enthalpy in J/kg Varriationof Enthalpy
- 6. IJRET: International Journal of Research in Engineering and Technology eISSN: 2319-1163 | pISSN: 2321-7308 _______________________________________________________________________________________ Volume: 04 Issue: 05 | May-2015, Available @ http://www.ijret.org 465 Fig 7: P-T diagram of water vapour Fig 8: P-T diagram of water vapour 4.3 Analysis of T-V Diagram To analyze and draw the T-V diagram, volume can be find by multipling the time in discharge that is in LPM. Volume is calculated for one minuts. V is more than volume of saturated liquid and less than volume of saturated vapour (Vf < V< Vg) so steam is saturated and so diagram shows the saturated vapour line of T-V diagram. This diagram shows that the volume of discharge increases with the saturation temperature. To check the accuracy of setup and diagram, these diagrams are compared to the diagram drawn from data of standard steam table. The real curves are not exact but simillar to ideal curve. Fig 9: T-V Diagram of water vapour 4.4 Analysis of P-V Diagram This diagram shows the saturated vapour line of water vapour. This diagram also shows that the volume of steam decreases as the saturation pressure increases. It is hyperbolic curve. To check the accuracy of setup and diagram, these diagrams are compared to the diagram drawn from data of standard steam table. Here also real diagrams are at least similar to ideal diagram. Fig 10: P-V Diagram of water vapour 4.5 Analysis of Free Expansion Process Free expansion or unresisted expansion or Joule expansion is one in which fluid expands suddenly into a vacuum chamber through an orifice of large size. There is not vacuum in pressure cooker in which steam is expanded, but when we expandes the steam in empty pressure cooker suddenly, we observered same result as in ideal free expansion with vacuum chamber for a small time period. So we analyzed the free expansion with assumption that there is vacuum in pressure cooker for an instant. 0 2 4 6 8 10 12 14 16 18 20 50 70 90 110 130 Pressureinbar Temperature OC Real Curve 1 Ideal Curve Real Curve2 0 2 4 6 8 10 12 14 16 18 20 20 70 120 Pressureinbar Temperature OC Ideal Curve Real Curve2 Real Curve 1 40 50 60 70 80 90 100 110 120 130 4 9 14 TemperatureOC Volume V Real Crve1 Ideal Curve Real Curve2 0 2 4 6 8 10 12 14 16 4 9 14 19 Pressureinbar Volume V Real Curve 1 Real Curve2 Ideal Curve
- 7. IJRET: International Journal of Research in Engineering and Technology eISSN: 2319-1163 | pISSN: 2321-7308 _______________________________________________________________________________________ Volume: 04 Issue: 05 | May-2015, Available @ http://www.ijret.org 466 The final temperature of the steam is same as the initial temperature in steam generating pressure cooker. Though the expansion of steam through gateway valve causes fall in temperature, the friction converts the kinetic energy into heat which increases the temperature to the original temperature. Table 5: Temperature observed in free expansion experiment T Initial (Ti o C) TIntermediate (T o C) TFinal (Tf o C) 125 123.0 125 123 121.5 123 120 117.0 120 This process is highly irreversible since the steam is eddying continuously during the process. As after generating the ample amount of steam, heat supply is stopped, then the free expansion in analyzed. In this process as no external heat has been supplied and no work has been done during the expansion process, there is no change in internal energy. The enthlpy of the steam remains constant during process. The non flow energy equation can be applied between the initial and final states. Q = W + ( U2 – U1 ) ⇒ ( U2 – U1 ) = 0 ⇒ m . Cv . ( T2 – T1 ) = 0 ⇒ ( T2 – T1 ) = 0 ⇒ T2= T1 The free differs from isothermal expansion in having no work transfer. For the same reason, it is not reversible adiabatic process. The free expansion is irreversible process and can not be truly represented on P-V diagram. It is represented by dotted line on P-V diagram. Fig 11: P-V Diagram showing reversible & irreversible process 4.6 Analysis of Dryness Fraction Dryness fraction or quality is the ratio of the mass of vapor to the total mass of mixture. 𝑫𝒓𝒚𝒏𝒆𝒔𝒔 𝑭𝒓𝒂𝒄𝒕𝒊𝒐𝒏, 𝑸 = 𝒎 𝒗 𝒎𝒕 Where : mv = Mass of vapour ml = Mass of liquid mt = Total mass of mixture = mv + ml But for calculating quality of steam at diffrerent point of pressure and temperature, calculation of entropy is easy because of online entropy calculator and then with help of steam table of saturation pressure, dryness fraction of steam can be calculated by using the formula which is enlisted in the table 6. Table 6: Dryness fraction with it’s calculation P bar T O C s kJ/kgK sf kJ/kgK Sfg kJ/kgK x = (S – Sf)/Sfg 15.0 050 7.347 1.307 6.048 0.9986 14.5 055 7.358 1.303 6.057 0.9983 14.0 060 7.371 1.287 6.091 0.9988 13.5 065 7.382 1.276 6.115 0.9984 13.0 070 7.395 1.270 6.125 0.9989 12.5 075 7.408 1.252 6.163 0.9982 12.0 080 7.422 1.245 6.182 0.9994 11.5 085 7.436 1.230 6.202 0.9985 10.5 090 7.467 1.201 6.270 0.9993 8.5 098 7.539 1.135 6.409 0.9992 8.0 100 7.559 1.125 6.431 0.9995 7.0 105 7.604 1.079 6.530 0.9996 6.0 110 7.657 1.035 6.560 0.9991 3.0 080 7.895 0.980 6.747 0.9987 2.0 070 8.036 0.737 7.296 0.9997 5. CONCLUSION Result of the experimental setup have explaneed and analyze the accuracy of this setup by comparing these results to corresponding data of standard books. Although all the curves have atleast similarty with ideal curve of standard books but there are many errors in these curves due to irreversibility, heat dissipation to surrounding and error during taking readings. After all these finally some of conclusion find out and those are: 1. The Joule-Kelvin Curve analyzed the Joule Kelvin effect, inversion curve and calculated the Joule-Kelvin coefficient for each isenthalpe. 2. The throttling process is prooved that it is isenthalpic process practically and mathematically. 3. Practical observation of free expansion process prooved that in this process initial and final temperature remain constant practically and drew a dotted curve which shows that it is an irreversible process. 4. The drawn P-T, P-V and T-V diagrams are analyzed practically and compared it to ideal diagrams and studied about the irreversibility of these diagrams. 5. Entropy of steam at different pressure and temperature dryness fraction of steam are calculated at each point. 0 1 2 3 4 5 6 7 8 9 10 4 6 8 10 12 14 16 18 Pressureinbar Volume V ReversibleCurve IrreversibleCurve
- 8. IJRET: International Journal of Research in Engineering and Technology eISSN: 2319-1163 | pISSN: 2321-7308 _______________________________________________________________________________________ Volume: 04 Issue: 05 | May-2015, Available @ http://www.ijret.org 467 REFERENCES [1] Yunus Ali Cengel & Michael A. Boles, “Thermodynamics An Engineering Approach”, Tata McGraw-Hill, New Delhi, 7th edition, 2011. [2] P K Nag, Engineering Thermodynamics, “Tata McGraw-Hill, New Delhi”, 4th edition, 2008. [3] Ernest O Doebelin & Dhanesh N Manik, Measurement System Application and Design, Tata McGraw-Hill, New Delhi,5th edition, 2007. [4] R.S. Khurmi & J.K.Gupta, A Textbook of Machine Design, S.Chand, New Delhi,2011. [5] P N Rao, Manufacturing Technology Vol-1, Tata McGraw-Hill, New Delhi, 3th edition, 2011. [6] Shigley & Mischke, Mechanical Engineering Design, Tata McGraw-Hill, New Delhi, 8th edition, 2008. [7] Mathur & Mehta, Thermal Science and Engineering, Jain Brothers, New Delhi, 2002. [8] D.M. Considine, Process Instruments and Controls Handbook, Tata McGraw-Hill, New York, 3rd edition. [9] R.W.Bradspies, Bourdon Tubes, Giannini Tech. Notes, Giannini Corp, Duarte, 1961. [10] V.P.Head, Float-Type Variable-Area Flowmeters,Trans. ASME, August 1954. [11] Guide to By-Pass Rotameter Application, Tech. Bull, Brooks Instrument. (www.brooksinstrument.com). [12] R. Gitlin, How Temperature Effects Instrument Accuracy, Contr., April, May, June 1995. [13] S.G. Eskin & J.R. Fritze, Thermostat Bimetals, Trans. ASME, July 1940. BIOGRAPHIES 1 Er. Rahul Patel is working as an Assistant Professor From 1st January 2014 to till now in Mechanical Engineering Department, Chandra Shekhar Azad University of Agriculture and Technology, Etawah (Campus) – INDIA. He is Graduated, B.tech (Mechanical Engineering) Batch- 2013, from- Baba Saheb Dr Bhim Rao Ambedkar Collage of Agricultural Engineering and Technology Etawah- 206001. His area of interest is Thermal Engineering as well as Production Engineering, Specially Refrigeration and Air Conditioning. E-mail: rahul.patelworld@gmail.com, Contact No:- +919450800992 2 Er. Ramji Tripathi is working as an Assistant Professor From 1st January 2014 to till now in Mechanical Engineering Department, Chandra Shekhar Azad University of Agriculture and Technology, Etawah (Campus) – INDIA. He is Graduated, B.tech (Mechanical Engineering) Batch- 2013, from- Baba Saheb Dr. Bhim Rao Ambedkar Collage of Agricultural Engineering and Technology Etawah- 206001. His area of interest is Thermal Engineering. E-mail: mychemistry123@gmail.com, Contact No:- +917499246976 3 Sukhdev Gangwar, Pursuing B.tech Degree in Mechanical Engineering from Baba Saheb Dr. Bhim Rao Ambedkar College of Agricultural Engineering & Technology, Etawah U.P. Affilation:- Chandra Shekhar Azad University of Agriculture And Technology Kanpur , Pin-206001. India, E-mail: dev.caet@gmail.com, Contact No:- +919458659168. 12th Passout from Jawahar Navodaya Vidyalaya Pilibhit- U.P.