Experimental investigation of air flow characteristics in rectangular channel using pedestals as vortex generator

Abstract This experimental study is to investigate the effect or influence of pedestal vortex generator on one wall of rectangular duct on the flow performance. The effects of geometrical parameters of pedestal vortex generator and aspect ratio of duct on friction factor ratio have resulted in Reynolds number which is based on hydraulic diameter of the rectangular channel in the range 8000 to 24000. The factors which are varied for vortex generator were pitch to height ratio of vortex generator (p/h) and aspect ratios of vortex generators (Δ). Vortex generator numbers were also varied on wall at axial locations. Experimental results reported for aspect ratio 2.8, 5.5, 7.3 and 1.6 of pedestal vortex generator and pitch to height ratio (P/h) 4,8,12, 16. And 8000 to 24000 is the range of Reynolds number. Experimentally investigated that the friction factor ratio increases with increase in Reynolds number and friction factor ratio increases with decrease in pitch to height ratio. For pedestal vortex generator with aspect ratio 2.8 and height 8mm the results were, For pitch to height ratio (P/h)=16 friction factor ratio for 8000 Reynolds number is 27.12% less than the friction factor ratio for the Reynolds number 24000. So it is clear that friction factor ratio increases with increase in Reynolds number. And for Reynolds number 20000, pitch to height ratio (P/h) =4 friction factor ratio is 21.14% greater than pitch to height ratio (P/h)=16 so we can say that friction factor ratio increases with decrease in pitch to height ratio. Keywords: Pitch to height ratio, Aspect ratio, Pressure drop, Hydraulic diameter, Pedestals

Recommended
More Related Content
What's hot
What's hot (20)
Viewers also liked
Viewers also liked (20)
Similar to Experimental investigation of air flow characteristics in rectangular channel using pedestals as vortex generator
Similar to Experimental investigation of air flow characteristics in rectangular channel using pedestals as vortex generator (20)
More from eSAT Journals
More from eSAT Journals (20)
Recently uploaded
Recently uploaded (20)
Experimental investigation of air flow characteristics in rectangular channel using pedestals as vortex generator
- 1. IJRET: International Journal of Research in Engineering and Technology eISSN: 2319-1163 | pISSN: 2321-7308 _______________________________________________________________________________________ Volume: 04 Issue: 09 | September-2015, Available @ http://www.ijret.org 309 EXPERIMENTAL INVESTIGATION OF AIR FLOW CHARACTERISTICS IN RECTANGULAR CHANNEL USING PEDESTALS AS VORTEX GENERATOR Anandkumar S Malipatil1 , Praveen Siddanna 2 1 AssistantProfessor, Thermal power engg., VTU,Ro/PG,Kalaburagi, India 2 P.G.student, Thermal power engg., VTU,Ro/PG,Kalaburagi, India Abstract This experimental study is to investigate the effect or influence of pedestal vortex generator on one wall of rectangular duct on the flow performance. The effects of geometrical parameters of pedestal vortex generator and aspect ratio of duct on friction factor ratio have resulted in Reynolds number which is based on hydraulic diameter of the rectangular channel in the range 8000 to 24000. The factors which are varied for vortex generator were pitch to height ratio of vortex generator (p/h) and aspect ratios of vortex generators (Δ). Vortex generator numbers were also varied on wall at axial locations. Experimental results reported for aspect ratio 2.8, 5.5, 7.3 and 1.6 of pedestal vortex generator and pitch to height ratio (P/h) 4,8,12, 16. And 8000 to 24000 is the range of Reynolds number. Experimentally investigated that the friction factor ratio increases with increase in Reynolds number and friction factor ratio increases with decrease in pitch to height ratio. For pedestal vortex generator with aspect ratio 2.8 and height 8mm the results were, For pitch to height ratio (P/h)=16 friction factor ratio for 8000 Reynolds number is 27.12% less than the friction factor ratio for the Reynolds number 24000. So it is clear that friction factor ratio increases with increase in Reynolds number. And for Reynolds number 20000, pitch to height ratio (P/h) =4 friction factor ratio is 21.14% greater than pitch to height ratio (P/h)=16 so we can say that friction factor ratio increases with decrease in pitch to height ratio. Keywords: Pitch to height ratio, Aspect ratio, Pressure drop, Hydraulic diameter, Pedestals ------------------------------------------------------------------***------------------------------------------------------------------------ 1. INTRODUCTION There are many uses in engineering processes in which we come across addition or removal of heat for this to happen we use heat exchange equipment‟s in wide applications of engineering. Flow in channels gains more attention because of their uses in heat exchangers. In channels we use vortex generators which obstruct the flow and produce vortices due to these vortices heat transfer rate is enhanced. There are many types of vortex generators which are used in channel flow and the most often used are ribs, wings and winglet pairs. And for these vortex generators there are many number of methods to raise the coefficient of heat transfer. Commonly used methods are active, passive and compound methods. But here we are using passive method in which no external power is used but we make use of geometry of surface which is main factor in passive method, where as in active method we use external power like mechanical equipment‟s, surface vibration ,electric or acoustic fields. The method which makes use of both active and passive method is named as compound method. In passive method the main factors which raises the heat transfer rate mainly depends on two important things one is disturbing thermal layer and mixing of bulk fluid. This disturbance in the presence of roughness elements will raise the heat transfer rate by producing a boundary layer which is thinner than undisturbed thermal boundary layer. Mixing of bulk fluid increases the heat transfer rate and because of vortices produced due to disturbance reduces thermal gradient in the center and it mainly on side wall region of the channel. This can be achieved by using vortex generators. The method which uses vortex generators to raise the heat transfer rate is named as induced vortex enhancement technique. The vortex generators are mainly divided into four forms on the basis of their geometry. Ribs, winglet pairs, delta wings and delta winglet pairs. Vortex generators which disturb the flow and produce vortices which further increase the heat transfer rate and these shapes of vortex generators are either be cut or punched. And these vortex generators are attached to the surface of the channel which is to be roughened. These vortex generators stick to the surface which is to be roughened with the help of glue or anabond. And the channel which we are using is two way closed channel And the material used for channel is transparent acrylic sheets. Mixing can also be effected using ribs, dimples and surface bumps. Ribs are also most commonly used type of vortex generators and vortex generators used here are rectangular pedestals. And the most attractive heat transfer rise can be achieved by dimples. These produce multiple vortex pairs that supplement local nusselt number distributions. They actually do not peek into the flow because of low pressure drop is being produced by dimples. Other than dimples like ribs are attached to the surface with the help of glue or anabond and
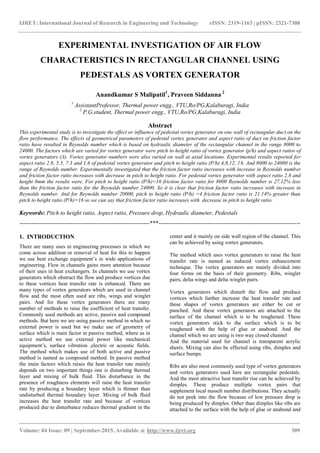
- 2. IJRET: International Journal of Research in Engineering and Technology eISSN: 2319-1163 | pISSN: 2321-7308 _______________________________________________________________________________________ Volume: 04 Issue: 09 | September-2015, Available @ http://www.ijret.org 310 these are kept at angle with respect to open stream end. In ribs since they extend into the flow because of this ribs produces higher pressure drop than the dimples. And same case with pedestals which offer higher pressure drop. The material used for pedestals is transparent acrylic which is cut into shapes with base which resembles the base of the channel surface which is roughened. The duct we are using is rectangular duct with turbulent flows. 2. VORTEX GENERATORS These are the members which obstruct the flow and produce vortices that raise heat transfer rate. There are various types of vortex generators that can be used to obstruct the flow and they are such ribs, winglet type generators, delta wing and these are used in cooling methods in gas turbine blades. But the vortex generator which we are using here is PEDESTALS. Rectangular pedestals which are of acrylic material and they are cut according to the aspect ratio. Due to this, longitudinal vortices are produced and effects of these vortices on heat transfer rate and pressure drop from the wall duct are studied successfully. Fig 1 Vortex generators with different heights and aspect ratios Pedestals as vortex generators with different aspect ratio (Δ) are used Δ= 2.8, 7.3, 1.6 and 5.5 Fig 2 Geometry of the pedestal vortex generator Aspect ratio for pedestals vortex generator = b/h (P/h) = it is the ratio of pitch to height of the vortex generator Where, b= width or base of the vortex which resembles the hydraulic diameter of rectangular channel h = height of the pedestal vortex generator p = pitch 3. EXPERIMENTAL SET UP AND DATA REDUCTION Experimental set up is constructed once all the operations of fabrication are done. To place the venturimeter, rectangular channel and gate valve what we have done is we designed a steel table like structure to place the equipment‟s required to measure the air flow rate. And equipment‟s heights are adjusted so that the entire set up is at equal height so that do not disturb the flow of air. The insides of venturimeter and transition pieces are smoothly finished to avoid back pressure due to disturbance to the flow. Air is entered from blower through a gate valve which can be closed and opened according to the requirement. First we take readings for smooth duct i.e. without placing the vortex generators in the channel which obstructs the flow. And Reynolds number is varied from 8000 to 24000 based on the hydraulic diameter of the rectangular channel and due to this there will be variation in U- tube due to pressure drop across venturimeter. And to measure the pressure drop in rectangular channel it is connected to differential manometer which contains two fluids one is water and the other one is benzyl alcohol of specific gravity 1.04 and weight 1046kg/m3 and it is measured when the pressure is very small. It is by operating blower, the air is taken inside duct section through gate valve. It is operated to vary for Reynolds number upon which it either closed or opened. Air is entered in the test section and it is measured by venturimeter connected to U-tube manometer showing small pressure drop and difference in pressure at the test section is calculated using differential manometer. After taking readings for pressure drop in differential manometers calculations are done according to the data required for it to find out frictional factor ratio for different configuration. And the vortex generators pedestals which are of 4mm thickness are placed in the chaanel base using sealant Anabond to stick firmly according to the aspect ratio and pitch. And readings were taken for different pitch and different aspect ratio. And the maximum preesure rise in the differential manometer is 85cm. U tube manometer is used to measure large pressure drop. Two pressure taps are drilled to the test section to measure the average pressure drop. 4. DATA REDUCTION 4.1 Reynolds number (Re): Reynolds number is calculated based on hydraulic number of the duct obtained from the equation Re= ρVDh /µ Re= VDh/ν Smooth duct frictional factor (fs) or theoretical friction factor: Blasius equation is used to calculate friction factor for fully developed turbulent flows in a smooth duct fS =0.046(Re)-(0.2) Mass flow rate through duct section: m = ρQ kg/sec 4.2 Experimental or actual friction factor ratio (f): This is calculated from test section using average velocity of air in the channel and measured pressure drop. And this is done at atmospheric temperature i,e at room temperature without heating And friction factor is calculated using air density at atmospheric temperature.
- 3. IJRET: International Journal of Research in Engineering and Technology eISSN: 2319-1163 | pISSN: 2321-7308 _______________________________________________________________________________________ Volume: 04 Issue: 09 | September-2015, Available @ http://www.ijret.org 311 4.3 Pressure loss in the channel is h = 4fLV2 /2gDh Δp = 4fLV2 /2gDh f = Δp / {(4L/Dh) (ρaV2 /2)} 4.4 Pressure Drop (ΔP): It can be calculated using pressure in the duct section pressure taps connected across differential manometer. Pressure drop in the duct was estimated from the differential pressure head as: Δp = gy {ρm +ρw[ (d/D)2 -1]} N/m2 4.5 Friction factor ratio based on equal Reynolds number: ff = f/fS 5. RESULTS AND DISCUSSIONS SMOOTH DUCT 0 0.001 0.002 0.003 0.004 0.005 0.006 0.007 0.008 0.009 0 5000 10000 15000 20000 25000 30000 ff Re Re v/s ff fa ft Fig 4 smooth duct curve Fig 4 is as shown in above graph. It is obtained by plotting friction factor ratio against Reynolds number. The „fa” is the actual friction factor and ft is theoretical friction factor which is obtained from Blasius equation and actual friction factor is obtained from the experimental readings. From the graph we come to the result that actual friction factor goes good with theoretical within the range of ±6% and ±4%. From the graph if the distance between the lines is more there will be more error in the experiment Fig 5 Re Vs f/fs AR= 2.8 and h=8mm Fig 5 is as shown above it is obtained by plotting Reynolds number against friction factor ratio for vortex generator AR= 2.8 and for (P/h) = 4, 8, 12 and 16. From the graph we can say that as the Reynolds number increases friction factor ratio also increases. Because rate of vortex formed depends on flow velocity in the channel and flow velocity is directly proportional to Reynolds number. So increase in flow velocity leads to increase in pressure drop and consequently friction factor ratio. For (P/h)=16, friction factor ratio for Reynolds 8000 is 27.12% less than the friction factor ratio for Reynolds number 24000 so from the graph we can conclude that friction factor ratio increases with increase in Reynolds number Fig 6 P/h Vs f/fs AR=2.8, h=8mm
- 4. IJRET: International Journal of Research in Engineering and Technology eISSN: 2319-1163 | pISSN: 2321-7308 _______________________________________________________________________________________ Volume: 04 Issue: 09 | September-2015, Available @ http://www.ijret.org 312 Fig 6 is as shown in the above graph and the graph is plotted pitch to height ratio against friction factor ratio. Mixing of flow is important here, if axial pitch is smaller then the flow gets disturbed by next pedestal vortex generator which results in higher pressure drop. If the pitch between the vortex generators is high then pressure drop decreases which again results in decrease in friction factor ratio. For aspect ratio 2.8 and for Reynolds number 20000 (P/h)=4 is 21.14% is greater than the (P/h)=16, so from this we come to the result that pitch to height ratio increases with decrease in friction factor ratio. Fig 7 Re Vs f/fs AR=7.3, h=3.1mm Fig 7 is as shown above it is plotted Reynolds number against friction factor ratio and it is seen that as the Reynolds number increases for different pitch to height ratio friction factor ratio also increases. It mainly depends on the velocity of flow inside the channel. If Velocity is high then pressure drop increases and automatically friction factor ratio also increases. For pitch to height ratio (P/h)=12, friction factor ratio for 24000 Reynolds number is 28.6% greater than friction factor ratio at Reynolds number 8000. So from this we can say that friction factor ratio increases with increase in Reynolds number Fig 8 P/h Vs f/fs, AR=7.3, h=3.1mm Fig 8 is as shown above it is obtained by plotting pitch to height ratio against friction factor ratio. Proper vortices are formed when the distance between pedestals vortex generators is more then there will be less chance of flow getting disturbed by next pedestal vortex generator if the axial distance is small then pressure drop increases which again results in increase of friction factor ratio. Reynolds number 20000 for (P/h=12) friction factor is 23.57% greater than the friction factor ratio at (P/h)=16 so from the graph it is clear that friction factor increases with decrease in pitch to height ratio. Fig 9 Re Vs f/fs, AR=1.6, h=14.1mm
- 5. IJRET: International Journal of Research in Engineering and Technology eISSN: 2319-1163 | pISSN: 2321-7308 _______________________________________________________________________________________ Volume: 04 Issue: 09 | September-2015, Available @ http://www.ijret.org 313 Fig 9 is as shown above it is the graph resulted when the Reynolds number is plotted against fiction factor ratio for different pitch to height ratio of vortex generators. It is seen that velocity of flow is less for 8000 Reynolds number to that of 24000 Reynolds number. So from this we can say that higher the velocity of flow in the rectangular channel the higher the Reynolds number which again results in high pressure drop and friction factor ratio. Example for (P/h)=4 friction factor ratio for 8000 is 20.67% less than that of friction factor ratio at Reynolds number 24000. 0 2 4 6 8 10 12 14 0 5 10 15 20 f/fs p/h f/fsv/s p/h Re=8000 Re=12000 Re=16000 Re=20000 Re=24000 Fig 10 P/h Vs f/fs, AR=1.6, h=14.1mm Fig 10 variation of pitch to height ratio to friction factor ratio for different Reynolds number is shown in the above figure. If the pedestals vortex generator are placed with less pitch in the channel then flow gets disturbed in the earlier stage due vortices being obstructed by next placed pedestal vortex generator. This results in higher pressure drop and friction factor ratio. For Reynolds number 20000 for (P/h) =4 friction factor is 29.27% is greater than friction factor ratio at (P/h)=16. So it is clear from the graph friction factor ratio decrease with increase in pitch to height ratio. 0 0.5 1 1.5 2 2.5 3 3.5 4 4.5 0 10000 20000 30000 f/fs Re Re v/s f/fs p/h=4 p/h=8 p/h=12 p/h=16 Fig 11 Re Vs f/fs, AR=5.5, h=4.1mm Fig 11 is as shown in the figure. The parameters which are presented in this graph are Reynolds number against friction factor ratio. And from fig.9, and fig.11 it is seen that as the aspect ratio increases with in Reynolds number and flow velocity increase leads increase in Reynolds number and pressure drop and friction factor ratio also increases for pitch to height ratio for (P/h)=12 the friction factor ratio for Reynolds 8000 is 3.5% lesser than friction factor ratio for Reynolds number 24000. So we came to result that friction factor increases with increase in Reynolds number and as the aspect ratio increases friction factor ratio also increases. Fig 12 P/h Vs f/fs, AR=5.5, h=4.1mm
- 6. IJRET: International Journal of Research in Engineering and Technology eISSN: 2319-1163 | pISSN: 2321-7308 _______________________________________________________________________________________ Volume: 04 Issue: 09 | September-2015, Available @ http://www.ijret.org 314 Fig 12 shows variation of pitch to height ratio to the friction factor ratio as shown in the above figure. From fig.10 and fig.12 it is seen that aspect ratio decreases with increasing friction factor ratio and here from the graph it is seen that if the axial distance is less it results in higher friction factor ratio. From the graph taken for Reynolds number 16000 and for (P/h)=12 friction factor is 5.2% greater than (P/h)=16. So we can conclude that friction factor increases with decrease in pitch to height ratio. CONCLUSION: From the experimental study and graphs obtained by experimental investigation the following conclusions can be drawn: As the height of the vortex generator increases friction factor ratio also rises due to more blockage to the flow. Friction factor ratio increases with increase in aspect ratio of the vortex generators. As the Reynolds number increases the friction factor ratio increases significantly. It is observed that with more circulation of vortices there is raise in the resistance to the flow and friction factor ratio of higher value is obtained. With reducing pitch to height ratio (p/h) friction factor ratio starts rising for Reynolds number ranging 8000 to 24000. Shorter pitch to height ratio results in shorter axial distance before the flow get disturbed by next pedestals VG‟s which again increases the pressure drop. REFERENCES [1]. G.V.Phadtare, S.V.Channapattana, Dr.S.L.Bosedr. A.A.Pawar “Experimental Investigations Of Heat Transfer Enhancement In A Tip Of 180-Degree Bend Square Duct With Vortex Generators” Ijest – Issn 0975-5462, Volume 5, July 2013 [2]. I .Jaswal , F.E.Ames “Heat Transfer And Pressure Drop Meassurements In Constant And Converging Section Pin And Diamond Pedestal Arrays” Journal Of Thermal Science And Engineering Applications,Volume1, 21 July, 2009 [3]. Gongnan Xie, Li,Shain; Zhang,Weihong And Sunden ,Bengt “ Computational Fluid Dynamics Modeling Flow Field And Side Wall Heat Transfer In Rectangular Rib-Roughed Passages” Journal Of Energy Resources Technology ,Volume 135,Isn 0195-0738,Doi 10.1115/1.4023332 [4]. Sean C. Jenkins, Frank Zehnder, Igorv.Shevchuk,Jns Vowolfersdrof, Bernard Weighgand And Martin Schineder “ The Effects Of Ribs And Tip Wall Distance For A Varying Aspect Ratio Two Pass Ribbed Internal Cooling Channel” Journal Of Turbomachinery ,Volume 135, Issue 2,2013 [5]. Manvendra Tiwari, Sujoy Kumar Saha “Laminar Flow Through Circular Tube Having Transverse Ribs And Twisted Tapes” Journal Of Thermal Science And Engineering Applications, Volume 7, Issue 4,Dec 1 2015 [6]. S.V. Garimella, P.A.Eibeck “ Enhancement Of Single Phase Convective Heat Transfer From Protruding Elements Using Vortex Generators” International Journal Of Heat And Mass Transfer, Volume 34,Pages 2431-2433,Doi 10.101 [7]. Jeen-Jiang Hwang “Heat Transfer-Friction Characterstic Comparission In A Rectangular Channel With Attached And Detached And Attached Detached Ribs On Two Wall Surface”International Gas Turbine And Aeroengine Congress And Exhibhition, June 5 1997 [8]. K. Arun And S.V.Prabhu “Effect Of Aspect Ratio,Channel Orientation,Rib Pitch To Height Ratio, And Ribbed Walls On Pressure Drop Characterstics In A Rotating Channel With Detached Ribs” International Journal Of Rotating Machinery, October 2006 [9]. Mohit Taneja, Sandeep Nandal, Arpan Manchandan, Ajay Kumar Agarwal “Experimental Study Of Convective Heat Transfer And Thermal Performance In The Heat-Sink Channel With Various Geometrical Configurations Fins” Ijett, Volume 4,June 2013,Issn 2231-5381 [10]. Amnart Boonloi, “Turbulent Forced Convection In A Heat Exchanger Square Channel With Wavy-Ribs Vortex Generator” Journal Of Chemical Engineering, April 2015, Pages.1765-1779 BIOGRAPHIES My self AnandKumar S Malipatil working at VTU as Assistant Professor .I have a teaching experience of 6 Years and I,am persuing my Phd in heat transfer and fluid flow area. Praveen siddanna securing m.tech degree in thermal power engineering,VTU Ro/PG kalaburagi and completed B.E in klecet belgaum and area of interest is “heat transfer and fluid flow”