2. 2 food and bioproducts processing 9 8 ( 2 0 1 6 ) 1–10
Such disadvantages of hexane have challenged researchers
to establish substitute solvents for the vegetable oil extrac-
tion (Johnson and Lusas, 1983; Kuk and Hron, 1998; Russin
et al., 2011). The most cited substitutes are: water with or
without enzyme addition (Campbell et al., 2011; Rosenthal
et al., 1996), terpenic hydrocarbons (limonene, ␣-pinene, p-
cymene) (Li et al., 2014), supercritical fluids (carbon dioxide)
(Ayas and Yilmaz, 2014; Rebolleda et al., 2012, 2014), and short
chain alcohols, especially ethanol and isopropanol (Hu et al.,
1996; Li et al., 2014; Martins and Peluzio, 2015; Oliveira et al.,
2012a,b, 2013; Rodrigues and Oliveira, 2010; Rodrigues et al.,
2010; Sawada et al., 2014; Sinichi and Diosady, 2014), among
others.
Among the advantages of using ethanol as a hexane substi-
tute can be cited its good operational safety and low toxicity.
In addition, this alternative solvent can be obtained from
renewable sources. This solvent allows the production of high
quality oil with low levels of free fatty acids, besides enabling
the removal of anti-nutritional factors such as gossypol, afla-
toxins and chlorogenic acids (Hron et al., 1982). Beyond the
good quality of the extracted oil, studies report that, generally,
vegetable oil extraction with ethanol enables a larger extrac-
tion of sugars, phospholipids, pigments, waxes, compounds
that gives bitterness to the defatted meal, etc., allowing a bet-
ter quality meal to be obtained in relation to that obtained
with hexane (Johnson and Lusas, 1983).
According to Aguilera (2003), solid–liquid extraction is a
separation process involving contact between a fluid phase
and a solid phase that allows the transfer of solute from the
solid matrix to the solvent. Specifically in the case of oily solid
matrices, during the extraction process the concentration of
oil in the solid matrix varies with time, making it possi-
ble to visualize a series of stages during the contact period
between the solvent and the solid such as: solid involvement
by the solvent; a stage of internal diffusion that comprises
solvent penetration and diffusion through the oily matrix cell
wall until it reaches the lipid bodies; solubilization of lipid
compounds by the solvent; a stage of internal diffusion that
includes transport of the extract solution (oil/solvent) to the
outside of the solid matrix through the cell wall; and the exter-
nal diffusion that comprises transport of the solute from the
surface of the solid matrix to the bulk solution (Kemper, 2005).
In the process stages that involve molecular diffusion,
characterized by molecular random movements caused by a
gradient of concentration, this phenomenon can be described
by Fick’s laws, enabling us to estimate the diffusion coefficient
or diffusivity that is an important transport property useful in
equipment design involving mass transfer (Perez et al., 2011).
Fick’s first law is useful under conditions of a stationary state
and Fick’s second law is applicable to non-stationary systems
and short periods of time, conditions in which changes in
solute concentration with time and position within the solid
matrix are observed (Aguilera, 2003; Chan et al., 2014; Lloyd
and Wyk, 2011).
In fact, an extraction kinetic study is a very important tool
in the delineation of the process, which allows the knowl-
edge of the process’ variable effects such as solid/solvent ratio,
temperature and hydration level of the solvent on the rate of
extraction of the compound of interest.
The main objective of modeling the kinetic curves is to
define parameters for process design. These parameters are
then used to predict the total curve of extraction and, in this
way, to estimate the viability of the process on an industrial
scale. A model must be a mathematical tool that reflects the
physical behavior of the actual structure and experimental
observations. Thereby it can be used as a simulation tool and
then in industrial applications of this process.
Different mathematical models have been suggested to
analyze the extraction kinetics of vegetable oils from different
oily matrices and solvents such as: pressed, flaked or ground
canola seed using hexane as solvent (Fernández et al., 2012;
So and Macdonald, 1986), ground green coffee using hexane
(Dibert et al., 1989), ground corn grains and ethanol as sol-
vent (Chien et al., 1990), jojoba seeds and hexane (Allawzi
et al., 2005), olive cake and hexane or azeotropic ethanol
(Meziane et al., 2006; Meziane and Kadi, 2008), ground Rosa
rubiginosa seeds and ethanol (Franco et al., 2007), hazelnut
seeds and ethanol (Franco et al., 2009), expanded mass of
sunflower seeds (collets) and hexane (Baümler et al., 2010,
2011), ground sunflower seeds and hexane (Perez et al., 2011),
solid coconut waste and hexane (Sulaiman et al., 2013), ground
hemp seeds and hexane (Kostic et al., 2014), castor bean seed
cake and ethanol (Amarante et al., 2014), and flaked soybean
and ethanol or mixtures of ethanol and alkyl esters (Dagostin
et al., 2015).
It can be inferred that in most published studies about the
kinetic extraction of oil using solvents, the main focus was
determination of the diffusivity of the total material extracted
without differentiation of the classes of compounds.
In fact, while the kinetics of extraction of oils has been
widely studied, only a few studies have been published mon-
itoring the kinetics of extraction of the minor compounds:
chlorogenic acids (Dibert et al., 1989), tocopherols, phospho-
lipids and waxes (Baümler et al., 2010, 2011; Fernández et al.,
2012) and gossypol (Saxena et al., 2012). This monitoring is,
however, of great importance for the delineation of the pro-
cess.
Free fatty acids are compounds that impact negatively on
the quality of an extracted oil. Thus, it can be inferred that
knowledge of the extraction rate of this minor compound class
under determined conditions of temperature and type of sol-
vent can enable the production of crude oils with lower acidity
levels. In fact, crude oils with a lower level of free fatty acids
lead to an exemption from further steps of refining which the
oil must undergo in order to be labeled as edible.
Based on the aforementioned information, in this work,
experimental data were determined on the kinetics of extrac-
tion of oil and free fatty acid from an expanded soybean
mass (collets) using ethanol as solvent, under absolute and
azeotropic degrees, at three temperature levels, 40, 50 and
60 ◦C. Mathematical models suggested by Perez et al. (2011)
and So and Macdonald (1986) were used to describe the
experimental data, enabling calculation of the mass transfer
coefficients of the washing and diffusion steps and also the
diffusivity coefficient.
2. Materials and methods
2.1. Materials
The expanded soybean mass (collets) was kindly supplied by
the Brazilian company Granol S/A (Bebedouro, SP, Brazil). The
soybean was cracked industrially, dehulled, cooked, flaked
and expanded to form collets. The soybean collets were then
stockpiled at −20 ◦C to prevent enzymatic degradation until
submitted to the extraction process.
3. food and bioproducts processing 9 8 ( 2 0 1 6 ) 1–10 3
Absolute ethanol (purity higher than 99.8%) purchased
from Merck (Darmstadt, Germany), and aqueous ethanolic
solvent with 5.98 ± 0.07% water by mass, prepared by dilut-
ing absolute ethanol with deionized water (Millipore, Milli-Q,
Bedford, MA, USA), were used as solvents.
2.2. Raw material characterization
Soybean collets were characterized in terms of moisture (AOCS
Ac 2-41, 1998), lipids (AOCS Am 2-93, 1998), crude protein
(AOCS Ba 4f-00, 1998) (Leco, Model FP-528, St. Joseph, MI, USA),
ash (AOAC, 2007) and fiber content (Van Soest et al., 1991).
The fatty acid composition of the oil obtained from the
expanded soybean by a cold extraction method, as suggested
by Bligh and Dyer (1959), was determined by gas chromatog-
raphy of fatty acid methyl esters (AOCS 1-62, 1998). The
conditions used in the chromatography analysis were the
same previously reported by Sawada et al. (2014). The soy-
bean oil extracted by the cold method was also characterized
in terms of free fatty acids by titration (IUPAC, 1979).
Soybean collets were ground due to the fact that this raw
material presents high variability in shape and size. Milled
samples presented spherical shape and were sieved to select
particles with diameters between 1.19 mm and 1.68 mm using
a vibratory system (Bertel, 1868, Caieiras, Brazil) with sieves
(Tyler series, Wheeling, USA).
The total porosity (ε) of the particles was calculated through
Eq. (1), where a is the apparent density and t is the true den-
sity of the particles. The apparent density was experimentally
determined by measuring the mass, in grams, of the milled
expanded soybean that occupies a determined volume, in mL,
while the true density of the particles was determined at the
Analytical Center of the Institute of Chemistry–University of
Campinas (UNICAMP, Brazil), by the picnometry method with
helium gas.
ε (%) = 1 −
a
t
× 100 (1)
2.3. Determination of the experimental data on
kinetics of extraction
Experimental data on the kinetics of extraction were deter-
mined at temperatures of 40, 50 and 60 ◦C using cylindrical
isothermal cells of 50 mL or 200 mL, built of pyrex glass, sim-
ilar of those used by Rodrigues and Oliveira (2010). The cells
are equipped with baskets for soybean collet packing. These
baskets are built with stainless steel perforated sheets, resis-
tant to the organic solvent and temperature and permeable
to the solvent and to the extract. The cells were sealed to pre-
vent mass losses by evaporation and the system’s temperature
was controlled at the preset value (40.0 to 60.0) ± 0.1 ◦C by a
thermostatic bath (Tecnal, model TE-184, Piracicaba, Brazil).
The solid–liquid systems were obtained by adding known
masses of soybean collets and solvent at the solid:solvent
mass ratio of 1:3. The pre-established quantities of soybean
and solvent were weighed in an analytical balance with a read-
ability of 0.0001 g (Adam, model PW254, Milton Keynes, UK).
A magnetic stirrer (Ika, model Lab disc, Staufen, Germany)
was used to agitate the mixture (200 rpm) during the pre-
determined time for the experiment, 5, 10, 15, 20, 25, 30,
35, 40, 45, 50, 55, 60, 90, 120 and 180 min. After this treat-
ment, the composition of the extracted phase was measured
according to the following methods while the raffinate phase
was weighed on a semi-analytical balance.
The free fatty acid (FFA) content was determined by titra-
tion (method 2201, IUPAC, 1979), with an automatic burette
(Metrohm, model Dosimat 775, Herisan, Switzerland). The
total solvent content in the extract phase was determined
by evaporation at 60 ◦C in a vacuum oven (absolute pres-
sure = 126 mmHg) (Tecnal, model TE 395, Piracicaba, Brazil)
until constant mass was observed. It is important to mention
that the experimental conditions of temperature and pres-
sure were chosen to prevent degradation/volatilization of the
fatty compounds contained in the samples. The water con-
tent in the solvents and extract phases was determined by
Karl Fischer titration (AOCS method Ca 23-55, 1998) using a
KF Titrino model 787 (Metrohm, Herisan, Switzerland). Pro-
tein content in the extract phase was evaluated by combustion
method (AOCS method Ba-4f, 1998) using a Leco, model FP-
528 (Leco, St. Joseph, MI, USA). The soybean oil contained in
the extracts was determined by difference. In this work, all
measurements were performed at least in triplicate.
2.4. Verification of the validity of the experimental
data
The accuracy and repeatability of the results were tested
through the method previously proposed by Rodrigues and
Oliveira (2010), Rodrigues et al. (2010), Oliveira et al. (2012a) and
Sawada et al. (2014). This procedure allows calculation of the
mass of the extract phase (MEP) from knowledge of the mass
of the raffinate phase MRP and the mass fractions of the com-
pounds of the system in the extract phase wEP
i
through the
least squares regression method. The deviation (ı) between
the sum of the mass of the extracted and raffinate phases
(MRP + MEP) and the mass of the initial mixture MOC can be
calculated according to the following equation:
ı =
MRP + MEP − MOC
MOC
× 100 (2)
2.5. Kinetic modeling procedure
Two mathematical models were used to describe the experi-
mental data on the kinetics of extraction of the soybean oil
and free fatty acids, the model proposed by So and Macdonald
(1986) and the model suggested by Perez et al. (2011). The
parameters of both models were calculated with the help of
the SAS® program’s (Version 9.2, SAS Institute Inc., Cary, NC,
USA), Marquardt nonlinear adjust method with a level of sig-
nificance of 95%.
2.5.1. Model of So and Macdonald (1986)
The model proposed by So and Macdonald (1986) is a modi-
fication of the model proposed by Patricelli et al. (1979) and
considers that the oil extraction process of oleaginous mate-
rials occurs through two mechanisms, washing and diffusion:
(a) In the washing step it is considered that the oil on the sur-
face of the solid matrix is removed by simple washing with
the solvent at the beginning of the oil extraction process; and
(b) the extraction of the oil that remains in the cells is done
by diffusion process. In this way, the oil concentration (Ct) in
4. 4 food and bioproducts processing 9 8 ( 2 0 1 6 ) 1–10
the solvent at any time (t) can be described by the following
equation:
Ct = Cw
e [1 − exp (−Kwt)] + Cd
e [1 − exp (−Kdt)] (3)
where Ce
w and Ce
d represent the concentrations of oil or free
fatty acids in the solvent (g of oil or g of free fatty acids/100 g
of solution) at the equilibrium condition, at the washing and
diffusion steps, respectively; and kw and kd represent the mass
transfer coefficients (min−1) at the washing and diffusion
steps.
It is important to note that the final concentration of oil or
free fatty acids in the extract at infinite time will be (Eq. (4)):
Ce = Cw
e + Cd
e (4)
where Ce is the concentration of oil or free fatty acids in the
extract at the equilibrium condition, a value that is experi-
mentally obtained.
2.5.2. Model of Perez et al. (2011)
Perez et al. (2011) suggested the use of a modified mathe-
matical model of Fick’s diffusion law in a nonstationary state,
applied to particles with spherical geometry, suspended in a
homogeneous medium of constant concentration without vol-
ume restriction. Under these conditions, the result of Fick’s
equation is given by the following equation:
Mt
M∞
= 1 −
∞
n−1
An exp (−Bnt) (5)
where t is the diffusion time, in seconds; Mt and M∞ represent
the mass of the substance of interest (g of oil or g of free fatty
acids/g of dried defatted meal) that diffused at time t (s) and
infinite time, respectively.
The model proposed by Perez et al. (2011) considers an ini-
tial washing step; (M0), in other words, a fast and non-diffusive
step where the solvent removes the oil on the particle surface,
the conditions for this step being represented as:
t = 0 M = 0 (6)
t = t0 M = M0 (7)
t = t M = Mt (8)
t → ∞ M = M∞ (9)
Eq. (5) can then be rewritten assuming these conditions:
Mt
M∞
= 1 − 1 −
M0
M∞
∞
n=1
An exp [−Bn (t − t0)] (10)
At sufficiently long times Eq. (10) can be simplified to:
Mt
M∞
= 1 − A exp [−B1t] (11)
where the pre-exponential term, A, is given by the following
equation:
A = 1 −
M0
M∞
A1 exp (B1t0) (12)
For particles of oleaginous material of spherical geometry
the parameters A1 and B1 can be calculated according to the
following equations:
A1 =
6
2
(13)
B1 =
De
2
R2
(14)
2.5.3. Evaluation of the models’ performance
The models performance was evaluated through calculating
the average relative deviation (ARD) according to the following
equation:
ARD =
1
n
n
i=1
expi − calci
expi
× 100 (15)
where n is the total number of experimental data, calci is the
value calculated by the model and expi is the experimentally
determined value for condition i.
3. Results and discussion
The composition of the soybean collets used in the experi-
ments on the kinetics of extraction can be visualized in Table 1.
It is possible to observe that the soybean collets exhibited a
composition typical of soybean grains, according to Hammond
et al. (2005).
Regarding the fatty acid composition, also presented in
Table 1, it is possible to note that the soybean oil extracted by
the cold method suggested by Bligh and Dyer (1959) presented
a composition of fatty acids in accordance with the data pre-
sented by Firestone (2006), with linoleic and oleic acids as the
major fatty acids.
Also in this table, it is possible to visualize information
about the physical characteristics of the soybean collets used
in the experiments such as the mean diameter of the particles
and their apparent and true densities as well as porosity.
To obtain the experimental data on the kinetics of
extraction, 168 experiments were performed, of which each
experimental condition was repeated at least twice. The rela-
tive deviation values (ı), calculated according to Eq. (2), varied
from 1.10% to 1.57%, indicating good precision and repeatabil-
ity of the experimental results.
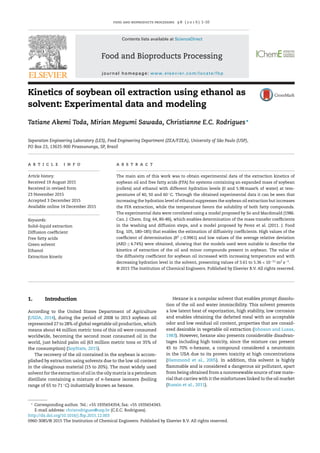
The data on the kinetics of extraction of soybean oil and
free fatty acids using absolute and hydrous ethanol as solvents
can be observed in Figs. 1 and 2. Through the experimental
data shown in Fig. 1 it is possible to verify that the oil contained
in the soybean migrates quickly to the extracted phase at the
beginning of the extraction process and then the extraction
rate decreases, it being the case that the equilibrium condition
is reached in around 3600 s with the absolute ethanol and in
around 2400 s with the hydrous ethanol.
The effect of temperature on the extraction process can
be observed in the extracted soybean oil content over each
period of time, during which higher temperatures favor higher
quantities of oil being extracted. This is in agreement with the
results of oil extraction experiments in systems composed of
soybean collets and ethanol reported by Sawada et al. (2014)
and is justified by the fact that higher temperatures increase
the solubility of the oil in the solvent, besides decreasing the
viscosity, of both the oil and solvent in the extract solution,
5. food and bioproducts processing 9 8 ( 2 0 1 6 ) 1–10 5
Table 1 – Physical–chemical characterization of the soybean collets and soybean oil.
Soybean collets Soybean oil
Average ± standard
deviation
Fatty acids composition
Symbol Fatty acid Average ± standard
deviation (% mass)
Massf
(%)
Moisture (% mass) 6.8 ± 0.6 P Palmitic C16:0 11.79 ± 0.09 9.70–13.30
Oila
(% mass) 25.6 ± 0.2 S Stearic C18:0 3.3 ± 0.1 3.00–5.40
Crude proteina, b
(%
mass)
41.6 ± 0.9 O Oleic C18:1 24.9 ± 0.2 17.70–28.50
Asha
(% mass) 5.17 ± 0.03 Li Linoleic C18:2 53 ± 1 49.80–57.10
Non-fiber
carbohydratesa, c
(%
mass)
8 ± 2 Le Linolenic C18:3 7.9 ± 0.2 5.50–9.50
Fibera
(% mass) 20.06 ± 0.09 Be Behenic C22:0 0.30 ± 0.02 0.30–0.70
Average particle
diameter (mm)
1.7 ± 0.4
True densityd
(g cm−3
)
1.33 ± 0.01
Apparent density
(g cm−3
)
0.420 ± 0.003
Porosity (%)e
68.5 ± 0.7
a
In dry basis.
b
N × 6.25.
c
Calculated by difference.
d
Determined by picnometry with helium gas.
e
Calculated according to Eq. (1).
f
Firestone (2006).
Fig. 1 – Kinetics of extraction of soybean oil. Experimental
data with absolute ethanol: , 40.0 ± 0.1 ◦C; , 50.0 ± 0.1 ◦C;
, 60.0 ± 0.1 ◦C. Experimental data with ethanol with
5.98 mass% of water: , 40.0 ± 0.1 ◦C; ᭹, 50.0 ± 0.1 ◦C; ,
60.0 ± 0.1 ◦C. Calculated: ·······, model of So and Macdonald
(1986); – – –, model of Perez et al. (2011).
favoring solute diffusion (Johnson and Lusas, 1983; Perez et al.,
2011).
Regarding the different solvents studied, notice that the
presence of water strongly suppressed oil extraction. The
hydrous ethanol had about 50% of the extraction capacity
of the absolute ethanol at the equilibrium conditions. In
terms of extraction yield, expressed as g oil per 100 g soy-
bean, the results for absolute ethanol were 14.7 ± 0.9, 18 ± 1
and 20.0 ± 0.6, at 40, 50 and 60 ◦C, while for aqueous ethanol
were obtained 6.40 ± 0.08, 8.6 ± 0.1 and 12.39 ± 0.06 g oil per
100 g soybean, respectively. This behavior was also verified in
studies performed by Rodrigues and Oliveira (2010) and
Fig. 2 – Kinetics of extraction of free fatty acids.
Experimental data with absolute ethanol: , 40.0 ± 0.1 ◦C;
, 50.0 ± 0.1 ◦C; , 60.0 ± 0.1 ◦C. Experimental data with
ethanol with 5.98 mass% of water: , 40.0 ± 0.1 ◦C; ᭹,
50.0 ± 0.1 ◦C; , 60.0 ± 0.1 ◦C. Calculated: ·······, model of So
and MacDonald (1986); – – –, model of Perez et al. (2011).
Oliveira et al. (2012a) that evaluated the extraction of rice bran
oil using ethanol with different levels of water as solvents, and
by Rodrigues et al. (2010) and Sawada et al. (2014) in studies of
the soybean oil extraction process from flaked and expanded
soybean masses with ethanol, respectively.
Similar results for the kinetics of extraction of soluble
compounds have been reported in studies using hexane
as solvent for jojoba oil extraction (Allawzi et al., 2005),
sunflower oil (Baümler et al., 2010; Perez et al., 2011) and
canola oil (Fernández et al., 2012), and systems using ethanol
as solvent for soluble substance extraction of R. rubiginosa
(Franco et al., 2007), for olive cake oil extraction (Meziane and
6. 6 food and bioproducts processing 9 8 ( 2 0 1 6 ) 1–10
Table 2 – Mass transfer coefficients and concentrations at equilibrium condition calculated by So and MacDonald’s model
(1986) for the extraction kinetic of soybean oil.
Solvent T (◦
C) Mass transfer coefficients (min−1
) Concentration at equilibrium condition (mass%) R2a
ARDb
kw kd Ce
w
Ce
d
Ce
Absolute ethanol 40.0 ± 0.1 0.30 ± 0.06 0.02 ± 0.01 3.8 ± 0.3 1.6 ± 0.3 5.3 ± 0.4 0.9992 2.02
50.0 ± 0.1 0.35 ± 0.08 0.03 ± 0.01 3.8 ± 0.3 2.7 ± 0.3 6.5 ± 0.5 0.9995 1.71
60.0 ± 0.1 0.29 ± 0.05 0.03 ± 0.01 4.6 ± 0.4 2.6 ± 0.3 6.9 ± 0.3 0.9996 1.53
Ethanol with
5.98 mass% of
water
40.0 ± 0.1 0.28 ± 0.02 0.02 ± 0.01 1.94 ± 0.06 0.20 ± 0.05 2.14 ± 0.09 0.9999 1.06
50.0 ± 0.1 0.6 ± 0.2 0.04 ± 0.01 2.39 ± 0.12 0.7 ± 0.1 3.10 ± 0.04 0.9998 0.88
60.0 ± 0.1 0.6 ± 0.2 0.04 ± 0.01 2.89 ± 0.19 1.5 ± 0.2 4.35 ± 0.01 0.9997 1.24
a
Coefficient of determination.
b
Average relative deviation calculated according to Eq. (15).
Table 3 – Mass transfer coefficients and concentrations at equilibrium condition calculated by So and MacDonald’s model
(1986) for extraction kinetic of free fatty acids.
Solvent T (◦
C) Mass transfer coefficients (min−1
) Concentration at equilibrium condition (mass%) R2a
ARDb
kw kd Ce
w
Ce
d
Ce
Absolute
ethanol
40.0 ± 0.1 0.3 ± 0.2 0.04 ± 0.01 0.06 ± 0.01 0.05 ± 0.01 0.10 ± 0.00 0.9969 4.01
50.0 ± 0.1 0.7 ± 0.6 0.03 ± 0.01 0.07 ± 0.01 0.10 ± 0.01 0.17 ± 0.01 0.9990 2.21
60.0 ± 0.1 0.4 ± 0.1 0.03 ± 0.00 0.11 ± 0.01 0.13 ± 0.01 0.25 ± 0.01 0.9997 1.43
Ethanol with
5.98 mass% of
water
40.0 ± 0.1 0.14 ± 0.05 0.01 ± 0.01 0.08 ± 0.02 0.1 ± 0.1 0.15 ± 0.01 0.9970 4.66
50.0 ± 0.1 0.19 ± 0.04 0.02 ± 0.01 0.10 ± 0.01 0.12 ± 0.01 0.20 ± 0.01 0.9994 1.95
60.0 ± 0.1 0.11 ± 0.03 0.01 ± 0.02 0.18 ± 0.04 0.08 ± 0.06 0.23 ± 0.01 0.9974 3.95
a
Coefficient of determination.
b
Average relative deviation calculated according to Eq. (15).
Table 4 – Parameters of the model of Perez et al. (2011) adjusted to the experimental data of extraction kinetic of soybean
oil and diffusivity coefficients.
Solvent T (◦
C) Coefficient A Coefficient B1 × 104
R2b
ARDc
Ded
(m2
s−1
) × 1011
Estimated value CVa
Estimated value CVa
Absolute
ethanol
40.0 ± 0.1 1.0187 6.45 6.7 14.20 0.9995 2.56 4.42
50.0 ± 0.1 1.0968 4.10 6.8 8.85 0.9992 2.48 4.99
60.0 ± 0.1 1.0619 4.79 7.3 10.16 0.9990 2.45 5.36
Ethanol with
5.98 mass% of
water
40.0 ± 0.1 1.3091 7.88 4.9 6.96 0.9961 4.74 3.61
50.0 ± 0.1 1.2064 4.57 5.6 13.93 0.9994 1.71 4.12
60.0 ± 0.1 0.9534 4.06 5.8 10.69 0.9994 1.47 4.27
a
Coefficient of variation.
b
Coefficient of determination.
c
Average relative deviation calculated according to Eq. (15).
d
Diffusivity coefficient.
Kadi, 2008), and for oil from flaked soybean (Dagostin et al.,
2015). In general, authors observed the fastest transfer of solu-
ble components to the solvent at the beginning of the process,
followed by a decrease in this transfer rate until it became con-
stant, corresponding to the maximum yield of extraction. The
strong influence of the temperature on the extraction rate was
also observed, in which higher process temperatures led to a
faster initial extraction.
The kinetics of extraction of free fatty acids (FFA) can be
seen in Fig. 2. The kinetics of extraction of the free fatty acids
is the same as observed for the oil, with a faster transfer of
solutes to the extract phase at the beginning of the process,
reaching equilibrium in around 3600 s.
In Fig. 2, it can be noticed that increasing the temper-
ature also favors the extraction of minor compounds, FFA.
These results are in agreement with previous studies on the
extraction of free fatty acids in systems containing rice bran
pellets and alcoholic solvents (Rodrigues and Oliveira, 2010).
Regarding the level of water in the alcoholic solvent, two dif-
ferent behaviors were observed: at lower temperatures (40
and 50 ◦C) there was greater extraction of FFA in the pres-
ence of water in the solvent; however, at a higher temperature
(60 ◦C), the absolute ethanol solvent presented a slightly supe-
rior extraction of this kind of compound.
As commented on before, the experimental data pre-
sented in Figs. 1 and 2 were used to adjust the parameters
of the mathematical model proposed by So and Macdonald
(1986). This model involves two main mechanisms in the
process of oil extraction, which, according to proponents’
authors, occur simultaneously: the washing and diffusion
processes.
High values of the coefficient of determination,
(0.9992 ≤ R2 ≤ 0.9999) for the kinetics of oil extraction and
(0.9969 ≤ R2 ≤ 0.9994) for the kinetics of FFA extraction, and
7. food and bioproducts processing 9 8 ( 2 0 1 6 ) 1–10 7
Table 5 – Parameters of the model of Perez et al. (2011) adjusted to the experimental data of extraction kinetic of free fatty
acids and diffusivity coefficients.
Solvent T (◦
C) Coefficient A Coefficient B1 × 104
R2b
ARDc
Ded
(m2
s−1
) × 1011
Estimated value CVa
Estimated value CVa
Absolute
ethanol
40.0 ± 0.1 1.1001 5.81 7.0 12.23 0.9964 4.73 5.18
50.0 ± 0.1 1.0092 3.14 4.9 6.61 0.9990 2.31 3.67
60.0 ± 0.1 0.9638 2.30 5.7 4.95 0.9996 1.85 4.17
Ethanol with
5.98 mass% of
water
40.0 ± 0.1 0.9836 2.16 4.7 4.65 0.9992 2.43 3.48
50.0 ± 0.1 1.0236 3.04 5.5 6.49 0.9987 3.36 4.09
60.0 ± 0.1 0.9067 2.28 6.1 4.79 0.9995 1.82 4.46
a
Coefficient of variation.
b
Coefficient of determination.
c
Average relative deviation calculated according to Eq. (15).
d
Diffusivity coefficient.
low values of relative deviations, (0.88 ≤ ARD ≤ 2.02) for the
kinetics of oil extraction and (1.43 ≤ ARD ≤ 4.66) for the kinet-
ics of FFA extraction were obtained, showing good agreement
of the experimental data with the model proposed by So and
Macdonald (1986).
Tables 2 and 3 present the mass transfer coefficients and
concentrations at the equilibrium conditions calculated for
the extraction kinetics of soybean oil and free fatty acids,
respectively, using the model proposed by So and Macdonald
(1986).
For the kinetics of oil extraction the predominance of the
washing process in relation to the diffusion process can be ver-
ified, since the washing coefficients are, on average, 13 times
higher than the diffusion coefficients. Regarding the temper-
ature effect, differences were not observed among the mass
transfer coefficients at the three studied levels of temperature
for absolute ethanol. In relation to hydrous ethanol, higher
coefficients could be observed at higher temperatures (50 and
60 ◦C). In fact, as verified by Sawada et al. (2014) in experiments
of soybean oil extraction in batch, the higher the temperature
of the process the greater the amount of soybean oil extracted;
thus, the higher the concentration at the equilibrium condi-
tion.
Similar results were found by Meziane and Kadi (2008)
in studying the kinetics of extraction of olive cake oil using
azeotropic ethanol as solvent. In this work, the effect of
temperature on the kinetics of oil extraction was evaluated
from 20 to 50 ◦C and the authors concluded that increas-
ing the temperature resulted in an increased yield of oil. In
addition, the parameters of the So and MacDonald model
were also adjusted to the experimental data, in which the
calculated mass transfer coefficients for the washing pro-
cess were also higher than the coefficients for the diffusion
process.
Regarding the data presented in Table 3, similar to that
previously presented for the extraction kinetics of soybean
oil, in the extraction of free fatty acids, higher values of
mass transfer coefficients can be observed in the washing
step in the extraction of free fatty acids, on average 13 times
higher related to the diffusion process, indicating the pre-
dominance of this phenomenon in the extraction process of
these minor compounds. In fact, with regard to the extrac-
tion of these minor components with absolute ethanol, the
analysis is impaired due to the high deviation values resulting
from the experimental difficulty associated with executing the
experiments with this solvent, resulting in very high covari-
ance values related to the washing and diffusion coefficients
(57 and 29%, on average, respectively).
The calculated concentrations at the equilibrium condition
are in accordance with those expected, with higher con-
centrations obtained at higher levels of temperature. These
results are in accordance with previous studies performed by
Rodrigues and Oliveira (2010) and Rodrigues et al. (2011) in
which the authors observed that transfer of free fatty acids
from the solid matrix to the extract phase is promoted by
increasing the temperature when solvents with a low moisture
content are used.
Free fatty acids are compounds that negatively impact on
the quality of the extracted oil. Thus, knowledge of the extrac-
tion rate can enable the production of oils with lower acidity
levels, increasing their oxidative stability and eliminating fur-
ther refining steps.
The performance of the model proposed by Perez et al.
(2011) in describing the experimental data on the kinetics
of extraction of soybean oil and free fatty acids can also be
observed in Figs. 1 and 2, respectively. Parameters A and B1
(Eq. (11)) adjusted for the experimental extraction data, are
available in Tables 4 and 5 for soybean oil and free fatty acids,
respectively.
In adjusting the parameters to the experimental data it was
considered that the washing step occurs in the first 600 s of
contact between the oleaginous material and the solvent. In
this step, it was found that the yields of oil extraction reached
values that varied from 69 to 85% of the total yield, while
for free fatty acids extraction, in these first 600 s, yields var-
ied from 46 to 66% of the total extraction yield. Amarante
et al. (2014) studied the kinetics of extraction of castor oil
using ethanol as solvent. The authors considered that the
first 30 min of the process corresponds to the washing step,
with the yield of oil extracted representing 64% of the total
yield.
According to the data presented in Tables 4 and 5, it can be
inferred that parameter A is not influenced by temperature or
by increasing the water content in the alcoholic solvent, these
observations being in accordance with previous studies pub-
lished by Amarante et al. (2014) and Fernández et al. (2012).
In relation to the values of parameter B1, which includes the
diffusivity coefficient De, it can be observed that these val-
ues increased with increasing temperature in the experiments
on the kinetics of oil extraction and on the kinetics of FFA
8. 8 food and bioproducts processing 9 8 ( 2 0 1 6 ) 1–10
Table 6 – Diffusivity coefficients for different vegetable oils reported by several authors..
Author Material De (m2
·s−1
) Solvent Temperature (◦
C)
Fan et al. (1948) Peanut slices
(0.2 to 0.4 mm)
3.2 × 10⁻⁹
to 16.5 × 10⁻⁹
Hexane 24–26
Chorny and Krasuk
(1966)
Soybean pellets
Rice bran pellets
(diameter: 0.32 to 0.95 cm)
and (length: 3.8 to 14 cm)
1.56 × 10⁻⁶
to 2.65 × 10⁻⁶
Trichloroethylene 55
Dibert et al. (1989) Green coffee grains 6.2 × 10⁻¹²
6.8 × 10⁻¹²
7.4 × 10⁻¹²
Hexane 30
40
50
Chien et al. (1990) Grounded corn grains
(0.5 to 1 mm)
5.8 × 10⁻⁶
Ethanol 99% 68
Franco et al. (2007) Rosa rubiginosa
(0.6 to 2 mm)
1.2 × 10⁻¹¹
to 2.2 × 10⁻¹⁰
5.2 × 10⁻¹¹
to 3.0 × 10⁻¹⁰
Ethanol 96%
Ethanol 92%
50
50
Franco et al. (2009) Gevuina avellana
(0.6 a 2 mm)
2.2 × 10⁻¹¹
to 5.8 × 10⁻¹¹
3.3 × 10⁻¹¹
to 5.9 × 10⁻¹¹
7.5 × 10⁻¹¹
to 16 × 10−11
Ethanol 99%
Ethanol 96%
Ethanol 92%
50
50
50
Baümler et al. (2010) Sunflower collets
(diameter of 18.8 mm and
length of 27.7 mm)
1.356 × 10⁻⁸
1.683 × 10⁻⁸
2.247 × 10⁻⁸
Hexane 40
50
60
Perez et al. (2011) Sunflower seeds
(624 ± 42 m)
2.06 × 10⁻¹²
to 5.03 × 10⁻¹²
Hexane 40
50
60
Fernández et al.
(2012)
Canola seeds 1.6 × 10⁻¹²
2.0 × 10⁻¹²
2.2 × 10⁻¹²
2.3 × 10⁻¹²
Hexane 25
40
50
60
Amarante et al.
(2014)
Castor bean cake 4.52 × 10⁻¹³
4.66 × 10⁻¹³
5.16 × 10⁻¹³
5.60 × 10⁻¹³
Ethanol 20
30
40
55
extraction when hydrous ethanol was used as solvent. This
behavior was not observed when absolute ethanol was used
as the solvent in free fatty acids extraction.
In general, the values of soybean oil diffusivity coefficients
increased with increasing temperature in both solvents and
decreased with increases in the water level in the solvent for
the same extraction temperature. Table 6 presents a data com-
pilation of the diffusivity coefficients available in the literature
for different oilseeds, different extraction solvents and differ-
ent ranges of temperature. In general, it can be inferred that
our results are in accordance, in terms of magnitude, with the
data reported by Franco et al. (2007, 2009).
4. Conclusions
In this work experiments on the kinetics of extraction of
oil and free fatty acids for systems composed of soybean
collets and solvents such as absolute and aqueous ethanol
were accomplished at 40, 50 and 60 ◦C. It was possible to
observe, for the oil and free fatty acids extraction processes,
a rapid transfer of the solutes to the extract phase at the
beginning of the process, characteristic of the washing step,
followed by a decreasing extraction rate, a step in the pro-
cess controlled by the diffusion of the solutes within the
oilseed, until it reaches the equilibrium condition. Higher
values of temperature favored the oil and free fatty acids
extraction, regardless of the type of solvent, while increasing
the water level in the solvent disadvantaged the soybean oil
extraction.
The mathematical models used showed good performance
in describing the experimental data, resulting in average rel-
ative deviations up to 4.66% in the So and MacDonald’s model
(1986) and up to 4.74% to the model proposed by Perez et al.
(2011).
The diffusivity coefficient values for the soybean oil
increased with increasing temperature and with decreasing
the water content in the solvent, presenting values of 3.61 to
5.36 × 10⁻¹¹ m2 s−1.
The experimental determination of the extraction kinetics
and the use of suitable models to estimate the mass transfer
and diffusivity coefficients are useful in designing solid–liquid
extractors and optimizing the process of soybean oil extrac-
tion using ethanol as solvent.
Acknowledgements
The authors would like to thank Granol for the donation of soy-
bean collets. They also wish to acknowledge FAPESP (Fundac¸ão
de Amparo à Pesquisa do Estado de São Paulo – 14/09446-4,
13/25142-2, 11/09543-1, 10/03058-1, 09/17855-3, 08/56258-8),
CNPq (Conselho Nacional de Desenvolvimento Científico e
Tecnológico – 308024/2013-3), FINEP (Financiadora de Estudos
e Projetos) and CAPES (Coordenac¸ão de Aperfeic¸oamento de
Pessoal de Nível Superior) for the financial support.
References
Aguilera, J.M., 2003. 2 Solid–liquid extraction. In: Liadakis, G.,
Tzia, C. (Eds.), Extraction Optimization in Food Engineering.
CRC Press, New York, USA.
Allawzi, M.A., Abu-Arabi, M.K., Al-Taher, F.A., 2005. Parametric
study on the batch leaching process of Jojoba oil. Eur. J. Lipid
Sci. Technol. 107, 469–475.
Amarante, R.C.A., Oliveira, P.M., Schwantes, F.K.,
Morón-Villarreyes, J.A., 2014. Oil extraction from castor cake
9. food and bioproducts processing 9 8 ( 2 0 1 6 ) 1–10 9
using ethanol: kinetics and thermodynamics. Ind. Eng. Chem.
Res. 53, 6824–6829.
AOAC, 2007. Official Methods of Analysis of AOAC International,
18th ed. Association of Official Analytical Chemists,
Washington, USA.
AOCS, 1998. Official Methods and Recommended Practices of the
AOCS, fifth ed. American Oil Chemists’ Society, Champaign,
USA.
Ayas, N., Yilmaz, O., 2014. A shrinking core model and empirical
kinetic approaches in supercritical CO2 extraction of safflower
seed oil. J. Supercrit. Fluids 94, 81–90.
Baümler, E.R., Crapiste, G.H., Carelli, A.A., 2010. Solvent
extraction: kinetic study of major and minor compounds. J.
Am. Oil Chem. Soc. 87, 1489–1495.
Baümler, E.R., Carelli, A.A., Crapiste, G.H., Carrín, M.A., 2011.
Solvent extraction modeling of vegetable oil and its minor
compounds. J. Food Eng. 107, 186–194.
Bligh, E.G., Dyer, W.J., 1959. A rapid method of total lipid
extraction and purification. Can. J. Biochem. Physiol. 37,
911–917.
Campbell, K.A., Glatz, C.E., Johnson, L.A., Jung, S., de Moura,
J.M.N., Kapchie, V., Murphy, P., 2011. Advances in aqueous
extraction processing of soybeans. J. Am. Oil Chem. Soc. 88,
449–465.
Chan, C., Yusoff, R., Ngoh, G., 2014. Modeling and kinetics study
of conventional and assisted batch solvent extraction. Chem.
Eng. Res. Des. 92, 1169–1186.
Chien, J.T., Hoff, J.E., Lee, M.J., Lin, H.M., Chen, Y.J., Chen, L.F.,
1990. Oil extraction of dried ground corn with ethanol. Chem.
Eng. J. 43, B103–B113.
Chorny, R.C., Krasuk, J.H., 1966. Extraction for different
geometries—constant diffusivity. Ind. Eng. Chem. Process
Des. Dev. 5, 206–208.
Dagostin, J.L.A., Carpiné, D., Corazza, M.L., 2015. Extraction of
soybean oil using ethanol and mixtures with alkyl esters
(biodiesel) as co-solvent: kinetics and thermodynamics. Ind.
Crops Prod. 74, 69–75.
Dibert, K., Cros, E., Andrieu, J., 1989. Solvent extraction of oil and
chlorogenic acid from green coffee. Part II: Kinetic data. J. Food
Process Eng. 10, 199–214.
Fan, H.P., Morris, J.C., Wakeham, H., 1948. Diffusion phenomena
in solvent extraction of peanut oil—effect of cellular
structure. Ind. Eng. Chem. 40, 195–199.
Fernández, M.B., Perez, E.E., Crapiste, G.H., Nolasco, S.M., 2012.
Kinetic study of canola oil and tocopherol extraction:
parameter comparison of nonlinear models. J. Food Eng. 111,
682–689.
Firestone, D., 2006. Physical and Chemical Characteristics of Oils,
Fats, and Waxes. AOCS Press, Champaign, USA.
Franco, D., Sineiro, J., Pinelo, M., Nú ˜nez, M.J., 2007. Ethanolic
extraction of Rosa rubiginosa soluble substances: oil solubility
equilibria and kinetic studies. J. Food Eng. 79, 150–157.
Franco, D., Sineiro, J., Nú ˜nez, M.J., 2009. Analysis of variables and
modeling of Gevuina avellana oil extraction with ethanol near
azeotrope conditions. J. Food Eng. 32, 664–681.
Hammond, E.G., Johnson, L.A., Su, C., Wang, T., White, P.J., 2005.
Soybean oil. In: Shahidi, F. (Ed.), Bailey’s Industrial Oil and Fat
Products, vol. 2. John Wiley and Sons, New Jersey, USA, pp.
577–653.
Hron, R.J., Koltun, S.P., Graci Jr., A.V., 1982. Biorenewable solvents
for vegetable oil extraction. J. Am. Chem. Soc. 59, 674–684.
Hu, W., Wells, J.H., Shin, T., Godber, J.S., 1996. Comparison of
isopropanol and hexane for extraction of vitamin E and
oryzanols from stabilized rice bran. J. Am. Oil Chem. Soc. 73,
1653–1656.
IUPAC, 1979. In: Paquot, C. (Ed.), Standard Methods for the
Analysis of Oils, Fats and Derivatives, sixth ed. Pergamon
Press, part 1 (sections I and II), New York, USA.
Johnson, L.A., Lusas, E.W., 1983. Comparison of alternative
solvents for oils extraction. J. Am. Oil Chem. Soc. 60, 229–242.
Kemper, T.G., 2005. Soybean Oil. In: Shahidi, F. (Ed.), Bailey’s
Industrial Oil and Fat Products. John Wiley and Sons, New
Jersey, USA.
Kostic, M.D., Jokovic, N.M., Stamenkovic, O.S., Rajkovic, K.M.,
Milic, P.S., Veljkovic, V.B., 2014. The kinetics and
thermodynamics of hempseed oil extraction by n-hexane. Ind.
Crops Prod. 52, 679–686.
Kuk, M.S., Hron, R.J., 1998. Cottonseed extraction with new
solvent system: isohexane and alcohol mixtures. J. Am. Oil
Chem. Soc. 82, 927–930.
Li, Y., Fine, F., Fabiano-tixier, A., Abert-vian, M., Carre, P., Pages, X.,
Chemat, F., 2014. Evaluation of alternative solvents for
improvement of oil extraction from rapesseds. C.R. Chim. 17,
242–251.
Lloyd, P.J., Wyk, J., 2011. Introduction to extraction in food
processing. In: Lebovka, F., Vorobiev, N., Chemat, E. (Eds.),
Enhancing Extraction Processes in the Food Industry. CRC
Press, Boca Raton, USA.
Martins, G.A.S., Peluzio, J.M., 2015. Optimisation of the
liquid–liquid extraction of soybean oil using a binary mixture.
Rev. Cienc. Agron. 46, 64–71.
Meziane, S., Kadi, H., 2008. Kinetics and thermodynamics of oil
extraction from olive cake. J. Am. Oil Chem. Soc. 85,
391–396.
Meziane, S., Kadi, H., Lamrous, O., 2006. Kinetic study of oil
extraction from olive foot cake. Grasas Aceites 57, 175–179.
Oliveira, R.C., Barros, S.T.D., Gimenes, M.L., 2013. The extraction
of passion fruit oil with green solvents. J. Food Eng. 117,
458–463.
Oliveira, R., Oliveira, V., Aracava, K.K., Rodrigues, C.E.C., 2012a.
Effects of the Extraction conditions on the yield and
composition of rice bran oil extracted with ethanol—a
response surface approach. Food Bioprod. Process. 90,
22–31.
Oliveira, C.M., Garavazo, B.R., Rodrigues, C.E.C., 2012b.
Liquid–liquid equilibria for systems composed of rice bran oil
and alcohol-rich solvents: application to extraction and
deacidification of oil. J. Food Eng. 110, 418–427.
Patricelli, A., Assogna, A., Casalaina, A., Emmi, E., Sodini, G., 1979.
Fattori che influenzano l’estrazione dei lipidi da semi
decorticati di girasole. La Riv. Ital. Sostanze Gr 56, 136–142.
Perez, E.E., Carelli, A.A., Crapiste, G.H., 2011.
Temperature-dependent diffusion coefficient of oil from
different sunflower seeds during extraction with hexane. J.
Food Eng. 105, 180–185.
Rebolleda, S., Rubio, N., Beltrán, S., Sanz, M.T., González-Sanjosé,
M.L., 2012. Supercritical fluid extraction of corn germ oil:
study of the influence of process parameters on the extraction
yield and oil quality. J. Supercrit. Fluids 72, 270–277.
Rebolleda, S., Beltrán, S., Sanz, M.T., González-Sanjosé, M.L., 2014.
Supercritical fluid extraction of wheat bran oil: study of
extraction yield and oil quality. Eur. J. Lipid Sci. Technol. 116,
319–327.
Rodrigues, C.E.C., Oliveira, R., 2010. Response surface
methodology applied to the analysis of rice bran oil extraction
process with ethanol. Int. J. Food Sci. Technol. 45, 813–820.
Rodrigues, C.E.C., Aracava, K.K., Abreu, F.N., 2010.
Thermodynamic and statistical analysis of soybean oil
extraction process using renewable solvent. Int. J. Food Sci.
Technol. 45, 2407–2414.
Rodrigues, C.E.C., Longo, N.M., Silva, C.C., Aracava, K.K., Garavazo,
B.R., 2011. Ethanolic extraction of soybean oil: oil solubility
equilibria and kinetic studies. Chem. Eng. Trans. 24, 811–816.
Rosenthal, A., Pyle, D.L., Niranjan, K., 1996. Aqueous and
enzymatic processes for edible oil extraction. Enzyme Microb.
Technol. 19, 402–420.
Russin, T.A., Boye, J.I., Arcand, Y., Rajamohamed, S.H., 2011.
Alternative techniques for defatting soy: a practical review.
Food Bioprocess Technol. 4, 200–223.
Sawada, M.M., Venâncio, L.L., Toda, T.A., Rodrigues, C.E.C., 2014.
Effects of different alcoholic extraction conditions on soybean
oil yield, fatty acid composition and protein solubility of
defatted meal. Food Res. Int. 62, 662–670.
Saxena, D.K., Sharma, S.K., Sambi, S.S., 2012. Kinetics and
thermodynamics of gossypol extraction from defatted
cottonseed meal by etanol. Pol. J. Chem. Technol. 14, 29–34.
10. 10 food and bioproducts processing 9 8 ( 2 0 1 6 ) 1–10
Sinichi, S., Diosady, L.L., 2014. Isopropyl alcohol extraction of
de-hulled yellow mustard flour. J. Am. Oil Chem. Soc. 91,
2143–2153.
So, G.C., Macdonald, D.G., 1986. Kinetics of oil extraction from
canola (rapeseed). Can. J. Chem. Eng. 64, 80–86.
SoyStats, 2015. SoyStats, Available in http://www.soystats.com
(accessed in: April, 2015).
Sulaiman, S., Aziz, A.R.A., Aroua, M.K., 2013. Optimization and
modeling of extraction of solid coconut waste oil. J. Food Eng.
114, 228–234.
USDA, 2014. United States Department of Agriculture: Economics,
Statistics, and Market Information System. USDA, Available in:
http://usda.mannlib.cornell.edu/MannUsda/viewDocument
Info.do?documentID=1290 (accessed in: December, 2015).
Van Soest, P.J., Robertson, J.B., Lewis, B.A., 1991. Methods for
dietary fiber, neutral detergent fiber, and nonstarch
polysaccharides in relation to animal nutrition. J. Dairy Sci. 74,
3583–3597.