SlideShare a Scribd company logo
1 of 27
1. Project Risk Management (25 Points)
You have been tasked to manage a facilities construction project
for a non-profit organization. Specifically, the organization is
undertaking a large project to build a 6000 square foot office
and an attached building with 20 hotel style rooms for its
beneficiaries (building a shelter). The budget is tight and the
organization needs to have these facilities as soon as possible.
The project is in the planning stage and you have some
requirements documents and funding available. How would you
use risk management on this project? Why would you use risk
management? What are your most important considerations?
What are the steps of your risk management process (use any
model you like ie PMP, textbook, DoD etc)? Provide a Risk
Breakdown Structure for the project. What risk identification
tools would you use on the project? Why?
Assume you are talking to a key stakeholder (donor) about your
plan.
1. PROJECT RISK MANAGEENT (40 Points)
Meaning of Risk Management
Risk management is very important part of planning for project,
the process of risk management is developed to reduce the risk
of certain events happening which are having negative impact
on overall project. Risk management is the identification,
assessment and prioritization of risk followed by coordinated
and economical application of resources to monitor, minimize,
and control the probability and impact of negative outcomes.
0. How would you use risk management on this project?
Our proposed project of constructing 6000 square foot office
and twenty hotel style rooms is in planning stage; this is a plus
point for the management as they can develop detailed risk
management activities.
Risk management depends on the understanding of the overall
project in other words in order to develop detailed risk
management activities the understanding of the project is very
important. To use risk management for the project, we will
create a detailed risk management plan which is also used to
understand the whole project. The contents of risk management
plan are as follows:
1. Project Description
· Project objective: to construct 6000 square yard office and 20
rooms building.
· External Dependencies: acquiring construction material,
services of architects etc.
· Stakeholder analysis: reaction of local residents, local
government regulations, negotiation with donors, requirement of
client etc.
1. Risk Management scope and objectives
· Variance threshold: two main constraints in this project is
time and funds. Calculated variance should be calculated for
these two variables that is how long each activity could be
stretched while keeping project feasible. By doing this we can
identify the threshold of timing and budget after which project
become in viable.
· Prioritization of project objectives: in order to complete the
project in time, a schedule of activities required showing
activities of project needs priority and others which could be
delayed.
1. Risk Management methodology
· Relationship with organizational environment
· Risk management activities
1. Risk Management organization
· Defining clear roles, responsibility and level of authority for
risk management: written responsibilities of each member of the
project and also well communicated to the members of the
project, such as roles of escalation.
· Make a budget for risk management activities and add these
costs to the overall cost of the project.
1. Reporting
· Who will report to whom, the format of reports, frequency of
meeting among members and how the effective governance
applied to the project?
1. Use of tools
· Which tool is going to be used and to what extent, the
limitation and strengths of selected tools.
0. Why would you use risk management?
The payback of risk management in construction projects is
massive; we can gain lot if we tackle the uncertain events in
project in a proactive manner. By doing risk management we
can minimize the impact of threats on the project while keeping
the potential benefits of opportunities which could arise from
uncertain events having positive impact on the project, for
example, we can deliver project on required time that is
construction of office and twenty rooms on time, completion of
construction in available budget and finally the quality of the
project would be according to the standards.
The project for which we are going to use risk management
techniques is the construction of 6000 square foot office and a
building for 20 hotel style rooms for residents. The project is
undertaken on non profit basis and our prime objective would be
to complete the required task in allocated budget and of
required quality. By managing risk we can increase the
probability of project success. Another reason of using risk
management is that it ensures that the appetite for risk is
properly understood at the very beginning of the project, in
other words it ensures that all risk agreed upon are properly
assessed, prioritized, communicated and understood in line with
the risk appetite of the construction project. Risk management
also builds a solid platform to track the agreed tasks and actions
and to take corrective measures if needed in future.
By applying risk management activities properly, the cost of
applying risk management activities are much less than the cost
which arise if project failed, the return on that investment is
normally at least five to one, and might be much higher. Along
with opportunity to save funds, the typical benefits of project
risk management are:
· Provoke rational, risk informed thinking and risk awareness
among project team.
· Address project risk factors proactively.
· Ensures that risk management and crises management plans
are in place.
· And most importantly customer satisfaction.
Final decision to adopt project risk management, and the level
of these activities should be made on the merits of each project,
risk management activities adds cost to overall cost of the
project so we should appreciate that the project risk
management activities will be well compensated.
0. What are your most important considerations?
The most important consideration will be the identification of
the nature of a risk because it is a precondition for a better
response. Therefore adequate time to be spend make a closer
look at an individual risks we should try not to reach the
conclusions without knowing what a risk is actually about. We
should appreciate risk analysis occurs at different levels of
project. Another important stage of risk analysis is to
investigate the whole project. The project manager requires
answering the usual questions about the total budget required
and the date the project will finish. If you take risks into
account, you can do a simulation to show your project sponsor
how likely it is that you finish on a given date or within a
certain time frame. A similar exercise can be done for project
costs. The information we collected in a risk analysis will
provide valuable picture in your project and the necessary input
to find effective responses to neutralize the risks. A better
approach is to consistently include risk communication in the
tasks the teams carry out. If there will be a team meeting we
should make project risks be part of the default agenda of that
meeting. This depicts risks are very important to the project
manager and it gives a natural moment for team members to
discuss and report any new ones as identified. Second important
consideration would be the line of communication between
project manager and project sponsor or client.
The final most important consideration would be the taking the
advantage of potential opportunities that could arise in future,
these are also the uncertain events which have positive impact
on the project, such as decline in prices of raw material etc.
Can be summarized the most important considerations:
1. Determination of Objective
1. Cost Benefit Analysis
1. Compliance with standard
1. Stakeholders
1. COSO ERM Framework
1. Cost
1. Time Schedule
1. Performance
0. What are the steps of your risk management process?
Some very comprehensive guidelines for managing risk and risk
management process are available from many sources,
according to the risk management institute the risk management
process include following steps:
1. Risk Management planning
1. Risk Identification
1. Qualitative risk analysis
1. Quantitative risk analysis
1. Risk Response planning
1. Risk Monitoring and control
3. Risk Management Planning
Risk management planning decides how to approach and plan
the risk management activities for the construction project. The
final outcome of risk management planning would be the
detailed risk management plan. Risk management planning
helps to overcome the barriers to in the project, it involves all
stakeholders and most importantly risk management planning
took note of organization’s policies and tactical and strategic
objectives. The outcome of risk management planning is risk
management plan the contents of risk management plan would
be:
1. Methodology to manage risk 2. Roles and responsibilities of
team members
3. Budgeting of resources 3. Timing of tasks
4. Risk breakdown structure 5. Calculation of risk
probabilities and its impact on overall project.
6. Creation of probability matrix 6. Stakeholders analysis and
their tolerance level
7. Reporting format 8. How to track the progress
of the project.
The above ten points are maximum steps which as organization
took in order to manage the risk; the level of detail depends on
the need of the project. In the given construction project the
main barriers are limited resources and lack of sufficient time.
There is a pressure for completion of task in given time. So the
management has decided to make detailed plan for resources
and time management. Roles and responsibilities of team
members, risk break down structure and reporting format should
also be included in the risk management plan.
3. Risk Identification
The next step in our risk management process will be risk
identification, risk identification process determines which risk
is likely to affect a project and finally documenting the
characteristics of each identified risk for future reference.
There are tools and techniques available to identify the risk
which could hurt or enhance this project. The available tools are
as follow:
1. Historical Review
1. Current assessment
1. Creativity
1. Diagramming techniques
1. Assumption analysis
Each of the above technique has its strengths and weakness
some of them require more time and other requires experience,
which technique should be used depends on the individual
circumstances of each project. Is it possible for anyone to be
you able to identify all project risks before they occur the
answer is probably no. However if project manager combine a
number of different risk identification methods, they are more
likely to find the large majority of potential risks, and in
response of if project manger deal with them properly and
accurately, they should have enough time left to tackle the
unexpected risks that might arise in future as project progress.
3. Qualitative Risk Analysis
The main qualitative analysis we could use here are preliminary
risk analysis and hazard and operability analysis.
Different qualitative risk analysis includes:
1. Risk probability and impact matrix
1. Probability and impact matrix
1. Risk data quality assessment
1. Risk categorization
1. Risk urgency statement
1. Expert judgment.
Preliminary risk analysis is a qualitative risk analysis technique
which involves a structured analysis of the events and
sequences which could make or convert a potential hazard into
an accident. In this technique, first the potential unfavorable
events are identified and then analyzed separately. For each
undesirable events or hazards, possible improvements, or
preventive measures are then designed.
The result from preliminary risk analysis support a basis for
evaluating which categories of potential hazard should be
analyzed more closely and which analysis methods are most
favorable. Such an analysis also proved valuable in the working
environment to which activities lacking safety measures can be
readily identified.
Most projects could use qualitative risk analysis technique to
confirm which risks are most important and need to be
managed. Qualitative technique is a quick estimate and does not
show the detailed and numerical analysis. When we use
qualitative risk analysis we should evaluate each single risk and
classified each risk as high, medium, or low, depending on the
seriousness of its impact and the probability of the event
occurring. Here are the steps involved in this technique:
The following points show the way how the qualitative risk
analysis applied in that construction project:
· High negative impact to project High chance of occurrence --
high risk
· High negative impact to project / Medium chance of
occurrence -- high risk
· High negative impact to project / No chance of occurrence --
medium/low risk
· Medium negative impact to project / Highly chance of
occurrence -- medium risk
· Medium negative impact to project / Medium chance of
occurrence -- medium/low risk
· Medium negative impact to project / Not chance of occurrence
-- low risk
· Low negative impact to project / Highly chance of occurrence
-- low risk
· Low negative impact to project / Medium chance of
occurrence -- low risk
· Low negative impact to project / No chance of occurrence -
low risk
3. Quantitative risk analysis methods
Quantitative risk analysis method includes numerically
estimating the effect of risk on project, the methods used to do
quantitative analysis includes:
1. Data gathering
1. Quantitative risk analysis and modeling
1. Monte Carlo simulation model
1. Decision tree analysis on test
1. Expected monetary value analysis(EMV)
3. Risk Response Planning
Risk response planning includes taking steps to enhance
opportunities and trying to reduce the impact of threats in
meeting the project objectives. Tools and techniques available
to use in risk response planning are:
1. Strategies for negative risk or threats
1. Strategies for positive risk and opportunities
1. Strategy for both opportunity and threat
1. Contingent response strategy
Overall we will design and develop mitigation and contingency
plan for potential threats which will impact the project in
negative way.
3. Risk Monitoring and Control
This process evaluates the effectiveness of risk strategies
throughout the total life of the project, monitor and identify the
residual risk, carrying out the risk response plans, tools and
techniques available for monitoring and control are:
1. Risk Assessment
1. Risk Audits
1. Variance and trend analysis
1. Technical performance measurement
1. Reverse analysis
1. And status meetings.
0. Provide a Risk Breakdown Structure for the project.
Risk Breakdown Structures will vary between different projects.
One positive outcome of developing generic risk breakdown
structure is to remind those people who are engaged in the Risk
Identification process. The results of risk breakdown structure
become input for Qualitative Risk Analysis methods and
probabilities and impacts are assigned according to the
RBS. The impacts can be numerical or High, Medium, Low.
Identified risks are then listed according to their potential
impact for affecting the Project’s success. Other important point
is to take into account the tolerance levels of stake holder’s
risk, reporting formats and how finally how these risks would
be tracked.
RBS LEVEL 0
RBS LEVEL 1
RBS LEVEL 2
RBS LEVEL 3
PROJECT RISK MANAGEMENT
PROJECT
Scope
Not properly defined
Technology
Technology might me out date
Cost
Not Accurate, Use of mid-range values
Schedule
Reduced Float
TECHNICAL
Mechanical
Drawing are not updated
Safety
Delay of approval from related authority
Safeguard and security
Delay of approval of vulnerability analysis
Environmental
Delay in signing
INTERNAL
Human Resources
Required resources not available
Organizational Structure
Required experience level not available
Organization
organization structure might not effective
Governance
risk arises due to the governance issues
Communication
lack of communication in management
Management
Management re organization occurring
EXTERNAL
Political
Delay in appropriation
Funding
Funding from donor withheld
Site Facilities
inadequate site facilities
Legislation
new laws emerge regarding donation
Regulatory
fail to fulfill the regulatory requirement
Legal
Legal action by any stakeholder
0. What risk identification tools would you use on the project?
Why?
Risk identification is of utmost importance, it is a proactive
approach to handle risk. It is argued that it is almost impossible
to indentify all risks which could affect the project negatively
so by identifying the maximum possible risk and designing the
response strategy, there would be enough time left for
unexpected risk hence chances of project success increased
substantially. The critical success factor for risk identification
of are:
1. Indentify early: try to identify risk as early as possible. The
risk unfolded before identification could have devastating effect
on the overall project, limiting the success of the project.
1. Comprehensive: the identified risk should be comprehensive
so that proper response could be designed.
1. Multiple perspectives: the effect of identified risk should be
analyzed from different prospective.
1. Include opportunities: the identification process should not
only include the search of negative uncertain events rather
positive risk should also be identified.
1. Objectivity: identification process should be progressed with
clear objective in mind otherwise distraction could impact the
identification process negatively.
There are many risk identification techniques which can be used
in this construction project but we should keep this mind that
the project is in its planning stage and there is time pressure to
complete the project on asked time. The available resources also
impact the selection of risk identification method, the available
risk identification tools could be placed under the heading of
historical review, Current assessment, Creativity, Diagramming
techniques and Assumption analysis. The strengths and
weakness of available risk identification tools are as follows:
1. Brainstorming
Plus point: Allows all participants to speak their mind and
contribute to the discussion Can involve all key stakeholders
Negative point: Requires attendance of key stakeholders at a
meeting, therefore can be difficult to arrange and might be
expensive, May produce biased results if dominated by a strong
person. It normally generates non risks and duplicates risks
which than requires filtering.
1. Interviews
Plus point: This technique addresses risks in detail and also
generates engagement of stakeholders.
Negative point: It is time consuming technique, also raises non
risks, concerns, issues, worries, so required filtering process.
The prerequisite of this technique is good interviewing and
questioning skills.
1. SWOT Analysis
Plus point: This technique makes equal focus on both threats
and opportunities, Offers a structured Approach to identify
threats and opportunities also focus on internal (organizational
strengths and weaknesses) and external (opportunities and
threats)
Negative point: Focuses on internally generated risks arising
from organizational strengths and weaknesses, ignores external
risks Tends to produce high level generic risks, not project
specific.
1. Industry knowledge base
Plus point: This technique shows previous experience; by
allowing benchmarking against external projects.
Negative point: This technique also excludes project specific
risks, by focusing on the industry.
1. Cause and Effect
Plus point: In this technique visual diagram of project is
presented which promotes structured thinking of risk linked
with the project.
Negative point: Diagram used for presentation could become
complex as project progress, it becomes difficult for participant
to understand the diagram.
1. Delphi Technique
Plus point: This technique takes input from technical experts
and eliminates the risk of bias in risk identification.
Negative point: Delphi technique is limited to technical risks
and relies on actual expertise of selected experts; also this
technique takes longer time than available due to iterations of
the experts’ inputs.
1. Influence diagrams
Plus point: This technique reveals main risk drivers and can
create counterintuitive sights which are not possible through
using other techniques.
Negative point: The main drawback of this technique is that it
needs disciplined thinking and usually it is not always easy to
determine appropriate structure.
We have two barriers here one is limited resources and other
one is shortage of time, we will select the method which give us
maximum benefits while using less resources. It is also
recommended to use more than one method in order to get
maximum positive results.
We will use SWOT technique because it focus on both threats
and opportunities, the outcome of SWOT analysis is very
comprehensive and data collected under this technique could be
used on other parts of the project. The other technique we have
selected is cost and effect technique. The reason is the
information collected under SWOT analysis could be used as an
input of cause and effect technique and a comprehensive
diagram can be developed.
Bookkeeping of identified risk enables project team to view
progress and make sure that management has not missed any
risk which needs to be treatment. Risk register is also a perfect
communication technique that informs team members and also
stakeholders that how the project is progressing.
A perfect risk register include risks descriptions, clarifies
ownership issues and enables the project team to take some
basic analyses with regard to causes and effects. It could be
argued that maintaining risk register increase the administrative
job and eventually the overall more time would be consumed,
due to this reason some team member might resist in
maintaining the register. But the benefits of maintaining risk
register easily outclass the negative points. Such as project
member track each risk and analyze how each identified risk is
treated.
2. Operational Risk Management and Disasters (10 points)
Briefly discuss some of the key causes of disasters and/or
Operational Risk Management failures. Relate the causes to
their occurrence in a specific disaster (your choice).
Operational Risk Management is a process which includes risk
identification and assessment, Risk decision making, designing
and implementing the controls to mitigate risk which results in
acceptance, mitigation, or avoidance of risk. Operational Risk
Management is the oversight of operational risk, including the
risk of loss resulting from inadequate or failed internal
processes and systems; human factors; or external events.
Operational risks arise by a wide list of different external
events starting from power cut to natural disasters such as
floods or earthquakes or might be terrorist attacks. Similarly,
operational risk can arise due to internal events such as the
potential for failures or inadequacies in any of the Bank’s
processes and systems or those of its outsourced service
providers. Operational risk which raised from human resources
management may refer to a range of issues such as mismanaged
or poorly trained employees; the potential of employees for
negligence, willful misconduct; conflict of interests; fraud; and
so on. Therefore the emergence of mistrust, failure to
communicate, low morale and cynicism among staff members,
as well as increased turnover of staff, should be regarded as
indicative for potential increase in operational risk.
Outsourcing task require careful consideration if they are to get
benefits, and where they are not managed properly the degree of
operational risk faced by the Bank might increase, as is also the
case of extra use and dependency upon the use of consultants
for activities that may be more effectively developed internally.
In particular, an issue for concern is the loss of control over
processes. This could create a serious threat to the continuity of
its operations if these providers were to fail.
0. Benefits of Operational Risk Management
The benefits of operational risk management are as follows:
1. Operational loss will be reduced
1. Compliance and auditing cost minimized
1. Early identification of unlawful activities
1. Exposure to future risk reduced
0. Causes of operational risk management failure
Some of the reasons of failure of operational risk management
are as follows:
1. Key risk indicators are often insufficiently linked to
underlying business objectives and risk assessment to provide
effective risk monitoring;
1. Risk-assessment processes often fail to provide either an
effective means of understanding the operational risk profile, or
a practical tool for driving control improvement action and
consequent reductions in allocated capital;
1. Loss-data collection often provides a one-way feed into an
‘invisible’ group model, rather than being used by the business
to identify areas of control weakness;
1. Operational risk quantification is often viewed as irrelevant
to the day-to-day management of risk itself stemming from an
unclear responsibility allocation as to operational risks.
0. Oil spill disaster in Gulf of Mexico (British Petroleum)
Oil spill incident occur on 20 April 2010 in region of Gulf of
Mexico, 11 workers died on spot. The spill caused by explosion
on oil rig about millions of gallons of oil dumped in to the Gulf
of Mexico. British Petroleum has set up a $20 billion fund to
compensate victims of the oil spill.
According to the report of bureau of ocean energy management
the operational risk management failures were the main cause of
that disaster. British petroleum fails to perform the formal risk
assessment of critical operational decisions. The report also
shows that the British petroleum has initiated cost cutting and
time saving decisions, although these decisions seems healthy
form corporate earnings point of view but dangerous thing was
that these decisions were taken without any consideration of
contingencies and mitigation. And these contagious decisions
contributed to that deadly disaster.
Effect of cost cutting and time saving on operational risk
management
As per definition the operational risk management is a
continuous process of risk identification and mitigation in day
to day operation. To save time and money the British petroleum
and its contractors has by passed some important risk
management steps, according to the report following wrong
steps were taken by British petroleum:
1. Ignored the diagnostic test to check the strength of cement
before pouring the cement in the oil well.
1. Ignoring the pressure test of methane which then causes the
explosion on the rig.
1. Inadequate training of engineers and oil rig personnel.
The British petroleum has saved lot of money by taking these
steps but at the end the uncertain event unfolds and forced the
company to face huge losses. If proper risk mitigation strategy
was in place the company might had saved billion of dollars.
3. Briefly describe the main sources of project Scope & Cost
risks. (15 points)
Scope risks are most numerous in the Project Experience Risk
Information Library (PERIL) database, representing more than
one-third of the data. Even more important, risks related to
scope accounted for nearly half of the total schedule impact.
The two broad categories of scope risk in PERIL relate to
changes and defects . By far the most damage was due to poorly
managed change (two-thirds of the overall scope impact and
almost a third of all the impact in the entire database), but all
the scope risks represented significant exposure for these
projects. While some of the risk situations, particularly in the
category of defects, were legitimately “unknown” risks, quite a
few of the problems could have been identified in advance and
managed as risks. The two major root-cause categories for scope
risk are separated into more detailed sub-categories.
Scope changes due to gaps were the most frequent, but scope
creep changes were the most damaging on average. A Pareto
chart of overall impact by type of risk is summarized in Figure
3-1 , and a more detailed analysis follows.
Change Risks
Change happens. Few if any projects end with the original scope
intact. Managing scope risk related to change relies on
minimizing the loose ends of requirements at project initiation
and having (and using) a robust process for controlling changes
throughout a project. In the PERIL database, there are three
categories of scope change risks: scope creep, scope gaps , and
dependencies . Figure 3-1. Total project impact by scope root-
cause subcategories. in an average schedule slip of nearly nine
weeks. Scope gaps were only slightly less damaging, at well
over eight weeks of slippage, and were also both more common
and had greater total impact. Each of these subcategories
individually represented about one-sixth of all the problems in
the PERIL database. Scope gaps are the result of committing to
a project before the project requirements are complete. When
legitimate needs are uncovered later in the project, change is
unavoidable. Some of the overlooked requirements were a
consequence of the novelty of the project, and some were
because of customers, managers, team members, or other project
stakeholders who were not available at the project start.
Although some of the scope gaps are probably unavoidable, in
most of the cases these gaps were due to incomplete or rushed
analysis. A more thorough scope definition and project work
breakdown would have revealed the missing or poorly defined
portions of the project scope. Scope creep plagues all projects,
especially technical projects. New opportunities, interesting
ideas, undiscovered alternatives, and a wealth of other
information emerges as the project progresses, providing a
perpetual temptation to redefine the project and to make it
“better.” Some project change of this sort may be justified
through clear-eyed business analysis, but too many of these
nonmandatory changes sneak into projects because the
consequences either are never analyzed or are drastically
underestimated. To make matters worse, the purported benefits
of the change are usually unrealistically overestimated. In
retrospect, much of scope creep delivers little or no benefit. In
some particularly severe cases, the changes in scope delay the
project so much that the ultimate deliverable has no value; the
need is no longer pressing or has been met by other means.
Scope creep represents unanticipated additional investment of
time and money, because of both newly required effort and the
need to redo work already completed. Scope creep is most
damaging when entirely new requirements are piled on as the
project runs. Such additions not only make projects more costly
and more difficult to manage, they also can significantly delay
delivery of the originally expected benefits. Managing scope
creep requires an initial requirements definition process that
thoroughly considers potential alternatives, as well as an
effective process for managing specification changes throughout
a project. Scope creep can come from any direction, but one of
the most were not apparent earlier. This can lead to well-
intentioned proposals by someone on the project team to
“improve” the deliverable. Sometimes, scope creep of this sort
happens with no warning or visibility until too late, within a
portion of the project where the shift seems harmless. Only after
the change is made do the real, and sometimes catastrophic,
unintended consequences emerge. Particularly on larger, more
complicated projects, all changes deserve a thorough analysis
and public discussion, with a particularly skeptical analysis of
all alleged benefits. Both scope creep and scope gaps are
universal and pervasive issues for technical projects. Scope
dependencies are due to external factors that affect the project
and are the third category of change risk. (Dependency risks
that are primarily due to timing rather than requirements issues
are characterized as schedule risks in the database.) Though less
frequent in the PERIL database, compared with other scope
change risks, scope dependencies did represent an average
slippage of over a month. Admittedly, some of the cases in the
database involved situations that no amount of realistic analysis
would have uncovered in advance. Other examples, though,
were a result of factors that should not have come as complete
surprises. Although legal and regulatory changes do sometimes
happen without notice, a little research will generally provide
advance warning. Projects also depend on infrastructure
stability, and periodic review of installation and maintenance
schedules will reveal plans for new versions of application
software, databases, telecommunications, hardware
upgrades, or other changes that the project may need to
anticipate and accommodate. Defect Risks Technical projects
rely on many complicated things to work as expected.
Unfortunately, new things do not always operate as promised or
as required. Even normally reliable things may break down or
fail to perform as desired in a novel application. Defects
represent about a third of the scope risks and about one-seventh
of all the risks in the PERIL database. The three categories of
defect risks are software, hardware , and integration. Software
problems and hardware failures were the most common types of
defect risk in the PERIL database, approximately equal in
frequency. They were also roughly equal in impact, with
software defects slightly exceeding seven weeks of delay on
average and hardware problems a bit less than seven weeks. In
several cases, the root cause was new, untried technology that
lacked needed functionality or reliability. In other cases, a
component created by the project (such as a custom integrated
circuit, a board, or a software module) did not work initially
and had to be fixed. In still other cases, critical purchased
components delivered to the project failed and had to be
replaced. Nearly all of these risks are visible, at least as
possibilities, through adequate analysis and planning. Some
hardware and software functional failures related to quality or
performance standards. Hardware may be too slow, require too
much in unusual circumstances. As with other defects, the
definition, planning, and analysis of project work will help in
anticipating many of these potential quality risks. Integration
defects were the third type of defect risk in the PERIL database.
These defects related to system problems above the component
level. Although they were not as common in the database, they
were quite damaging. Integration defects caused an average of
nearly seven weeks of project slip. For large programs, work is
typically decomposed into smaller, related subprojects that can
progress in parallel. Successful integration of the deliverables
from each of the subprojects into a single system deliverable
requires not only that each of the components delivered operates
as specified but also that the combination of all these parts
functions as a system. All computer users are familiar with this
failure mode. Whenever all the software in use fails to play
nicely together, our systems lock up, crash, or report some
exotic “illegal operation.” Integration risks, though relatively
less common than other defect risks in the PERIL database, are
particularly problematic, as they generally occur near the
project deadline and are never easy to diagnose and correct.
Again, thorough analysis relying on disciplines such as software
architecture and systems engineering is essential to timely
identification and management of possible integration risks.
Based on schedule impact, the worst 20 percent of the risks
from each category in the PERIL database—defined as “black
swans”—deserve more detailed attention. We’ll explore these
“large-impact, hard-to-predict, rare events” in this section. Each
of the black swan risks represented at least three months of
schedule slip, so each certainly qualifies as large impact. Black
swan risks are rare; the PERIL database has an intentional bias
in favor of the most serious risks, which are (or at least we hope
are) not risks we expect to see frequently. The purpose of this
section and the discussions in Chapters 4 and 5 is to make some
of these black swans easier to predict. Of the most damaging
127 risks in the PERIL database, 64—just over half—were
scope risks. In the database as a whole, the black swans
accounted for slightly more than half of the total risk impact.
The top scope risks exceeded this with nearly 60 percent of the
aggregate scope risk impact. The details are presented in the
following table. As the table shows, the black swan scope risks
were dominated by change risk, with about three-quarters of
these risks in terms of both generally more straightforward.
There were forty-seven black swan scope risks associated with
change, dominated by scope gaps (with a total of twenty-five).
Examples of the scope gap risks were: • Project manager
expected the solution to be one item, but it proved to be four. •
New technology required unanticipated changes to function. •
Development plans failed to include all of the 23 required
applications. • End users were too little involved in defining the
new system. • Requirements were understood differently by key
stakeholders. • Scope initially proposed for the project did not
receive the upper management sign-off. • Some countries
involved provided incomplete initial requirements. • Fit/gap
analysis was poor. • The architect determined late that the new
design plan would be considerably more complex than expected.
• Lack of consensus on the specifications resulted in late project
adjustments. • When a survey required for the project was
assigned to several
people in different countries, each assumed someone else would
do it but no one did. • A midproject review turned up numerous
additional regulations. • Manufacturing problems were not seen
in the original analysis. Most of the rest of the change risk
black swans were attributable to scope creep. Among these
twenty-one risks were: • Scoping for the project increased
substantially after the award was won. • New technology was
introduced late in the project. • The project team agreed to new
requirements, some of which proved to be impossible. • Late
changes were poorly managed. • The contract required state-of-
the-art materials, which changed significantly over the project’s
two-year duration. • Volume requirements increased late in the
project, requiring extensive rework. • Mid-project feature
revisions had a major impact on effort and schedule, making the
product late to market. • A merger occurred during a
companywide software refresh of all desktops and laptops,
adding more systems and hugely complicating the project. • A
system for expense analysis expanded into redesign of most
major internal systems. without communicating or getting
approval from others. • Late change required new hardware and
a second phase. • Application changed midproject to appeal to a
prospective Chinese customer (who never bought). • Project
specifications changed, requiring material imported from
overseas. There was a single black swan change risk caused by
an external dependency (in a pharmaceutical project, a
significant study was unexpectedly mandated). There were
fewer black swans in the scope defect categories (seventeen
total). Software and hardware defects each caused eight, and
one was a consequence of poor integration. Examples of scope
defect risks included: • Redesign was required in a printer
development project that failed to meet print quality goals. •
The system being developed had twenty major defects and
eighty additional problems that had to be fixed. • In user
acceptance testing, a fatal flaw sent the deliverable back to
development. • During unit testing, performance issues arose
with volume loads. • Contamination of an entire batch of petri
plates meant redoing them all.
· Server crashed with four months of information, none of it
backed up, requiring everything to be reentered. • Hardware
failed near the end of a three-month final test, necessitating
refabrication and retest. • Purchased component failed, and
continuing the project depended on a brute force and difficult-
to-support workaround. • System tool could not be scaled to a
huge Web application. • A software virus destroyed interfaces
in two required languages, requiring rework. • A purchased
learning management system had unanticipated modular
complexity. Identifying scope risks similar to the examples
given here can expose many potential problems. Reviewing
these examples and the additional scope risks from the PERIL
database listed in the Appendix can be a good starting point for
uncovering possible scope-related problems on your next
project.
Find the percentage change. Round to the nearest tenth of a
percent if necessary and state
whether the change is an increase or a decrease.
From 88 hours to 54 hours
Find the final price of the item below, given that the tax will be
applied to the discounted price.
Original price of a jacket: $150.00
Discount: 5%
Tax: 2%
Use simple interest to find the ending balance, given the
following values for principal, rate,
and time.
$45,700 at 1.2% for 2 years
Find the x- and y-intercepts of the line represented by the
equation below. Plot both intercepts
on a coordinate system and drawn the line through them.
12 x + y = 5
Sarawong and Lisa are selling flower bulbs for a school
fundraiser. Customers can buy packages of tulip bulbs and bags
of daffodil bulbs. Sarawong sold 6 packages of tulip bulbs and 4
bags of daffodil bulbs for a total of $82. Lisa sold 12 packages
of tulip bulbs and 7 bags of daffodil bulbs for a total of $151.
Find the cost each of one package of tulips bulbs and one bag of
daffodil bulbs.

More Related Content

Similar to 1. Project Risk Management (25 Points)You have been tasked to.docx

Risk 0-risk-guide book for pmi-rmp by amer elbaz
Risk 0-risk-guide book for pmi-rmp by amer elbazRisk 0-risk-guide book for pmi-rmp by amer elbaz
Risk 0-risk-guide book for pmi-rmp by amer elbazMohamed Saeed
 
BSBPMG522 Undertake project work1HousekeepingE.docx
BSBPMG522 Undertake project work1HousekeepingE.docxBSBPMG522 Undertake project work1HousekeepingE.docx
BSBPMG522 Undertake project work1HousekeepingE.docxcurwenmichaela
 
BSBPMG522 Undertake project work1Housekeeping.docx
BSBPMG522 Undertake project work1Housekeeping.docxBSBPMG522 Undertake project work1Housekeeping.docx
BSBPMG522 Undertake project work1Housekeeping.docxjasoninnes20
 
Project management
Project managementProject management
Project managementsatya pal
 
Table of Contents Project Outline. …………………………………………………………………….docx
 Table of Contents Project Outline. …………………………………………………………………….docx Table of Contents Project Outline. …………………………………………………………………….docx
Table of Contents Project Outline. …………………………………………………………………….docxMARRY7
 
International Journal of Engineering and Science Invention (IJESI)
International Journal of Engineering and Science Invention (IJESI)International Journal of Engineering and Science Invention (IJESI)
International Journal of Engineering and Science Invention (IJESI)inventionjournals
 
Managing projects
Managing projectsManaging projects
Managing projectsNovoraj Roy
 
11. Project Risk Management.pptx
11. Project Risk Management.pptx11. Project Risk Management.pptx
11. Project Risk Management.pptxKamranKhan353531
 
AI in Project Management.pdf
AI in Project Management.pdfAI in Project Management.pdf
AI in Project Management.pdfJamieDornan2
 
Assignment 1.docx
Assignment 1.docxAssignment 1.docx
Assignment 1.docxUmair Abbas
 
Project Manager Primer
Project Manager PrimerProject Manager Primer
Project Manager PrimerTom Cremins
 
Plan risk management
Plan risk management Plan risk management
Plan risk management Shereef Sabri
 
5 Project Risk Managementadrian825iStockThinkstockLe.docx
5 Project Risk Managementadrian825iStockThinkstockLe.docx5 Project Risk Managementadrian825iStockThinkstockLe.docx
5 Project Risk Managementadrian825iStockThinkstockLe.docxgilbertkpeters11344
 
Project Management by Mostafa Ewees
Project Management  by Mostafa EweesProject Management  by Mostafa Ewees
Project Management by Mostafa EweesMostafa Ewees
 

Similar to 1. Project Risk Management (25 Points)You have been tasked to.docx (20)

Risk 0-risk-guide book for pmi-rmp by amer elbaz
Risk 0-risk-guide book for pmi-rmp by amer elbazRisk 0-risk-guide book for pmi-rmp by amer elbaz
Risk 0-risk-guide book for pmi-rmp by amer elbaz
 
BSBPMG522 Undertake project work1HousekeepingE.docx
BSBPMG522 Undertake project work1HousekeepingE.docxBSBPMG522 Undertake project work1HousekeepingE.docx
BSBPMG522 Undertake project work1HousekeepingE.docx
 
BSBPMG522 Undertake project work1Housekeeping.docx
BSBPMG522 Undertake project work1Housekeeping.docxBSBPMG522 Undertake project work1Housekeeping.docx
BSBPMG522 Undertake project work1Housekeeping.docx
 
Ch_1_PRM.pdf
Ch_1_PRM.pdfCh_1_PRM.pdf
Ch_1_PRM.pdf
 
Project management
Project managementProject management
Project management
 
Table of Contents Project Outline. …………………………………………………………………….docx
 Table of Contents Project Outline. …………………………………………………………………….docx Table of Contents Project Outline. …………………………………………………………………….docx
Table of Contents Project Outline. …………………………………………………………………….docx
 
International Journal of Engineering and Science Invention (IJESI)
International Journal of Engineering and Science Invention (IJESI)International Journal of Engineering and Science Invention (IJESI)
International Journal of Engineering and Science Invention (IJESI)
 
Managing projects
Managing projectsManaging projects
Managing projects
 
11. Project Risk Management.pptx
11. Project Risk Management.pptx11. Project Risk Management.pptx
11. Project Risk Management.pptx
 
Risk based thinking
Risk based thinkingRisk based thinking
Risk based thinking
 
AI in Project Management.pdf
AI in Project Management.pdfAI in Project Management.pdf
AI in Project Management.pdf
 
Assignment 1.docx
Assignment 1.docxAssignment 1.docx
Assignment 1.docx
 
Project Manager Primer
Project Manager PrimerProject Manager Primer
Project Manager Primer
 
Project management
Project managementProject management
Project management
 
Pmi 19 26
Pmi 19 26Pmi 19 26
Pmi 19 26
 
Project Risk Management
Project Risk ManagementProject Risk Management
Project Risk Management
 
Plan risk management
Plan risk management Plan risk management
Plan risk management
 
5 Project Risk Managementadrian825iStockThinkstockLe.docx
5 Project Risk Managementadrian825iStockThinkstockLe.docx5 Project Risk Managementadrian825iStockThinkstockLe.docx
5 Project Risk Managementadrian825iStockThinkstockLe.docx
 
Risk Management
Risk ManagementRisk Management
Risk Management
 
Project Management by Mostafa Ewees
Project Management  by Mostafa EweesProject Management  by Mostafa Ewees
Project Management by Mostafa Ewees
 

More from dorishigh

Cyber War versus Cyber Realities Cyber War v.docx
Cyber War versus Cyber Realities Cyber War v.docxCyber War versus Cyber Realities Cyber War v.docx
Cyber War versus Cyber Realities Cyber War v.docxdorishigh
 
Cyber terrorism, by definition, is the politically motivated use.docx
Cyber terrorism, by definition, is the politically motivated use.docxCyber terrorism, by definition, is the politically motivated use.docx
Cyber terrorism, by definition, is the politically motivated use.docxdorishigh
 
Cyber Security ThreatsYassir NourDr. Fonda IngramETCS-690 .docx
Cyber Security ThreatsYassir NourDr. Fonda IngramETCS-690 .docxCyber Security ThreatsYassir NourDr. Fonda IngramETCS-690 .docx
Cyber Security ThreatsYassir NourDr. Fonda IngramETCS-690 .docxdorishigh
 
Cyber Security in Industry 4.0Cyber Security in Industry 4.0 (.docx
Cyber Security in Industry 4.0Cyber Security in Industry 4.0 (.docxCyber Security in Industry 4.0Cyber Security in Industry 4.0 (.docx
Cyber Security in Industry 4.0Cyber Security in Industry 4.0 (.docxdorishigh
 
Cyber Security and the Internet of ThingsVulnerabilities, T.docx
Cyber Security and the Internet of ThingsVulnerabilities, T.docxCyber Security and the Internet of ThingsVulnerabilities, T.docx
Cyber Security and the Internet of ThingsVulnerabilities, T.docxdorishigh
 
Cyber Security Gone too farCarlos Diego LimaExce.docx
Cyber Security Gone too farCarlos Diego LimaExce.docxCyber Security Gone too farCarlos Diego LimaExce.docx
Cyber Security Gone too farCarlos Diego LimaExce.docxdorishigh
 
CW 1R Checklist and Feedback Sheet Student Copy Go through this.docx
CW 1R Checklist and Feedback Sheet Student Copy Go through this.docxCW 1R Checklist and Feedback Sheet Student Copy Go through this.docx
CW 1R Checklist and Feedback Sheet Student Copy Go through this.docxdorishigh
 
CW 1 Car Industry and AIby Victoria StephensonSubmission.docx
CW 1 Car Industry and AIby Victoria StephensonSubmission.docxCW 1 Car Industry and AIby Victoria StephensonSubmission.docx
CW 1 Car Industry and AIby Victoria StephensonSubmission.docxdorishigh
 
CWTS CWFT Module 7 Chapter 2 Eco-maps 1 ECO-MAPS .docx
CWTS CWFT Module 7 Chapter 2 Eco-maps 1 ECO-MAPS .docxCWTS CWFT Module 7 Chapter 2 Eco-maps 1 ECO-MAPS .docx
CWTS CWFT Module 7 Chapter 2 Eco-maps 1 ECO-MAPS .docxdorishigh
 
Cw2 Marking Rubric Managerial Finance0Fail2(1-29) Fail.docx
Cw2 Marking Rubric Managerial Finance0Fail2(1-29) Fail.docxCw2 Marking Rubric Managerial Finance0Fail2(1-29) Fail.docx
Cw2 Marking Rubric Managerial Finance0Fail2(1-29) Fail.docxdorishigh
 
Cyber AttacksProtecting National Infrastructure, 1st ed.Ch.docx
Cyber AttacksProtecting National Infrastructure, 1st ed.Ch.docxCyber AttacksProtecting National Infrastructure, 1st ed.Ch.docx
Cyber AttacksProtecting National Infrastructure, 1st ed.Ch.docxdorishigh
 
CVPSales price per unit$75.00Variable Cost per unit$67.00Fixed C.docx
CVPSales price per unit$75.00Variable Cost per unit$67.00Fixed C.docxCVPSales price per unit$75.00Variable Cost per unit$67.00Fixed C.docx
CVPSales price per unit$75.00Variable Cost per unit$67.00Fixed C.docxdorishigh
 
CYB207 v2Wk 4 – Assignment TemplateCYB205 v2Page 2 of 2.docx
CYB207 v2Wk 4 – Assignment TemplateCYB205 v2Page 2 of 2.docxCYB207 v2Wk 4 – Assignment TemplateCYB205 v2Page 2 of 2.docx
CYB207 v2Wk 4 – Assignment TemplateCYB205 v2Page 2 of 2.docxdorishigh
 
CUSTOMERSERVICE-TRAINIGPROGRAM 2 TA.docx
CUSTOMERSERVICE-TRAINIGPROGRAM 2  TA.docxCUSTOMERSERVICE-TRAINIGPROGRAM 2  TA.docx
CUSTOMERSERVICE-TRAINIGPROGRAM 2 TA.docxdorishigh
 
Customer Service Test (Chapter 6 - 10)Name Multiple Choice.docx
Customer Service Test (Chapter 6 - 10)Name Multiple Choice.docxCustomer Service Test (Chapter 6 - 10)Name Multiple Choice.docx
Customer Service Test (Chapter 6 - 10)Name Multiple Choice.docxdorishigh
 
Customer Value Funnel Questions1. Identify the relevant .docx
Customer Value Funnel Questions1. Identify the relevant .docxCustomer Value Funnel Questions1. Identify the relevant .docx
Customer Value Funnel Questions1. Identify the relevant .docxdorishigh
 
Customer service is something that we have all heard of and have som.docx
Customer service is something that we have all heard of and have som.docxCustomer service is something that we have all heard of and have som.docx
Customer service is something that we have all heard of and have som.docxdorishigh
 
Customer requests areProposed Cloud Architecture (5 pages n.docx
Customer requests areProposed Cloud Architecture (5 pages n.docxCustomer requests areProposed Cloud Architecture (5 pages n.docx
Customer requests areProposed Cloud Architecture (5 pages n.docxdorishigh
 
Customer Relationship Management Presented ByShan Gu Cris.docx
Customer Relationship Management Presented ByShan Gu Cris.docxCustomer Relationship Management Presented ByShan Gu Cris.docx
Customer Relationship Management Presented ByShan Gu Cris.docxdorishigh
 
Custom Vans Inc. Custom Vans Inc. specializes in converting st.docx
Custom Vans Inc. Custom Vans Inc. specializes in converting st.docxCustom Vans Inc. Custom Vans Inc. specializes in converting st.docx
Custom Vans Inc. Custom Vans Inc. specializes in converting st.docxdorishigh
 

More from dorishigh (20)

Cyber War versus Cyber Realities Cyber War v.docx
Cyber War versus Cyber Realities Cyber War v.docxCyber War versus Cyber Realities Cyber War v.docx
Cyber War versus Cyber Realities Cyber War v.docx
 
Cyber terrorism, by definition, is the politically motivated use.docx
Cyber terrorism, by definition, is the politically motivated use.docxCyber terrorism, by definition, is the politically motivated use.docx
Cyber terrorism, by definition, is the politically motivated use.docx
 
Cyber Security ThreatsYassir NourDr. Fonda IngramETCS-690 .docx
Cyber Security ThreatsYassir NourDr. Fonda IngramETCS-690 .docxCyber Security ThreatsYassir NourDr. Fonda IngramETCS-690 .docx
Cyber Security ThreatsYassir NourDr. Fonda IngramETCS-690 .docx
 
Cyber Security in Industry 4.0Cyber Security in Industry 4.0 (.docx
Cyber Security in Industry 4.0Cyber Security in Industry 4.0 (.docxCyber Security in Industry 4.0Cyber Security in Industry 4.0 (.docx
Cyber Security in Industry 4.0Cyber Security in Industry 4.0 (.docx
 
Cyber Security and the Internet of ThingsVulnerabilities, T.docx
Cyber Security and the Internet of ThingsVulnerabilities, T.docxCyber Security and the Internet of ThingsVulnerabilities, T.docx
Cyber Security and the Internet of ThingsVulnerabilities, T.docx
 
Cyber Security Gone too farCarlos Diego LimaExce.docx
Cyber Security Gone too farCarlos Diego LimaExce.docxCyber Security Gone too farCarlos Diego LimaExce.docx
Cyber Security Gone too farCarlos Diego LimaExce.docx
 
CW 1R Checklist and Feedback Sheet Student Copy Go through this.docx
CW 1R Checklist and Feedback Sheet Student Copy Go through this.docxCW 1R Checklist and Feedback Sheet Student Copy Go through this.docx
CW 1R Checklist and Feedback Sheet Student Copy Go through this.docx
 
CW 1 Car Industry and AIby Victoria StephensonSubmission.docx
CW 1 Car Industry and AIby Victoria StephensonSubmission.docxCW 1 Car Industry and AIby Victoria StephensonSubmission.docx
CW 1 Car Industry and AIby Victoria StephensonSubmission.docx
 
CWTS CWFT Module 7 Chapter 2 Eco-maps 1 ECO-MAPS .docx
CWTS CWFT Module 7 Chapter 2 Eco-maps 1 ECO-MAPS .docxCWTS CWFT Module 7 Chapter 2 Eco-maps 1 ECO-MAPS .docx
CWTS CWFT Module 7 Chapter 2 Eco-maps 1 ECO-MAPS .docx
 
Cw2 Marking Rubric Managerial Finance0Fail2(1-29) Fail.docx
Cw2 Marking Rubric Managerial Finance0Fail2(1-29) Fail.docxCw2 Marking Rubric Managerial Finance0Fail2(1-29) Fail.docx
Cw2 Marking Rubric Managerial Finance0Fail2(1-29) Fail.docx
 
Cyber AttacksProtecting National Infrastructure, 1st ed.Ch.docx
Cyber AttacksProtecting National Infrastructure, 1st ed.Ch.docxCyber AttacksProtecting National Infrastructure, 1st ed.Ch.docx
Cyber AttacksProtecting National Infrastructure, 1st ed.Ch.docx
 
CVPSales price per unit$75.00Variable Cost per unit$67.00Fixed C.docx
CVPSales price per unit$75.00Variable Cost per unit$67.00Fixed C.docxCVPSales price per unit$75.00Variable Cost per unit$67.00Fixed C.docx
CVPSales price per unit$75.00Variable Cost per unit$67.00Fixed C.docx
 
CYB207 v2Wk 4 – Assignment TemplateCYB205 v2Page 2 of 2.docx
CYB207 v2Wk 4 – Assignment TemplateCYB205 v2Page 2 of 2.docxCYB207 v2Wk 4 – Assignment TemplateCYB205 v2Page 2 of 2.docx
CYB207 v2Wk 4 – Assignment TemplateCYB205 v2Page 2 of 2.docx
 
CUSTOMERSERVICE-TRAINIGPROGRAM 2 TA.docx
CUSTOMERSERVICE-TRAINIGPROGRAM 2  TA.docxCUSTOMERSERVICE-TRAINIGPROGRAM 2  TA.docx
CUSTOMERSERVICE-TRAINIGPROGRAM 2 TA.docx
 
Customer Service Test (Chapter 6 - 10)Name Multiple Choice.docx
Customer Service Test (Chapter 6 - 10)Name Multiple Choice.docxCustomer Service Test (Chapter 6 - 10)Name Multiple Choice.docx
Customer Service Test (Chapter 6 - 10)Name Multiple Choice.docx
 
Customer Value Funnel Questions1. Identify the relevant .docx
Customer Value Funnel Questions1. Identify the relevant .docxCustomer Value Funnel Questions1. Identify the relevant .docx
Customer Value Funnel Questions1. Identify the relevant .docx
 
Customer service is something that we have all heard of and have som.docx
Customer service is something that we have all heard of and have som.docxCustomer service is something that we have all heard of and have som.docx
Customer service is something that we have all heard of and have som.docx
 
Customer requests areProposed Cloud Architecture (5 pages n.docx
Customer requests areProposed Cloud Architecture (5 pages n.docxCustomer requests areProposed Cloud Architecture (5 pages n.docx
Customer requests areProposed Cloud Architecture (5 pages n.docx
 
Customer Relationship Management Presented ByShan Gu Cris.docx
Customer Relationship Management Presented ByShan Gu Cris.docxCustomer Relationship Management Presented ByShan Gu Cris.docx
Customer Relationship Management Presented ByShan Gu Cris.docx
 
Custom Vans Inc. Custom Vans Inc. specializes in converting st.docx
Custom Vans Inc. Custom Vans Inc. specializes in converting st.docxCustom Vans Inc. Custom Vans Inc. specializes in converting st.docx
Custom Vans Inc. Custom Vans Inc. specializes in converting st.docx
 

Recently uploaded

Introduction to AI in Higher Education_draft.pptx
Introduction to AI in Higher Education_draft.pptxIntroduction to AI in Higher Education_draft.pptx
Introduction to AI in Higher Education_draft.pptxpboyjonauth
 
Enzyme, Pharmaceutical Aids, Miscellaneous Last Part of Chapter no 5th.pdf
Enzyme, Pharmaceutical Aids, Miscellaneous Last Part of Chapter no 5th.pdfEnzyme, Pharmaceutical Aids, Miscellaneous Last Part of Chapter no 5th.pdf
Enzyme, Pharmaceutical Aids, Miscellaneous Last Part of Chapter no 5th.pdfSumit Tiwari
 
KSHARA STURA .pptx---KSHARA KARMA THERAPY (CAUSTIC THERAPY)————IMP.OF KSHARA ...
KSHARA STURA .pptx---KSHARA KARMA THERAPY (CAUSTIC THERAPY)————IMP.OF KSHARA ...KSHARA STURA .pptx---KSHARA KARMA THERAPY (CAUSTIC THERAPY)————IMP.OF KSHARA ...
KSHARA STURA .pptx---KSHARA KARMA THERAPY (CAUSTIC THERAPY)————IMP.OF KSHARA ...M56BOOKSTORE PRODUCT/SERVICE
 
A Critique of the Proposed National Education Policy Reform
A Critique of the Proposed National Education Policy ReformA Critique of the Proposed National Education Policy Reform
A Critique of the Proposed National Education Policy ReformChameera Dedduwage
 
Solving Puzzles Benefits Everyone (English).pptx
Solving Puzzles Benefits Everyone (English).pptxSolving Puzzles Benefits Everyone (English).pptx
Solving Puzzles Benefits Everyone (English).pptxOH TEIK BIN
 
Contemporary philippine arts from the regions_PPT_Module_12 [Autosaved] (1).pptx
Contemporary philippine arts from the regions_PPT_Module_12 [Autosaved] (1).pptxContemporary philippine arts from the regions_PPT_Module_12 [Autosaved] (1).pptx
Contemporary philippine arts from the regions_PPT_Module_12 [Autosaved] (1).pptxRoyAbrique
 
Separation of Lanthanides/ Lanthanides and Actinides
Separation of Lanthanides/ Lanthanides and ActinidesSeparation of Lanthanides/ Lanthanides and Actinides
Separation of Lanthanides/ Lanthanides and ActinidesFatimaKhan178732
 
Crayon Activity Handout For the Crayon A
Crayon Activity Handout For the Crayon ACrayon Activity Handout For the Crayon A
Crayon Activity Handout For the Crayon AUnboundStockton
 
CARE OF CHILD IN INCUBATOR..........pptx
CARE OF CHILD IN INCUBATOR..........pptxCARE OF CHILD IN INCUBATOR..........pptx
CARE OF CHILD IN INCUBATOR..........pptxGaneshChakor2
 
18-04-UA_REPORT_MEDIALITERAСY_INDEX-DM_23-1-final-eng.pdf
18-04-UA_REPORT_MEDIALITERAСY_INDEX-DM_23-1-final-eng.pdf18-04-UA_REPORT_MEDIALITERAСY_INDEX-DM_23-1-final-eng.pdf
18-04-UA_REPORT_MEDIALITERAСY_INDEX-DM_23-1-final-eng.pdfssuser54595a
 
How to Configure Email Server in Odoo 17
How to Configure Email Server in Odoo 17How to Configure Email Server in Odoo 17
How to Configure Email Server in Odoo 17Celine George
 
URLs and Routing in the Odoo 17 Website App
URLs and Routing in the Odoo 17 Website AppURLs and Routing in the Odoo 17 Website App
URLs and Routing in the Odoo 17 Website AppCeline George
 
Concept of Vouching. B.Com(Hons) /B.Compdf
Concept of Vouching. B.Com(Hons) /B.CompdfConcept of Vouching. B.Com(Hons) /B.Compdf
Concept of Vouching. B.Com(Hons) /B.CompdfUmakantAnnand
 
Paris 2024 Olympic Geographies - an activity
Paris 2024 Olympic Geographies - an activityParis 2024 Olympic Geographies - an activity
Paris 2024 Olympic Geographies - an activityGeoBlogs
 
Software Engineering Methodologies (overview)
Software Engineering Methodologies (overview)Software Engineering Methodologies (overview)
Software Engineering Methodologies (overview)eniolaolutunde
 
Interactive Powerpoint_How to Master effective communication
Interactive Powerpoint_How to Master effective communicationInteractive Powerpoint_How to Master effective communication
Interactive Powerpoint_How to Master effective communicationnomboosow
 
BASLIQ CURRENT LOOKBOOK LOOKBOOK(1) (1).pdf
BASLIQ CURRENT LOOKBOOK  LOOKBOOK(1) (1).pdfBASLIQ CURRENT LOOKBOOK  LOOKBOOK(1) (1).pdf
BASLIQ CURRENT LOOKBOOK LOOKBOOK(1) (1).pdfSoniaTolstoy
 
The basics of sentences session 2pptx copy.pptx
The basics of sentences session 2pptx copy.pptxThe basics of sentences session 2pptx copy.pptx
The basics of sentences session 2pptx copy.pptxheathfieldcps1
 

Recently uploaded (20)

Introduction to AI in Higher Education_draft.pptx
Introduction to AI in Higher Education_draft.pptxIntroduction to AI in Higher Education_draft.pptx
Introduction to AI in Higher Education_draft.pptx
 
Enzyme, Pharmaceutical Aids, Miscellaneous Last Part of Chapter no 5th.pdf
Enzyme, Pharmaceutical Aids, Miscellaneous Last Part of Chapter no 5th.pdfEnzyme, Pharmaceutical Aids, Miscellaneous Last Part of Chapter no 5th.pdf
Enzyme, Pharmaceutical Aids, Miscellaneous Last Part of Chapter no 5th.pdf
 
KSHARA STURA .pptx---KSHARA KARMA THERAPY (CAUSTIC THERAPY)————IMP.OF KSHARA ...
KSHARA STURA .pptx---KSHARA KARMA THERAPY (CAUSTIC THERAPY)————IMP.OF KSHARA ...KSHARA STURA .pptx---KSHARA KARMA THERAPY (CAUSTIC THERAPY)————IMP.OF KSHARA ...
KSHARA STURA .pptx---KSHARA KARMA THERAPY (CAUSTIC THERAPY)————IMP.OF KSHARA ...
 
A Critique of the Proposed National Education Policy Reform
A Critique of the Proposed National Education Policy ReformA Critique of the Proposed National Education Policy Reform
A Critique of the Proposed National Education Policy Reform
 
Model Call Girl in Tilak Nagar Delhi reach out to us at 🔝9953056974🔝
Model Call Girl in Tilak Nagar Delhi reach out to us at 🔝9953056974🔝Model Call Girl in Tilak Nagar Delhi reach out to us at 🔝9953056974🔝
Model Call Girl in Tilak Nagar Delhi reach out to us at 🔝9953056974🔝
 
Solving Puzzles Benefits Everyone (English).pptx
Solving Puzzles Benefits Everyone (English).pptxSolving Puzzles Benefits Everyone (English).pptx
Solving Puzzles Benefits Everyone (English).pptx
 
Contemporary philippine arts from the regions_PPT_Module_12 [Autosaved] (1).pptx
Contemporary philippine arts from the regions_PPT_Module_12 [Autosaved] (1).pptxContemporary philippine arts from the regions_PPT_Module_12 [Autosaved] (1).pptx
Contemporary philippine arts from the regions_PPT_Module_12 [Autosaved] (1).pptx
 
Separation of Lanthanides/ Lanthanides and Actinides
Separation of Lanthanides/ Lanthanides and ActinidesSeparation of Lanthanides/ Lanthanides and Actinides
Separation of Lanthanides/ Lanthanides and Actinides
 
Crayon Activity Handout For the Crayon A
Crayon Activity Handout For the Crayon ACrayon Activity Handout For the Crayon A
Crayon Activity Handout For the Crayon A
 
9953330565 Low Rate Call Girls In Rohini Delhi NCR
9953330565 Low Rate Call Girls In Rohini  Delhi NCR9953330565 Low Rate Call Girls In Rohini  Delhi NCR
9953330565 Low Rate Call Girls In Rohini Delhi NCR
 
CARE OF CHILD IN INCUBATOR..........pptx
CARE OF CHILD IN INCUBATOR..........pptxCARE OF CHILD IN INCUBATOR..........pptx
CARE OF CHILD IN INCUBATOR..........pptx
 
18-04-UA_REPORT_MEDIALITERAСY_INDEX-DM_23-1-final-eng.pdf
18-04-UA_REPORT_MEDIALITERAСY_INDEX-DM_23-1-final-eng.pdf18-04-UA_REPORT_MEDIALITERAСY_INDEX-DM_23-1-final-eng.pdf
18-04-UA_REPORT_MEDIALITERAСY_INDEX-DM_23-1-final-eng.pdf
 
How to Configure Email Server in Odoo 17
How to Configure Email Server in Odoo 17How to Configure Email Server in Odoo 17
How to Configure Email Server in Odoo 17
 
URLs and Routing in the Odoo 17 Website App
URLs and Routing in the Odoo 17 Website AppURLs and Routing in the Odoo 17 Website App
URLs and Routing in the Odoo 17 Website App
 
Concept of Vouching. B.Com(Hons) /B.Compdf
Concept of Vouching. B.Com(Hons) /B.CompdfConcept of Vouching. B.Com(Hons) /B.Compdf
Concept of Vouching. B.Com(Hons) /B.Compdf
 
Paris 2024 Olympic Geographies - an activity
Paris 2024 Olympic Geographies - an activityParis 2024 Olympic Geographies - an activity
Paris 2024 Olympic Geographies - an activity
 
Software Engineering Methodologies (overview)
Software Engineering Methodologies (overview)Software Engineering Methodologies (overview)
Software Engineering Methodologies (overview)
 
Interactive Powerpoint_How to Master effective communication
Interactive Powerpoint_How to Master effective communicationInteractive Powerpoint_How to Master effective communication
Interactive Powerpoint_How to Master effective communication
 
BASLIQ CURRENT LOOKBOOK LOOKBOOK(1) (1).pdf
BASLIQ CURRENT LOOKBOOK  LOOKBOOK(1) (1).pdfBASLIQ CURRENT LOOKBOOK  LOOKBOOK(1) (1).pdf
BASLIQ CURRENT LOOKBOOK LOOKBOOK(1) (1).pdf
 
The basics of sentences session 2pptx copy.pptx
The basics of sentences session 2pptx copy.pptxThe basics of sentences session 2pptx copy.pptx
The basics of sentences session 2pptx copy.pptx
 

1. Project Risk Management (25 Points)You have been tasked to.docx

  • 1. 1. Project Risk Management (25 Points) You have been tasked to manage a facilities construction project for a non-profit organization. Specifically, the organization is undertaking a large project to build a 6000 square foot office and an attached building with 20 hotel style rooms for its beneficiaries (building a shelter). The budget is tight and the organization needs to have these facilities as soon as possible. The project is in the planning stage and you have some requirements documents and funding available. How would you use risk management on this project? Why would you use risk management? What are your most important considerations? What are the steps of your risk management process (use any model you like ie PMP, textbook, DoD etc)? Provide a Risk Breakdown Structure for the project. What risk identification tools would you use on the project? Why? Assume you are talking to a key stakeholder (donor) about your plan. 1. PROJECT RISK MANAGEENT (40 Points) Meaning of Risk Management Risk management is very important part of planning for project, the process of risk management is developed to reduce the risk of certain events happening which are having negative impact on overall project. Risk management is the identification, assessment and prioritization of risk followed by coordinated and economical application of resources to monitor, minimize, and control the probability and impact of negative outcomes. 0. How would you use risk management on this project? Our proposed project of constructing 6000 square foot office and twenty hotel style rooms is in planning stage; this is a plus point for the management as they can develop detailed risk management activities. Risk management depends on the understanding of the overall project in other words in order to develop detailed risk
  • 2. management activities the understanding of the project is very important. To use risk management for the project, we will create a detailed risk management plan which is also used to understand the whole project. The contents of risk management plan are as follows: 1. Project Description · Project objective: to construct 6000 square yard office and 20 rooms building. · External Dependencies: acquiring construction material, services of architects etc. · Stakeholder analysis: reaction of local residents, local government regulations, negotiation with donors, requirement of client etc. 1. Risk Management scope and objectives · Variance threshold: two main constraints in this project is time and funds. Calculated variance should be calculated for these two variables that is how long each activity could be stretched while keeping project feasible. By doing this we can identify the threshold of timing and budget after which project become in viable. · Prioritization of project objectives: in order to complete the project in time, a schedule of activities required showing activities of project needs priority and others which could be delayed. 1. Risk Management methodology · Relationship with organizational environment · Risk management activities 1. Risk Management organization
  • 3. · Defining clear roles, responsibility and level of authority for risk management: written responsibilities of each member of the project and also well communicated to the members of the project, such as roles of escalation. · Make a budget for risk management activities and add these costs to the overall cost of the project. 1. Reporting · Who will report to whom, the format of reports, frequency of meeting among members and how the effective governance applied to the project? 1. Use of tools · Which tool is going to be used and to what extent, the limitation and strengths of selected tools. 0. Why would you use risk management? The payback of risk management in construction projects is massive; we can gain lot if we tackle the uncertain events in project in a proactive manner. By doing risk management we can minimize the impact of threats on the project while keeping the potential benefits of opportunities which could arise from uncertain events having positive impact on the project, for example, we can deliver project on required time that is construction of office and twenty rooms on time, completion of construction in available budget and finally the quality of the project would be according to the standards. The project for which we are going to use risk management techniques is the construction of 6000 square foot office and a building for 20 hotel style rooms for residents. The project is undertaken on non profit basis and our prime objective would be to complete the required task in allocated budget and of required quality. By managing risk we can increase the probability of project success. Another reason of using risk management is that it ensures that the appetite for risk is properly understood at the very beginning of the project, in
  • 4. other words it ensures that all risk agreed upon are properly assessed, prioritized, communicated and understood in line with the risk appetite of the construction project. Risk management also builds a solid platform to track the agreed tasks and actions and to take corrective measures if needed in future. By applying risk management activities properly, the cost of applying risk management activities are much less than the cost which arise if project failed, the return on that investment is normally at least five to one, and might be much higher. Along with opportunity to save funds, the typical benefits of project risk management are: · Provoke rational, risk informed thinking and risk awareness among project team. · Address project risk factors proactively. · Ensures that risk management and crises management plans are in place. · And most importantly customer satisfaction. Final decision to adopt project risk management, and the level of these activities should be made on the merits of each project, risk management activities adds cost to overall cost of the project so we should appreciate that the project risk management activities will be well compensated. 0. What are your most important considerations? The most important consideration will be the identification of the nature of a risk because it is a precondition for a better response. Therefore adequate time to be spend make a closer look at an individual risks we should try not to reach the conclusions without knowing what a risk is actually about. We should appreciate risk analysis occurs at different levels of project. Another important stage of risk analysis is to investigate the whole project. The project manager requires answering the usual questions about the total budget required and the date the project will finish. If you take risks into account, you can do a simulation to show your project sponsor how likely it is that you finish on a given date or within a certain time frame. A similar exercise can be done for project
  • 5. costs. The information we collected in a risk analysis will provide valuable picture in your project and the necessary input to find effective responses to neutralize the risks. A better approach is to consistently include risk communication in the tasks the teams carry out. If there will be a team meeting we should make project risks be part of the default agenda of that meeting. This depicts risks are very important to the project manager and it gives a natural moment for team members to discuss and report any new ones as identified. Second important consideration would be the line of communication between project manager and project sponsor or client. The final most important consideration would be the taking the advantage of potential opportunities that could arise in future, these are also the uncertain events which have positive impact on the project, such as decline in prices of raw material etc. Can be summarized the most important considerations: 1. Determination of Objective 1. Cost Benefit Analysis 1. Compliance with standard 1. Stakeholders 1. COSO ERM Framework 1. Cost 1. Time Schedule 1. Performance 0. What are the steps of your risk management process? Some very comprehensive guidelines for managing risk and risk management process are available from many sources, according to the risk management institute the risk management process include following steps: 1. Risk Management planning 1. Risk Identification 1. Qualitative risk analysis 1. Quantitative risk analysis
  • 6. 1. Risk Response planning 1. Risk Monitoring and control 3. Risk Management Planning Risk management planning decides how to approach and plan the risk management activities for the construction project. The final outcome of risk management planning would be the detailed risk management plan. Risk management planning helps to overcome the barriers to in the project, it involves all stakeholders and most importantly risk management planning took note of organization’s policies and tactical and strategic objectives. The outcome of risk management planning is risk management plan the contents of risk management plan would be: 1. Methodology to manage risk 2. Roles and responsibilities of team members 3. Budgeting of resources 3. Timing of tasks 4. Risk breakdown structure 5. Calculation of risk probabilities and its impact on overall project. 6. Creation of probability matrix 6. Stakeholders analysis and their tolerance level 7. Reporting format 8. How to track the progress of the project. The above ten points are maximum steps which as organization took in order to manage the risk; the level of detail depends on the need of the project. In the given construction project the main barriers are limited resources and lack of sufficient time. There is a pressure for completion of task in given time. So the management has decided to make detailed plan for resources and time management. Roles and responsibilities of team members, risk break down structure and reporting format should also be included in the risk management plan. 3. Risk Identification The next step in our risk management process will be risk identification, risk identification process determines which risk is likely to affect a project and finally documenting the
  • 7. characteristics of each identified risk for future reference. There are tools and techniques available to identify the risk which could hurt or enhance this project. The available tools are as follow: 1. Historical Review 1. Current assessment 1. Creativity 1. Diagramming techniques 1. Assumption analysis Each of the above technique has its strengths and weakness some of them require more time and other requires experience, which technique should be used depends on the individual circumstances of each project. Is it possible for anyone to be you able to identify all project risks before they occur the answer is probably no. However if project manager combine a number of different risk identification methods, they are more likely to find the large majority of potential risks, and in response of if project manger deal with them properly and accurately, they should have enough time left to tackle the unexpected risks that might arise in future as project progress. 3. Qualitative Risk Analysis The main qualitative analysis we could use here are preliminary risk analysis and hazard and operability analysis. Different qualitative risk analysis includes: 1. Risk probability and impact matrix 1. Probability and impact matrix 1. Risk data quality assessment 1. Risk categorization 1. Risk urgency statement 1. Expert judgment. Preliminary risk analysis is a qualitative risk analysis technique which involves a structured analysis of the events and sequences which could make or convert a potential hazard into an accident. In this technique, first the potential unfavorable events are identified and then analyzed separately. For each undesirable events or hazards, possible improvements, or
  • 8. preventive measures are then designed. The result from preliminary risk analysis support a basis for evaluating which categories of potential hazard should be analyzed more closely and which analysis methods are most favorable. Such an analysis also proved valuable in the working environment to which activities lacking safety measures can be readily identified. Most projects could use qualitative risk analysis technique to confirm which risks are most important and need to be managed. Qualitative technique is a quick estimate and does not show the detailed and numerical analysis. When we use qualitative risk analysis we should evaluate each single risk and classified each risk as high, medium, or low, depending on the seriousness of its impact and the probability of the event occurring. Here are the steps involved in this technique: The following points show the way how the qualitative risk analysis applied in that construction project: · High negative impact to project High chance of occurrence -- high risk · High negative impact to project / Medium chance of occurrence -- high risk · High negative impact to project / No chance of occurrence -- medium/low risk · Medium negative impact to project / Highly chance of occurrence -- medium risk · Medium negative impact to project / Medium chance of occurrence -- medium/low risk · Medium negative impact to project / Not chance of occurrence -- low risk · Low negative impact to project / Highly chance of occurrence -- low risk · Low negative impact to project / Medium chance of occurrence -- low risk · Low negative impact to project / No chance of occurrence - low risk
  • 9. 3. Quantitative risk analysis methods Quantitative risk analysis method includes numerically estimating the effect of risk on project, the methods used to do quantitative analysis includes: 1. Data gathering 1. Quantitative risk analysis and modeling 1. Monte Carlo simulation model 1. Decision tree analysis on test 1. Expected monetary value analysis(EMV) 3. Risk Response Planning Risk response planning includes taking steps to enhance opportunities and trying to reduce the impact of threats in meeting the project objectives. Tools and techniques available to use in risk response planning are: 1. Strategies for negative risk or threats 1. Strategies for positive risk and opportunities 1. Strategy for both opportunity and threat 1. Contingent response strategy Overall we will design and develop mitigation and contingency plan for potential threats which will impact the project in negative way. 3. Risk Monitoring and Control This process evaluates the effectiveness of risk strategies throughout the total life of the project, monitor and identify the residual risk, carrying out the risk response plans, tools and techniques available for monitoring and control are: 1. Risk Assessment 1. Risk Audits 1. Variance and trend analysis 1. Technical performance measurement 1. Reverse analysis 1. And status meetings. 0. Provide a Risk Breakdown Structure for the project. Risk Breakdown Structures will vary between different projects.
  • 10. One positive outcome of developing generic risk breakdown structure is to remind those people who are engaged in the Risk Identification process. The results of risk breakdown structure become input for Qualitative Risk Analysis methods and probabilities and impacts are assigned according to the RBS. The impacts can be numerical or High, Medium, Low. Identified risks are then listed according to their potential impact for affecting the Project’s success. Other important point is to take into account the tolerance levels of stake holder’s risk, reporting formats and how finally how these risks would be tracked. RBS LEVEL 0 RBS LEVEL 1 RBS LEVEL 2 RBS LEVEL 3 PROJECT RISK MANAGEMENT PROJECT Scope Not properly defined Technology Technology might me out date Cost Not Accurate, Use of mid-range values Schedule Reduced Float TECHNICAL Mechanical Drawing are not updated
  • 11. Safety Delay of approval from related authority Safeguard and security Delay of approval of vulnerability analysis Environmental Delay in signing INTERNAL Human Resources Required resources not available Organizational Structure Required experience level not available Organization organization structure might not effective Governance risk arises due to the governance issues Communication lack of communication in management Management Management re organization occurring
  • 12. EXTERNAL Political Delay in appropriation Funding Funding from donor withheld Site Facilities inadequate site facilities Legislation new laws emerge regarding donation Regulatory fail to fulfill the regulatory requirement Legal Legal action by any stakeholder 0. What risk identification tools would you use on the project? Why? Risk identification is of utmost importance, it is a proactive approach to handle risk. It is argued that it is almost impossible to indentify all risks which could affect the project negatively so by identifying the maximum possible risk and designing the response strategy, there would be enough time left for unexpected risk hence chances of project success increased substantially. The critical success factor for risk identification
  • 13. of are: 1. Indentify early: try to identify risk as early as possible. The risk unfolded before identification could have devastating effect on the overall project, limiting the success of the project. 1. Comprehensive: the identified risk should be comprehensive so that proper response could be designed. 1. Multiple perspectives: the effect of identified risk should be analyzed from different prospective. 1. Include opportunities: the identification process should not only include the search of negative uncertain events rather positive risk should also be identified. 1. Objectivity: identification process should be progressed with clear objective in mind otherwise distraction could impact the identification process negatively. There are many risk identification techniques which can be used in this construction project but we should keep this mind that the project is in its planning stage and there is time pressure to complete the project on asked time. The available resources also impact the selection of risk identification method, the available risk identification tools could be placed under the heading of historical review, Current assessment, Creativity, Diagramming techniques and Assumption analysis. The strengths and weakness of available risk identification tools are as follows: 1. Brainstorming Plus point: Allows all participants to speak their mind and contribute to the discussion Can involve all key stakeholders Negative point: Requires attendance of key stakeholders at a meeting, therefore can be difficult to arrange and might be expensive, May produce biased results if dominated by a strong person. It normally generates non risks and duplicates risks which than requires filtering. 1. Interviews Plus point: This technique addresses risks in detail and also generates engagement of stakeholders. Negative point: It is time consuming technique, also raises non risks, concerns, issues, worries, so required filtering process.
  • 14. The prerequisite of this technique is good interviewing and questioning skills. 1. SWOT Analysis Plus point: This technique makes equal focus on both threats and opportunities, Offers a structured Approach to identify threats and opportunities also focus on internal (organizational strengths and weaknesses) and external (opportunities and threats) Negative point: Focuses on internally generated risks arising from organizational strengths and weaknesses, ignores external risks Tends to produce high level generic risks, not project specific. 1. Industry knowledge base Plus point: This technique shows previous experience; by allowing benchmarking against external projects. Negative point: This technique also excludes project specific risks, by focusing on the industry. 1. Cause and Effect Plus point: In this technique visual diagram of project is presented which promotes structured thinking of risk linked with the project. Negative point: Diagram used for presentation could become complex as project progress, it becomes difficult for participant to understand the diagram. 1. Delphi Technique Plus point: This technique takes input from technical experts and eliminates the risk of bias in risk identification. Negative point: Delphi technique is limited to technical risks and relies on actual expertise of selected experts; also this technique takes longer time than available due to iterations of the experts’ inputs.
  • 15. 1. Influence diagrams Plus point: This technique reveals main risk drivers and can create counterintuitive sights which are not possible through using other techniques. Negative point: The main drawback of this technique is that it needs disciplined thinking and usually it is not always easy to determine appropriate structure. We have two barriers here one is limited resources and other one is shortage of time, we will select the method which give us maximum benefits while using less resources. It is also recommended to use more than one method in order to get maximum positive results. We will use SWOT technique because it focus on both threats and opportunities, the outcome of SWOT analysis is very comprehensive and data collected under this technique could be used on other parts of the project. The other technique we have selected is cost and effect technique. The reason is the information collected under SWOT analysis could be used as an input of cause and effect technique and a comprehensive diagram can be developed. Bookkeeping of identified risk enables project team to view progress and make sure that management has not missed any risk which needs to be treatment. Risk register is also a perfect communication technique that informs team members and also stakeholders that how the project is progressing. A perfect risk register include risks descriptions, clarifies ownership issues and enables the project team to take some basic analyses with regard to causes and effects. It could be argued that maintaining risk register increase the administrative job and eventually the overall more time would be consumed, due to this reason some team member might resist in maintaining the register. But the benefits of maintaining risk register easily outclass the negative points. Such as project member track each risk and analyze how each identified risk is treated.
  • 16. 2. Operational Risk Management and Disasters (10 points) Briefly discuss some of the key causes of disasters and/or Operational Risk Management failures. Relate the causes to their occurrence in a specific disaster (your choice). Operational Risk Management is a process which includes risk identification and assessment, Risk decision making, designing and implementing the controls to mitigate risk which results in acceptance, mitigation, or avoidance of risk. Operational Risk Management is the oversight of operational risk, including the risk of loss resulting from inadequate or failed internal processes and systems; human factors; or external events. Operational risks arise by a wide list of different external events starting from power cut to natural disasters such as floods or earthquakes or might be terrorist attacks. Similarly, operational risk can arise due to internal events such as the potential for failures or inadequacies in any of the Bank’s processes and systems or those of its outsourced service providers. Operational risk which raised from human resources management may refer to a range of issues such as mismanaged or poorly trained employees; the potential of employees for negligence, willful misconduct; conflict of interests; fraud; and so on. Therefore the emergence of mistrust, failure to communicate, low morale and cynicism among staff members, as well as increased turnover of staff, should be regarded as indicative for potential increase in operational risk. Outsourcing task require careful consideration if they are to get benefits, and where they are not managed properly the degree of operational risk faced by the Bank might increase, as is also the case of extra use and dependency upon the use of consultants for activities that may be more effectively developed internally. In particular, an issue for concern is the loss of control over processes. This could create a serious threat to the continuity of
  • 17. its operations if these providers were to fail. 0. Benefits of Operational Risk Management The benefits of operational risk management are as follows: 1. Operational loss will be reduced 1. Compliance and auditing cost minimized 1. Early identification of unlawful activities 1. Exposure to future risk reduced 0. Causes of operational risk management failure Some of the reasons of failure of operational risk management are as follows: 1. Key risk indicators are often insufficiently linked to underlying business objectives and risk assessment to provide effective risk monitoring; 1. Risk-assessment processes often fail to provide either an effective means of understanding the operational risk profile, or a practical tool for driving control improvement action and consequent reductions in allocated capital; 1. Loss-data collection often provides a one-way feed into an ‘invisible’ group model, rather than being used by the business to identify areas of control weakness; 1. Operational risk quantification is often viewed as irrelevant to the day-to-day management of risk itself stemming from an unclear responsibility allocation as to operational risks. 0. Oil spill disaster in Gulf of Mexico (British Petroleum) Oil spill incident occur on 20 April 2010 in region of Gulf of Mexico, 11 workers died on spot. The spill caused by explosion on oil rig about millions of gallons of oil dumped in to the Gulf of Mexico. British Petroleum has set up a $20 billion fund to compensate victims of the oil spill. According to the report of bureau of ocean energy management the operational risk management failures were the main cause of
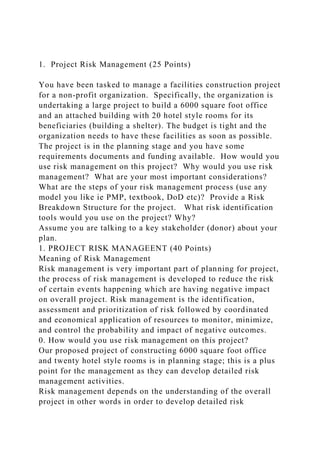
  • 18. that disaster. British petroleum fails to perform the formal risk assessment of critical operational decisions. The report also shows that the British petroleum has initiated cost cutting and time saving decisions, although these decisions seems healthy form corporate earnings point of view but dangerous thing was that these decisions were taken without any consideration of contingencies and mitigation. And these contagious decisions contributed to that deadly disaster. Effect of cost cutting and time saving on operational risk management As per definition the operational risk management is a continuous process of risk identification and mitigation in day to day operation. To save time and money the British petroleum and its contractors has by passed some important risk management steps, according to the report following wrong steps were taken by British petroleum: 1. Ignored the diagnostic test to check the strength of cement before pouring the cement in the oil well. 1. Ignoring the pressure test of methane which then causes the explosion on the rig. 1. Inadequate training of engineers and oil rig personnel. The British petroleum has saved lot of money by taking these steps but at the end the uncertain event unfolds and forced the company to face huge losses. If proper risk mitigation strategy was in place the company might had saved billion of dollars. 3. Briefly describe the main sources of project Scope & Cost risks. (15 points) Scope risks are most numerous in the Project Experience Risk Information Library (PERIL) database, representing more than one-third of the data. Even more important, risks related to
  • 19. scope accounted for nearly half of the total schedule impact. The two broad categories of scope risk in PERIL relate to changes and defects . By far the most damage was due to poorly managed change (two-thirds of the overall scope impact and almost a third of all the impact in the entire database), but all the scope risks represented significant exposure for these projects. While some of the risk situations, particularly in the category of defects, were legitimately “unknown” risks, quite a few of the problems could have been identified in advance and managed as risks. The two major root-cause categories for scope risk are separated into more detailed sub-categories. Scope changes due to gaps were the most frequent, but scope creep changes were the most damaging on average. A Pareto chart of overall impact by type of risk is summarized in Figure 3-1 , and a more detailed analysis follows. Change Risks Change happens. Few if any projects end with the original scope intact. Managing scope risk related to change relies on minimizing the loose ends of requirements at project initiation and having (and using) a robust process for controlling changes throughout a project. In the PERIL database, there are three categories of scope change risks: scope creep, scope gaps , and dependencies . Figure 3-1. Total project impact by scope root- cause subcategories. in an average schedule slip of nearly nine weeks. Scope gaps were only slightly less damaging, at well over eight weeks of slippage, and were also both more common and had greater total impact. Each of these subcategories individually represented about one-sixth of all the problems in the PERIL database. Scope gaps are the result of committing to a project before the project requirements are complete. When legitimate needs are uncovered later in the project, change is unavoidable. Some of the overlooked requirements were a consequence of the novelty of the project, and some were because of customers, managers, team members, or other project stakeholders who were not available at the project start.
  • 20. Although some of the scope gaps are probably unavoidable, in most of the cases these gaps were due to incomplete or rushed analysis. A more thorough scope definition and project work breakdown would have revealed the missing or poorly defined portions of the project scope. Scope creep plagues all projects, especially technical projects. New opportunities, interesting ideas, undiscovered alternatives, and a wealth of other information emerges as the project progresses, providing a perpetual temptation to redefine the project and to make it “better.” Some project change of this sort may be justified through clear-eyed business analysis, but too many of these nonmandatory changes sneak into projects because the consequences either are never analyzed or are drastically underestimated. To make matters worse, the purported benefits of the change are usually unrealistically overestimated. In retrospect, much of scope creep delivers little or no benefit. In some particularly severe cases, the changes in scope delay the project so much that the ultimate deliverable has no value; the need is no longer pressing or has been met by other means. Scope creep represents unanticipated additional investment of time and money, because of both newly required effort and the need to redo work already completed. Scope creep is most damaging when entirely new requirements are piled on as the project runs. Such additions not only make projects more costly and more difficult to manage, they also can significantly delay delivery of the originally expected benefits. Managing scope creep requires an initial requirements definition process that thoroughly considers potential alternatives, as well as an effective process for managing specification changes throughout a project. Scope creep can come from any direction, but one of the most were not apparent earlier. This can lead to well- intentioned proposals by someone on the project team to “improve” the deliverable. Sometimes, scope creep of this sort happens with no warning or visibility until too late, within a portion of the project where the shift seems harmless. Only after the change is made do the real, and sometimes catastrophic,
  • 21. unintended consequences emerge. Particularly on larger, more complicated projects, all changes deserve a thorough analysis and public discussion, with a particularly skeptical analysis of all alleged benefits. Both scope creep and scope gaps are universal and pervasive issues for technical projects. Scope dependencies are due to external factors that affect the project and are the third category of change risk. (Dependency risks that are primarily due to timing rather than requirements issues are characterized as schedule risks in the database.) Though less frequent in the PERIL database, compared with other scope change risks, scope dependencies did represent an average slippage of over a month. Admittedly, some of the cases in the database involved situations that no amount of realistic analysis would have uncovered in advance. Other examples, though, were a result of factors that should not have come as complete surprises. Although legal and regulatory changes do sometimes happen without notice, a little research will generally provide advance warning. Projects also depend on infrastructure stability, and periodic review of installation and maintenance schedules will reveal plans for new versions of application software, databases, telecommunications, hardware upgrades, or other changes that the project may need to anticipate and accommodate. Defect Risks Technical projects rely on many complicated things to work as expected. Unfortunately, new things do not always operate as promised or as required. Even normally reliable things may break down or fail to perform as desired in a novel application. Defects represent about a third of the scope risks and about one-seventh of all the risks in the PERIL database. The three categories of defect risks are software, hardware , and integration. Software problems and hardware failures were the most common types of defect risk in the PERIL database, approximately equal in frequency. They were also roughly equal in impact, with software defects slightly exceeding seven weeks of delay on average and hardware problems a bit less than seven weeks. In several cases, the root cause was new, untried technology that
  • 22. lacked needed functionality or reliability. In other cases, a component created by the project (such as a custom integrated circuit, a board, or a software module) did not work initially and had to be fixed. In still other cases, critical purchased components delivered to the project failed and had to be replaced. Nearly all of these risks are visible, at least as possibilities, through adequate analysis and planning. Some hardware and software functional failures related to quality or performance standards. Hardware may be too slow, require too much in unusual circumstances. As with other defects, the definition, planning, and analysis of project work will help in anticipating many of these potential quality risks. Integration defects were the third type of defect risk in the PERIL database. These defects related to system problems above the component level. Although they were not as common in the database, they were quite damaging. Integration defects caused an average of nearly seven weeks of project slip. For large programs, work is typically decomposed into smaller, related subprojects that can progress in parallel. Successful integration of the deliverables from each of the subprojects into a single system deliverable requires not only that each of the components delivered operates as specified but also that the combination of all these parts functions as a system. All computer users are familiar with this failure mode. Whenever all the software in use fails to play nicely together, our systems lock up, crash, or report some exotic “illegal operation.” Integration risks, though relatively less common than other defect risks in the PERIL database, are particularly problematic, as they generally occur near the project deadline and are never easy to diagnose and correct. Again, thorough analysis relying on disciplines such as software architecture and systems engineering is essential to timely identification and management of possible integration risks. upgrades, or other changes that the project may need to anticipate and accommodate. Defect Risks Technical projects rely on many complicated things to work as expected. Unfortunately, new things do not always operate as promised or
  • 23. as required. Even normally reliable things may break down or fail to perform as desired in a novel application. Defects represent about a third of the scope risks and about one-seventh of all the risks in the PERIL database. The three categories of defect risks are software, hardware , and integration. Software problems and hardware failures were the most common types of defect risk in the PERIL database, approximately equal in frequency. They were also roughly equal in impact, with software defects slightly exceeding seven weeks of delay on average and hardware problems a bit less than seven weeks. In several cases, the root cause was new, untried technology that lacked needed functionality or reliability. In other cases, a component created by the project (such as a custom integrated circuit, a board, or a software module) did not work initially and had to be fixed. In still other cases, critical purchased components delivered to the project failed and had to be replaced. Nearly all of these risks are visible, at least as possibilities, through adequate analysis and planning. Some hardware and software functional failures related to quality or performance standards. Hardware may be too slow, require too much in unusual circumstances. As with other defects, the definition, planning, and analysis of project work will help in anticipating many of these potential quality risks. Integration defects were the third type of defect risk in the PERIL database. These defects related to system problems above the component level. Although they were not as common in the database, they were quite damaging. Integration defects caused an average of nearly seven weeks of project slip. For large programs, work is typically decomposed into smaller, related subprojects that can progress in parallel. Successful integration of the deliverables from each of the subprojects into a single system deliverable requires not only that each of the components delivered operates as specified but also that the combination of all these parts functions as a system. All computer users are familiar with this failure mode. Whenever all the software in use fails to play nicely together, our systems lock up, crash, or report some
  • 24. exotic “illegal operation.” Integration risks, though relatively less common than other defect risks in the PERIL database, are particularly problematic, as they generally occur near the project deadline and are never easy to diagnose and correct. Again, thorough analysis relying on disciplines such as software architecture and systems engineering is essential to timely identification and management of possible integration risks. Based on schedule impact, the worst 20 percent of the risks from each category in the PERIL database—defined as “black swans”—deserve more detailed attention. We’ll explore these “large-impact, hard-to-predict, rare events” in this section. Each of the black swan risks represented at least three months of schedule slip, so each certainly qualifies as large impact. Black swan risks are rare; the PERIL database has an intentional bias in favor of the most serious risks, which are (or at least we hope are) not risks we expect to see frequently. The purpose of this section and the discussions in Chapters 4 and 5 is to make some of these black swans easier to predict. Of the most damaging 127 risks in the PERIL database, 64—just over half—were scope risks. In the database as a whole, the black swans accounted for slightly more than half of the total risk impact. The top scope risks exceeded this with nearly 60 percent of the aggregate scope risk impact. The details are presented in the following table. As the table shows, the black swan scope risks were dominated by change risk, with about three-quarters of these risks in terms of both generally more straightforward. There were forty-seven black swan scope risks associated with change, dominated by scope gaps (with a total of twenty-five). Examples of the scope gap risks were: • Project manager expected the solution to be one item, but it proved to be four. • New technology required unanticipated changes to function. • Development plans failed to include all of the 23 required applications. • End users were too little involved in defining the new system. • Requirements were understood differently by key
  • 25. stakeholders. • Scope initially proposed for the project did not receive the upper management sign-off. • Some countries involved provided incomplete initial requirements. • Fit/gap analysis was poor. • The architect determined late that the new design plan would be considerably more complex than expected. • Lack of consensus on the specifications resulted in late project adjustments. • When a survey required for the project was assigned to several people in different countries, each assumed someone else would do it but no one did. • A midproject review turned up numerous additional regulations. • Manufacturing problems were not seen in the original analysis. Most of the rest of the change risk black swans were attributable to scope creep. Among these twenty-one risks were: • Scoping for the project increased substantially after the award was won. • New technology was introduced late in the project. • The project team agreed to new requirements, some of which proved to be impossible. • Late changes were poorly managed. • The contract required state-of- the-art materials, which changed significantly over the project’s two-year duration. • Volume requirements increased late in the project, requiring extensive rework. • Mid-project feature revisions had a major impact on effort and schedule, making the product late to market. • A merger occurred during a companywide software refresh of all desktops and laptops, adding more systems and hugely complicating the project. • A system for expense analysis expanded into redesign of most major internal systems. without communicating or getting approval from others. • Late change required new hardware and a second phase. • Application changed midproject to appeal to a prospective Chinese customer (who never bought). • Project specifications changed, requiring material imported from overseas. There was a single black swan change risk caused by an external dependency (in a pharmaceutical project, a significant study was unexpectedly mandated). There were fewer black swans in the scope defect categories (seventeen
  • 26. total). Software and hardware defects each caused eight, and one was a consequence of poor integration. Examples of scope defect risks included: • Redesign was required in a printer development project that failed to meet print quality goals. • The system being developed had twenty major defects and eighty additional problems that had to be fixed. • In user acceptance testing, a fatal flaw sent the deliverable back to development. • During unit testing, performance issues arose with volume loads. • Contamination of an entire batch of petri plates meant redoing them all. · Server crashed with four months of information, none of it backed up, requiring everything to be reentered. • Hardware failed near the end of a three-month final test, necessitating refabrication and retest. • Purchased component failed, and continuing the project depended on a brute force and difficult- to-support workaround. • System tool could not be scaled to a huge Web application. • A software virus destroyed interfaces in two required languages, requiring rework. • A purchased learning management system had unanticipated modular complexity. Identifying scope risks similar to the examples given here can expose many potential problems. Reviewing these examples and the additional scope risks from the PERIL database listed in the Appendix can be a good starting point for uncovering possible scope-related problems on your next project. Find the percentage change. Round to the nearest tenth of a percent if necessary and state whether the change is an increase or a decrease. From 88 hours to 54 hours Find the final price of the item below, given that the tax will be applied to the discounted price. Original price of a jacket: $150.00 Discount: 5%
  • 27. Tax: 2% Use simple interest to find the ending balance, given the following values for principal, rate, and time. $45,700 at 1.2% for 2 years Find the x- and y-intercepts of the line represented by the equation below. Plot both intercepts on a coordinate system and drawn the line through them. 12 x + y = 5 Sarawong and Lisa are selling flower bulbs for a school fundraiser. Customers can buy packages of tulip bulbs and bags of daffodil bulbs. Sarawong sold 6 packages of tulip bulbs and 4 bags of daffodil bulbs for a total of $82. Lisa sold 12 packages of tulip bulbs and 7 bags of daffodil bulbs for a total of $151. Find the cost each of one package of tulips bulbs and one bag of daffodil bulbs.