Download to read offline

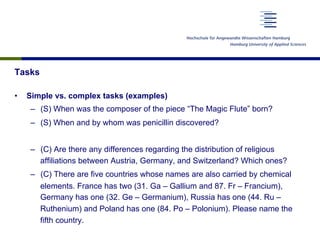
![User sample
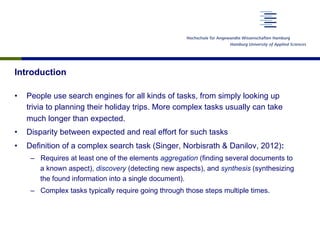
• 60 users
• Recruitment followed a demographic
structure model
• A sample of that size cannot be
representative, but is a vast
improvement over samples usually
used (i.e., self-selection, students)
• Data from 4 users was corrupted and
therefore, was not analysed
” or “di cult”, sometimes interchangeably.
reader of this paper, we give some defini-
will use throughout this paper.
stract description of activities to achieve a
1].
rocess of finding information.
s a piece of work concerning the retrieval
lated to an information need. The search
out with IR systems [11].
s complex if it requires at least one of the
tion, discovery and synthesis [15]. It typ-
viewing many documents and synthesizing
ed format.
di cult if a lot of cognitive input is needed
ask.
equires increased e↵ort if the user needs ei-
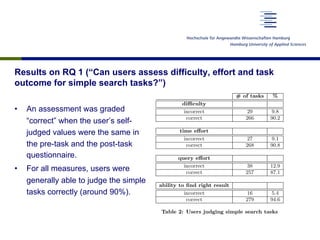
Basic Data Gender
Age Span Female Male Total
18-24 5 4 9
25-34 9 7 16
35-44 7 8 15
45-54 8 8 16
55-59 3 1 4
Total 32 28 60
Table 1: Demography of user sample
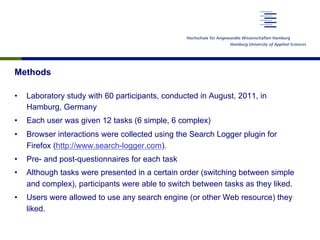
Hamburg, Germany. Participants were invited to the univ
sity, where they were given a set of search tasks (see belo
to fulfill. The study was carried out in one of the univ](https://image.slidesharecdn.com/iiixdirklewandowskifinal-140512165122-phpapp01/85/Ordinary-Search-Engine-Users-Assessing-Difficulty-Effort-and-Outcome-for-Simple-and-Complex-Search-Tasks-14-320.jpg)
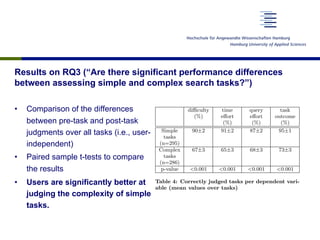
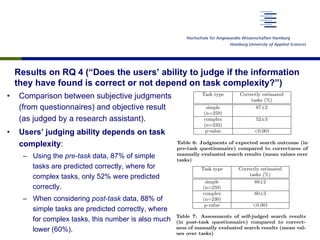
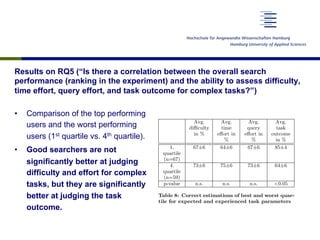

This document discusses a study that examined how ordinary search engine users assess the difficulty, effort, and outcomes of simple and complex search tasks. The study involved 60 participants who were given 12 search tasks (6 simple, 6 complex) and asked to complete pre- and post-task questionnaires rating the difficulty, time effort, query effort, and likelihood of finding the right information. Results showed that users were generally able to correctly judge simple tasks (~90% accuracy) but accuracy dropped to ~2/3 for complex tasks. Statistical analysis found users were significantly better at judging the complexity of simple vs. complex tasks. The study aimed to provide insights into how well users can estimate efforts and outcomes for different types of search tasks.


![How Big Brands are Taking Your Traffic in Alberta [Data Inside].pptx](https://cdn.slidesharecdn.com/ss_thumbnails/howbigbrandsaretakingyourtrafficinalbertadatainside-260123180142-42d276f3-thumbnail.jpg?width=640&height=640&fit=bounds)

