
Recommended
Recommended
More Related Content
What's hot
What's hot (20)
Similar to Examples on load curve
Similar to Examples on load curve (20)
More from dhirajthakkar1
Recently uploaded
Recently uploaded (20)
Examples on load curve
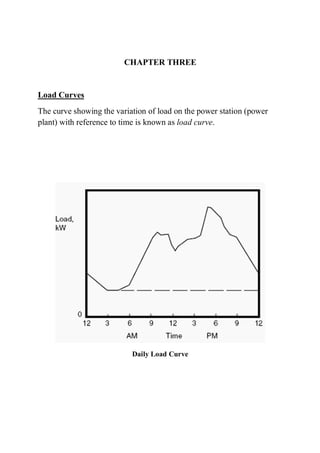
- 1. CHAPTER THREE Load Curves The curve showing the variation of load on the power station (power plant) with reference to time is known as load curve. Daily Load Curve
- 2. Maximum Load (Peak Load) It represents the maximum power that consumed by the load during a specific given time. It is also equal to the maximum actual power generated by the plant when the transmission losses are neglected. Average Load It is the average power that consumed by the load during a certain period of time and it is equal to the average power that generated by the plant during the same period of time when neglecting transmission line losses. Average Load = Area under the load curve (kWh) no. of hours (h) (kW) Load Factor It is the ratio of the average load to the maximum load for a certain period of time. The load factor is called daily load factor if the period of time is a day, and if the period of time is a month, the load factor is called monthly load factor, and similarly for the year load factor. Load Factor = Average Load Max. Load
- 3. Installed Capacity (Plant Capacity, nameplate capacity) It represents the maximum possible power that could be produced (generated) from the power plant. The value of the installed capacity depends on the plant design. Installed Capacity = Nominal power value of the plant (kW or MW) Reserve Capacity Reserve Capacity = Installed Capacity − Max. Demand (kW or MW) Plant Capacity Factor The capacity factor of a power plant is the ratio of its average output power over a period of time, to its maximum possible power that could be produced. It can be determined as below: Plant Capacity Factor = Average Demand (kW) Installed Capacity (kW) Utilisation Factor Utilisation Factor = Max. Demand (kW) Installed Capacity (kW)
- 4. Plant Use Factor Plant Use Factor = Actual energy produced (kWh) Installed Capacity (kW) × no.of operation hours(h) Or Plant Use Factor = Average Demand × T Installed Capacity × no. of operating hours Where T = 24 h if the time is a day T = 24 × 30 h if the time is a Month Diversity Factor Diversity Factor = Sum of Individual Max. Demand (kW) Max. Demand on power Plant (kW)
- 5. Load Duration Curve In this curve, the load elements of a load curve are arranged in order of descending magnitudes. So, the area under the load duration curve and the area under the load curve are equal. The following figure shows an example of the load curve and the load duration curve. Load(MW)Load(MW)
- 6. EX: A generation station of 1MW supplied a region which has the following demands: From To Demand (kW) midnight 5 am 100 5 am 6 pm No-load 6 pm 7 pm 800 7 pm 9 pm 900 9 pm midnight 400 Neglect transmission line losses and find the following: 1. Plot the daily load curve and the load duration curve. 2. Find the load factor, the reserve capacity, plant capacity factor, plant use factor, the hours that the plant has been off and utilization factor. Solution: When the transmission line losses are neglected, = , and the demand = load Installed capacity = 1 MW = 1000 kW and max. load = max. demand = 900 kW Average Load = Area under the load curve (kWh) no. of hours (h) Average Load = (5 × 100) + (13 × 0) + (1 × 800) + (2 × 900) + (3 × 400) 24 Average Load = 4300 kWh 24 h = 179.16 kW
- 7. 180 Time (h) 2 204 6 168 1410 12 22 24 100 400 800 900 180 Time (h) 2 204 6 168 1410 12 22 24 100 400 800 900 Load Curve Load Duration Curve
- 8. Load Factor = Average Load Max. Load = 179.16 kW 900 kW = 0.199 = 19.19% The Reserve Capacity = Installed Capacity − Max. Demand = 1000 − 900 = 100 kW Plant Capacity Factor = Average Demand Installed Capacity = 179.16 kW 1000 kW = 0.1791 = 17.91% Plant Use Factor = Actual Energy Produced in (kWh) Plant Capacity × no. of hours = 4300 kWh 1000 kW × 11 h Plant Use Factor = 0.3909 = 39.09% Utilisation Factor = Max. Demand Installed Capacity = 900 kW 1000 kW = 0.9 = 90%
- 9. EX: A generation station has a maximum demand of 20 MW, a load factor of 60%, plant capacity factor of 48% and plant use factor of 80%. Find: 1. The daily energy produced 2. The reserve capacity 3. The number of operating hours per daily 4. The maximum energy that could be produced daily if the generation station was running all the time. Solution: 1) Find the daily energy produced Load Factor = Average Load Max. Load 0.6 = Average Load 20 MW ℎ Average Load = 0.6 × 20 MW = 12 MW Average Load = Area under the load curve (kWh) no. of hours (h) The time for daily energy produced is 24 h Area under the load curve = energy produced = 12 × 24 = 288 MWh
- 10. 2) Find the reserve capacity Plant Capacity Factor = Average Demand Installed Capacity Installed Capacity = Average Demand Plant Capacity Factor = 12 0.48 = 25 MW Reserve Capacity = Installed Capacity − Max. Demand Reserve Capacity = 25 − 20 = 5 MW 3) Find the number of operating hours per daily Plant Use Factor = Average Demand × T Installed Capacity × no.of operating hours 0.8 = 12 × 24 25 × no. of operating hours no. of operating hours = 12 × 24 25 × 0.8 = 14.4 h
- 11. 4) Find the maximum energy that could be produced daily if the generation station was running all the time. The maximum energy that could be produced daily = Installed Capacity × 24 = 25 × 24 = 600 MWh = 25 × 24 = 600 000 kWh EX: A generation station of 10MW supplied two regions (A and B) which have the following demands: Region A From To Demand (kW) midnight 9 am 600 9 am 12 noon 2500 12 noon 5 pm 800 5 pm 6 pm 5000 6 pm 7 pm No-load 7 pm midnight 4000 Region B From To Demand (kW) midnight 8 am 800 8 am 1 pm 5000 1 pm 2 pm 800 2 pm 5 pm 5000 5 pm midnight 800 Find the diversity factor.
- 12. Solution: Regions A+B From To Demand (kW) midnight 8 am 600+800=1400 8 am 9 am 600+5000=5600 9 am 12 noon 2500+5000=7500 12 noon 1 pm 800+5000=5800 1 pm 2 pm 800+800=1600 2 pm 5 pm 800+5000=5800 5 pm 6 pm 5000+800=5800 6 pm 7 pm 0+800=800 7 pm midnight 4000+800=4800 Max. Demand on power Plant = 7500 kW Diversity Factor = Sum of Individual Max. Demand (kW) Max. Demand on power Plant (kW) Diversity Factor = 5000 (kW) + 5000 (kW) 7500 (kW) = 1.333
- 13. HW1: for the previous example, find the following: 1) Draw the load curve and load duration curve for regions A and B and for the total loads 2) The average load and the load factor of the total system 3) The reserve capacity of the plant 4) Plant use factor 5) Utilization factor