SlideShare a Scribd company logo
1 of 133
related files/1208771704.pdf
Ten timeless tests can help you kick the tires
on your strategy and kick up the level of strategic
dialogue throughout your company.
Have you tested your
strategy lately?
‘What’s the next new thing in strategy?’ a senior executive
recently asked Phil Rosenzweig, a professor at IMD,1 in
Switzerland. His
response was surprising for someone whose career is devoted to
advancing the state of the art of strategy: “With all respect, I
think that’s
the wrong question. There’s always new stuff out there, and
most of
it’s not very good. Rather than looking for the next musing, it’s
probably
better to be thorough about what we know is true and make sure
we
do that well.”
Let’s face it: the basic principles that make for good strategy
often get
obscured. Sometimes the explanation is a quest for the next new
thing—
natural in a field that emerged through the steady accumulation
of
frameworks promising to unlock the secret of competitive
advantage.2
In other cases, the culprit is torrents of data, reams of analysis,
and
piles of documents that can be more distracting than
enlightening.
Ultimately, strategy is a way of thinking, not a procedural
exercise
or a set of frameworks. To stimulate that thinking and the
dialogue that
goes along with it, we developed a set of tests aimed at helping
exec-
utives assess the strength of their strategies. We focused on
testing the
strategy itself (in other words, the output of the strategy-
development
process), rather than the frameworks, tools, and approaches that
generate
Chris Bradley, Martin Hirt, and Sven Smit
1 International Institute for Management Development.
2 For a rich account of strategy’s birth and growth as a field,
see Walter Kiechel, The Lords of
Strategy, Boston, MA: Harvard Business School Press, 2010.
J A N U A R Y 2 0 1 1
s t r a t e g y p r a c t i c e
2Have you tested your strategy lately?
strategies, for two reasons. First, companies develop strategy in
many
different ways, often idiosyncratic to their organizations,
people, and markets. Second, many strategies emerge over time
rather
than from a process of deliberate formulation.3
There are ten tests on our list, and not all are created equal. The
first—
“will it beat the market?”—is comprehensive. The remaining
nine dis-
aggregate the picture of a market-beating strategy, though it’s
certainly
possible for a strategy to succeed without “passing” all nine of
them.
This list may sound more complicated than the three Cs or the
five forces
of strategy.4 But detailed pressure testing, in our experience,
helps
pinpoint more precisely where the strategy needs work, while
gener-
ating a deeper and more fruitful strategic dialogue.
Those conversations matter, but they often are loose and
disjointed.
We heard that, loud and clear, over the past two years in
workshops
where we explored our tests with more than 700 senior
strategists
around the world. Furthermore, a recent McKinsey Quarterly
survey
of 2,135 executives indicates that few strategies pass more than
three
3 For a classic statement of the idea that strategies are more
emergent than planned,
see Henry Mintzberg, “Crafting strategy,” Harvard Business
Review, 1987, July–August,
Volume 65, Number 4, pp. 66–75.
4 The three Cs and the five forces are seminal strategy
frameworks. The three Cs
(competitors, customers, and company) were articulated by
retired McKinsey partner
Kenichi Ohmae in The Mind of the Strategist (McGraw-Hill,
1982). The five forces
(barriers to entry, buyer power, supplier power, the threat of
substitutes, and the degree
of rivalry) were set forth by Harvard Business School professor
Michael Porter in
Competitive Strategy (Free Press, 1998).
Q1 2011
Ten timeless tests
Exhibit 1 of 2
Number of tests rated as fully consistent with company strategy,
% of respondents
3 or fewer
4–6
Source: 2010 McKinsey survey of 2,135 global executives on
testing business strategy
Most companies’ strategies pass fewer than four of the ten tests.
7–10
25
10
65
3 January 2011
of the tests. In contrast, the ref lections of a range of current
and former
strategy practitioners (see “How we do it: Strategic tests from
four
senior executives,” on mckinseyquarterly.com) suggest that the
tests
described here help formalize something that the best strategists
do
quite intuitively.
The tests of a good strategy are timeless in nature. But the
ability to
pressure-test a strategy is especially timely now. The financial
crisis of
2008 and the recession that followed made some strategies
obsolete,
revealed weaknesses in others, and forced many companies to
confront
choices and trade-offs they put off in boom years. At the same
time,
a shift toward shorter planning cycles and decentralized
strategic deci-
sion making are increasing the utility of a common set of tests.5
All
this makes today an ideal time to kick the tires on your strategy.
Will your strategy beat the market?
All companies operate in markets surrounded by customers,
suppliers,
competitors, substitutes, and potential entrants, all seeking to
advance
their own positions. That process, unimpeded, inexorably drives
eco-
nomic surplus—the gap between the return a company earns and
its
cost of capital—toward zero.
For a company to beat the market by capturing and retaining an
eco-
nomic surplus, there must be an imperfection that stops or at
least slows
the working of the market. An imperfection controlled by a
company
is a competitive advantage. These are by definition scarce and f
leeting
because markets drive reversion to mean performance. The best
com-
panies are emulated by those in the middle of the pack, and the
worst
exit or undergo significant reform. As each player responds to
and
learns from the actions of others, best practice becomes
commonplace
rather than a market-beating strategy. Good strategies
emphasize
difference—versus your direct competitors, versus potential
substitutes,
and versus potential entrants.
Market participants play out the drama of competition on a
stage beset
by randomness. Because the evolution of markets is path
dependent—
that is, its current state at any one time is the sum product of all
pre-
Test 1:
5 For more on strategy setting in today’s environment, see
Lowell Bryan, “Dynamic
management: Better decisions in uncertain times,”
mckinseyquarterly.com, December
2009; and “Navigating the new normal: A conversation with
four chief strategy officers,”
mckinseyquarterly.com, December 2009.
4Have you tested your strategy lately?
vious events, including a great many random ones—the winners
of today
are often the accidents of history. Consider the development of
the
US tire industry. At its peak in the mid-1920s, a frenzy of entry
had
created almost 300 competitors. Yet by the 1940s, four
producers con-
trolled more than 70 percent of the market. Those winners
happened
to make retrospectively lucky choices about location and
technology,
but at the time it was difficult to tell which companies were
truly fit
for the evolving environment. The histories of many other
industries,
from aerospace to information technology, show remarkably
simi-
lar patterns.
To beat the market, therefore, advantages have to be robust and
respon-
sive in the face of onrushing market forces. Few companies, in
our
experience, ask themselves if they are beating the market—the
pres-
sures of “just playing along” seem intense enough. But playing
along
can feel safer than it is. Weaker contenders win surprisingly
often in
war when they deploy a divergent strategy, and the same is true
in business.6
Q1 2011
10 Timeless tests
Exhibit 2 of 2
Performance cohorts based on position in 2001 relative to mean,
n = 7431
20
15
10
5
0
–5
–10
–15
2001 2003 2005 2007 2009 2001 2003 2005 2007 2009
3.5
3.0
2.5
2.0
1.5
1.0
0.5
0
–0.5
–1.0
–1.5
Return on invested
capital (ROIC), %
Ratio of enterprise value to
invested capital (EV/IC)
1 Sample of largest 1,200 nonfinancial US-listed companies in
2009 was narrowed to 743 that were also listed in 2001.
Source: Standard & Poor’s Compustat; McKinsey analysis
Markets drive a reversion to mean performance.
Top quintile
Middle quintile
Bottom quintile
6 See Ivan Arreguin-Toft, How the weak win wars: A theory of
asymmetric conflict,
Cambridge, UK: Cambridge University Press, 2005.
5 January 2011
Does your strategy tap a true source of
advantage?
Know your competitive advantage, and you’ve answered the
question
of why you make money (and vice versa). Competitive
advantage
stems from two sources of scarcity: positional advantages and
special
capabilities.
Positional advantages are rooted in structurally attractive
markets. By
definition, such advantages favor incumbents: they create an
asym-
metry between those inside and those outside high walls. For
example,
in Australia, two beer makers control 95 percent of the market
and
enjoy triple the margins of US brewers. This situation has
sustained
itself for two decades, but it wasn’t always so. Beginning in the
1980s,
the Australian industry experienced consolidation. That change
in struc-
ture was associated with a change in industry conduct (price
growth
began outstripping general inf lation) and a change in industry
perfor-
mance (higher profitability). Understanding the relationship
among
structure, conduct, and performance is a critical part of the
quest for
positional advantage.
Special capabilities, the second source of competitive
advantage, are
scarce resources whose possession confers unique benefits. The
most
obvious resources, such as drug patents or leases on mineral
deposits,
we call “privileged, tradable assets”: they can be bought and
sold. A
second category of special capabilities, “distinctive
competencies,” consists
of things a company does particularly well, such as innovating
or
managing stakeholders. These capabilities can be just as
powerful in
creating advantage but cannot be easily traded.
Too often, companies are cavalier about claiming special
capabilities.
Such a capability must be critical to a company’s prof its and
exist in
abundance within it while being scarce outside. As such, special
capabilities tend to be specific in nature and few in number.
Companies
often err here by mistaking size for scale advantage or
overestimating
their ability to leverage capabilities across markets. They infer
special
capabilities from observed performance, often without
considering
other explanations (such as luck or positional advantage).
Companies
should test any claimed capability advantage vigorously before
pin-
ning their hopes on it.
When companies bundle together activities that collectively
create
advantage, it becomes more difficult for competitors to identify
and
Test 2:
6Have you tested your strategy lately?
replicate its exact source. Consider Aldi, the highly successful
dis-
count grocery retailer. To deliver its value proposition of lower
prices,
Aldi has completely redesigned the typical business system of a
supermarket: only 1,500 or so products rather than 30,000, the
stock-
ing of one own-brand or private label rather than hundreds of
national brands, and superlean replenishment on pallets and
trolleys,
thus avoiding the expensive task of hand stacking shelves.
Given
the enormous changes necessary for any supermarket that
wishes to
copy the total system, it is extremely difficult to mimic Aldi’s
value
proposition.
Finally, don’t forget to take a dynamic view. What can erode
positional
advantage? Which special capabilities are becoming vulnerable?
There is every reason to believe that competitors will exploit
points of
vulnerability. Assume, like Lewis Carroll’s Red Queen, that you
have
to run just to stay in the same place.
Is your strategy granular about where to
compete?
The need to beat the market begs the question of which market.
Research shows that the unit of analysis used in determining
strategy
(essentially, the degree to which a market is segmented) signif
i-
cantly inf luences resource allocation and thus the likelihood of
success:
dividing the same businesses in different ways leads to
strikingly
different capital allocations.
What is the right level of granularity? Push within reason for
the finest
possible objective segmentation of the market: think 30 to 50
seg-
ments rather than the more typical 5 or so. Too often, by
contrast, the
business unit as defined by the organizational chart becomes the
default for defining markets, reducing from the start the
potential scope
of strategic thinking.
Defining and understanding these segments correctly is one of
the
most practical things a company can do to improve its strategy.
Manage-
ment at one large bank attributed fast growth and share gains to
measurably superior customer perceptions and satisfaction.
Examining
the bank’s markets at a more granular level suggested that 90
percent
of its outperformance could be attributed to a relatively high
exposure
to one fast-growing city and to a presence in a fast-growing
product
segment. This insight helped the bank avoid building its
strategy on
Test 3:
7 January 2011
false assumptions about what was and wasn’t working for the
operation
as a whole.
In fact, 80 percent of the variance in revenue growth is
explained
by choices about where to compete, according to research
summarized
in The Granularity of Growth, leaving only 20 percent explained
by
choices about how to compete. Unfortunately, this is the exact
opposite
of the allocation of time and effort in a typical strategy-
development
process. Companies should be shifting their attention greatly
toward
the “where” and should strive to outposition competitors by
regularly
reallocating resources as opportunities shift within and between
segments.
Does your strategy put you ahead of
trends?
The emergence of new trends is the norm. But many strategies
place
too much weight on the continuation of the status quo because
they
extrapolate from the past three to five years, a time frame too
brief to
capture the true violence of market forces.
A major innovation or an external shock in regulation, demand,
or technology, for example, can drive a rapid, full-scale
industry tran-
sition. But most trends emerge fairly slowly—so slowly that
com-
panies generally fail to respond until a trend hits profits. At this
point,
it is too late to mount a strategically effective response, let
alone
shape the change to your advantage. Managers typically delay
action,
held back by sunk costs, an unwillingness to cannibalize a
legacy
business, or an attachment to yesterday’s formula for success.
The
cost of delay is steep: consider the plight of major travel agency
chains slow to understand the power of online intermediaries.
Con-
versely, for companies that get ahead of the curve, major market
transitions are an opportunity to rethink their commitments in
areas
ranging from technology to distribution and to tailor their
strategies
to the new environment.
To do so, strategists must take trend analysis seriously. Always
look to
the edges. How are early adopters and that small cadre of
consumers
who seem to be ahead of the curve acting? What are small,
innovative
entrants doing? What technologies under development could
change
the game? To see which trends really matter, assess their
potential
Test 4:
8Have you tested your strategy lately?
impact on the financial position of your company and articulate
the
decisions you would make differently if that outcome were
certain. For
example, don’t just stop at an aging population as a trend—
work it
through to its conclusion. Which consumer behaviors would
change?
Which particular product lines would be affected? What would
be
the precise effect on the P&L? And how does that picture line
up with
today’s investment priorities?
Does your strategy rest on privileged
insights?
Data today can be cheap, accessible, and easily assembled into
detailed
analyses that leave executives with the comfortable feeling of
pos-
sessing an informed strategy. But much of this is noise and most
of it
is widely available to rivals. Furthermore, routinely analyzing
readily
available data diverts attention from where insight-creating
advantage
lies: in the weak signals buried in the noise.
In the 1990s, when the ability to burn music onto CDs emerged,
no one knew how digitization would play out; MP3s, peer-to-
peer file
sharing, and streaming Web-based media were not on the
horizon.
But one corporation with a large record label recognized more
rapidly
than others that the practical advantage of copyright protection
could quickly become diluted if consumers began copying
material.
Early recognition of that possibility allowed the CEO to sell the
business at a multiple based on everyone else’s assumption that
the status
quo was unthreatened.
Developing proprietary insights isn’t easy. In fact, this is the
element
of good strategy where most companies stumble (see sidebar,
“The
insight def icit”). A search for problems can help you get
started.
Create a short list of questions whose answers would have major
implications for the company’s strategy—for example, “What
will we
regret doing if the development of India hiccups or stalls, and
what
will we not regret?” In doing so, don’t forget to examine the
assump-
tions, explicit and implicit, behind an established business
model.
Do they still fit the current environment?
Another key is to collect new data through f ield observations or
research rather than to recycle the same industry reports
everyone else
uses. Similarly, seeking novel ways to analyze the data can
generate
Test 5:
9 January 2011
powerful new insights. For example, one supermarket chain we
know
recently rethought its store network strategy on the basis of
surprising
results from a new clustering algorithm.
Finally, many strategic breakthroughs have their root in a
simple but
profound customer insight (usually solving an old problem for
the
customer in a new way). In our experience, companies that go
out of
their way to experience the world from the customer’s
perspective
routinely develop better strategies.
Does your strategy embrace uncertainty?
A central challenge of strategy is that we have to make choices
now,
but the payoffs occur in a future environment we cannot fully
know or
control. A critical step in embracing uncertainty is to try to
charac-
terize exactly what variety of it you face—a surprisingly rare
activity at
many companies. Our work over the years has emphasized four
levels
of uncertainty. Level one offers a reasonably clear view of the
future:
a range of outcomes tight enough to support a firm decision. At
level
two, there are a number of identifiable outcomes for which a
company
should prepare. At level three, the possible outcomes are
represented
not by a set of points but by a range that can be understood as a
proba-
bility distribution. Level four features total ambiguity, where
even
the distribution of outcomes is unknown.
In our experience, companies oscillate between assuming,
simplis-
tically, that they are operating at level one (and making bold but
unjusti-
fied point forecasts) and succumbing to an unnecessarily
pessimistic
level-four paralysis. In each case, careful analysis of the
situation usually
redistributes the variables into the middle ground of levels two
and three.
Rigorously understanding the uncertainty you face starts with
listing
the variables that would inf luence a strategic decision and
prioritizing
them according to their impact. Focus early analysis on
removing
as much uncertainty as you can—by, for example, ruling out
impossible
outcomes and using the underlying economics at work to
highlight
outcomes that are either mutually reinforcing or unlikely
because they
would undermine one another in the market. Then apply tools
such
as scenario analysis to the remaining, irreducible uncertainty,
which
should be at the heart of your strategy.
Test 6:
10Have you tested your strategy lately?
Does your strategy balance commitment
and flexibility?
Commitment and f lexibility exist in inverse proportion to each
other:
the greater the commitment you make, the less f lexibility
remains.
This tension is one of the core challenges of strategy. Indeed,
strategy
can be expressed as making the right trade-offs over time
between
commitment and f lexibility.
Making such trade-offs effectively requires an understanding of
which
decisions involve commitment. Inside any large company,
hundreds
of people make thousands of decisions each year. Only a few
are strategic:
those that involve commitment through hard-to-reverse
investments
in long-lasting, company-specific assets. Commitment is the
only path
to sustainable competitive advantage.
In a world of uncertainty, strategy is about not just where and
how to
compete but also when. Committing too early can be a leap in
the
dark. Being too late is also dangerous, either because
opportunities are
perishable or rivals can seize advantage while your company
stands
on the sidelines. Flexibility is the essential ingredient that
allows com-
panies to make commitments when the risk/return trade-off
seems
most advantageous.
A market-beating strategy will focus on just a few crucial, high-
commitment choices to be made now, while leaving f lexibility
for other
such choices to be made over time. In practice, this approach
means
building your strategy as a portfolio comprising three things:
big bets,
or committed positions aimed at gaining signif icant
competitive
advantage; no-regrets moves, which will pay off whatever
happens; and
real options, or actions that involve relatively low costs now but
can
be elevated to a higher level of commitment as changing
conditions war-
rant. You can build underpriced options into a strategy by, for
exam-
ple, modularizing major capital projects or maintaining the f
lexibility to
switch between different inputs.
Test 7:
11 January 2011
Is your strategy contaminated by bias?
It’s possible to believe honestly that you have a market-beating
strat-
egy when, in fact, you don’t. Sometimes, that’s because forces
beyond
your control change. But in other cases, the cause is
unintentional
fuzzy thinking.
Behavioral economists have identified many characteristics of
the
brain that are often strengths in our broader, personal
environment
but that can work against us in the world of business decision
making.
The worst offenders include overoptimism (our tendency to
hope for
the best and believe too much in our own forecasts and
abilities),
anchoring (tying our valuation of something to an arbitrary
reference
point), loss aversion (putting too much emphasis on avoiding
down-
sides and so eschewing risks worth taking), the confirmation
bias (over-
weighting information that validates our opinions), herding
(taking
comfort in following the crowd), and the champion bias
(assigning to
an idea merit that’s based on the person proposing it).
Strategy is especially prone to faulty logic because it relies on
extrap-
olating ways to win in the future from a complex set of factors
observed today. This is fertile ground for two big inference
problems:
attribution error (succumbing to the “halo effect”) and
survivorship
bias (ignoring the “graveyard of silent failures”). Attribution
error is
the false attribution of success to observed factors; it is strategy
by
hindsight and assumes that replicating the actions of another
company
will lead to similar results. Survivorship bias refers to an
analysis
based on a surviving population, without consideration of those
who
did not live to tell their tale: this approach skews our view of
what
caused success and presents no insights into what might cause
failure—
were the survivors just luckier? Case studies have their place,
but
hindsight is in reality not 20/20. There are too many unseen
factors.
Developing multiple hypotheses and potential solutions to
choose
among is one way to “de-bias” decision making. Too often, the
typical
Test 8:
12Have you tested your strategy lately?
drill is to develop a promising hypothesis and put a lot of effort
into building a fact base to validate it. In contrast, it is critical
to bring
fresh eyes to the issues and to maintain a culture of challenge,
in
which the obligation to dissent is fostered.
The decision-making process can also be de-biased by, for
example,
specifying objective decision criteria in advance and examining
the
possibility of being wrong. Techniques such as the “premortem
assess-
ment” (imagining yourself in a future where your decision turns
out to
have been mistaken and identifying why that might have been
so)
can also be useful.
Is there conviction to act on your
strategy?
This test and the one that follows aren’t strictly about the
strategy itself
but about the investment you’ve made in implementing it—a
distinc-
tion that in our experience quickly becomes meaningless
because the
two, inevitably, become intertwined. Many good strategies fall
short
in implementation because of an absence of conviction in the
organi-
zation, particularly among the top team, where just one or two
non-
believers can strangle strategic change at birth.
Where a change of strategy is needed, that is usually because
changes
in the external environment have rendered obsolete the
assumptions
underlying a company’s earlier strategy. To move ahead with
imple-
mentation, you need a process that openly questions the old
assump-
tions and allows managers to develop a new set of beliefs in
tune
with the new situation. This goal is not likely to be achieved
just via
lengthy reports and presentations. Nor will the social processes
required to absorb new beliefs—group formation, building
shared
meaning, exposing and reconciling differences, aligning and
accept-
ing accountability—occur in formal meetings.
CEOs and boards should not be fooled by the warm glow they
feel after
a nice presentation by management. They must make sure that
the
whole team actually shares the new beliefs that support the
strategy.
This requirement means taking decision makers on a journey of
discovery by creating experiences that will help them viscerally
grasp
mismatches that may exist between what the new strategy
requires
and the actions and behavior that have brought them success for
many
Test 9:
13 January 2011
years. For example, visit plants and customers or tour a country
your
company plans to enter, so that the leadership team can
personally meet
crucial stakeholders. Mock-ups, video clips, and virtual
experiences
also can help.
The result of such an effort should be a support base of inf
luencers who
feel connected to the strategy and may even become evangelists
for
it. Because strategy often emanates from the top, and CEOs are
accus-
tomed to being heeded, this commonsense step often gets
overlooked,
to the great detriment of the strategy.
Have you translated your strategy into an
action plan?
In implementing any new strategy, it’s imperative to define
clearly
what you are moving from and where you are moving to with
respect
to your company’s business model, organization, and
capabilities.
Develop a detailed view of the shifts required to make the
move, and
ensure that processes and mechanisms, for which individual
exec-
utives must be accountable, are in place to effect the changes.
Quite
simply, this is an action plan. Everyone needs to know what to
do.
Be sure that each major “from–to shift” is matched with the
energy to
make it happen. And since the totality of the change often
repre-
sents a major organizational transformation, make sure you and
your
senior team are drawing on the large body of research and
experi-
ence offering solid advice on change management—a topic
beyond the
scope of this article!
Finally, don’t forget to make sure your ongoing resource
allocation pro-
cesses are aligned with your strategy. If you want to know what
it
actually is, look where the best people and the most generous
budgets
are—and be prepared to change these things significantly.
Effort
spent aligning the budget with the strategy will pay off many
times over.
As we’ve discussed the tests with hundreds of senior executives
at many
of the world’s largest companies, we’ve come away convinced
that a
lot of these topics are part of the strategic dialogue in
organizations. But
we’ve also heard time and again that discussion of such issues
is often,
as one executive in Japan recently told us, “random,
simultaneous, and
extremely confusing.” Our hope is that the tests will prove a
simple
and effective antidote: a means of quickly identifying gaps in
executives’
Test 10:
14Have you tested your strategy lately?
strategic thinking, opening their minds toward new ways of
using
strategy to create value, and improving the quality of the
strategy-
development process itself.
The authors wish to acknowledge the many contributions of
McKinsey
alumnus Nick Percy, now the head of strategy for BBC
Worldwide, to the
thinking behind this article.
Chris Bradley is a principal in McKinsey’s Sydney office,
Martin
Hirt is a director in the Taipei office, and Sven Smit is a
director in the
Amsterdam office.
The insight deficit
A fresh strategic insight—something
your company sees that no one
else does—is one of the foundations
of competitive advantage. It helps
companies focus their resources
on moves that separate them from
the pack. That makes the following
interesting: in a recent survey, only
35% of 2,135 global executives
believed their strategies rested on
unique and powerful insights. That
figure was dramatically lower than
the average—62 percent—for nine
other tests we asked executives to
measure their strategies against.
What’s more, only 14 percent
of surveyed executives placed
novel insights among the top
three strategic influencers of
financial performance. One likely
explanation: the widespread
availability of information and
adoption of sophisticated strategy
frameworks creates an impression
that “everyone knows what we know
and is probably analyzing the data
in the same ways that we are.” The
danger is obvious: if strategists
question their ability to generate
novel insights, they are less likely
to reach for the relative advantages
that are most likely to differentiate
them from competitors.
For the complete survey results,
see “Putting strategies to the test:
McKinsey Global Survey results,”
on mckinseyquarterly.com.
Copyright © 2011 McKinsey & Company. All rights reserved.
We welcome your comments on this article. Please send them to
[email protected]
related files/1349723555.pdf
McKinsey on Finance
Number 36,
Summer 2010
Perspectives on
Corporate Finance
and Strategy
Why Asia’s banks
underperform
at M&A
21
Five ways CFOs can
make cost cuts stick
25
The right way
to hedge
32
A singular moment
for merger value?
8
The five types
of successful
acquisitions
2
McKinsey
conversations with
global leaders:
David Rubenstein of
The Carlyle Group
10
2
There is no magic formula to make acquisitions
successful. Like any other business process, they
are not inherently good or bad, just as marketing
and R&D aren’t. Each deal must have its own
strategic logic. In our experience, acquirers in the
most successful deals have specific, well-
articulated value creation ideas going in. For less
successful deals, the strategic rationales—such as
pursuing international scale, filling portfolio gaps,
or building a third leg of the portfolio—tend to be
vague.
Empirical analysis of specific acquisition strategies
offers limited insight, largely because of the wide
variety of types and sizes of acquisitions and the
lack of an objective way to classify them by
strategy. What’s more, the stated strategy may not
Marc Goedhart,
Tim Koller,
and David Wessels
The five types of successful
acquisitions
even be the real one: companies typically talk up
all kinds of strategic benefits from acquisitions that
are really entirely about cost cutting. In the
absence of empirical research, our suggestions for
strategies that create value reflect our acquisitions
work with companies.
In our experience, the strategic rationale for an
acquisition that creates value typically conforms to
at least one of the following five archetypes:
improving the performance of the target company,
removing excess capacity from an industry,
creating market access for products, acquiring
skills or technologies more quickly or at lower cost
than they could be built in-house, and picking
winners early and helping them develop their
businesses. If an acquisition does not fit one or
Companies advance myriad strategies for creating value with
acquisitions—but only
a handful are likely to do so.
3
more of these archetypes, it’s unlikely to create
value. Executives, of course, often justify
acquisitions by choosing from a much broader
menu of strategies, including roll-ups,
consolidating to improve competitive behavior,
transformational mergers, and buying cheap.
While these strategies can create value, we find
that they seldom do. Value-minded executives
should view them with a gimlet eye.
Five archetypes
An acquisition’s strategic rationale should be a
specific articulation of one of these archetypes,
not a vague concept like growth or strategic
positioning, which may be important but must be
translated into something more tangible.
Furthermore, even if your acquisition is based on
one of the archetypes below, it won’t create value
if you overpay.
Improve the target company’s performance
Improving the performance of the target company
is one of the most common value-creating
acquisition strategies. Put simply, you buy a
company and radically reduce costs to improve
margins and cash flows. In some cases, the acquirer
may also take steps to accelerate revenue growth.
Pursuing this strategy is what the best private-
equity firms do. Among successful private-equity
acquisitions in which a target company was
bought, improved, and sold, with no additional
acquisitions along the way, operating-profit
margins increased by an average of about
2.5 percentage points more than those at peer
companies during the same period. This means
that many of the transactions increased
operating-profit margins even more.
Keep in mind that it is easier to improve the
performance of a company with low margins and
low returns on invested capital (ROIC) than that
of a high-margin, high-ROIC company. Consider a
target company with a 6 percent operating-profit
margin. Reducing costs by three percentage points,
to 91 percent of revenues, from 94 percent,
increases the margin to 9 percent and could lead to
a 50 percent increase in the company’s value. In
contrast, if the operating-profit margin of a
company is 30 percent, increasing its value by
50 percent requires increasing the margin to
45 percent. Costs would need to decline from
70 percent of revenues to 55 percent, a 21 percent
reduction in the cost base. That might not be
reasonable to expect.
Consolidate to remove excess capacity from
industry
As industries mature, they typically develop excess
capacity. In chemicals, for example, companies are
constantly looking for ways to get more production
out of their plants, while new competitors continue
to enter the industry. For example, Saudi Basic
Industries Corporation (SABIC), which began
production in the mid-1980s, grew from 6.3 million
metric tons of value-added commodities—such as
chemicals, polymers, and fertilizers—in 1985 to
56 million tons in 2008. Now one of the world’s
largest petrochemicals concerns, SABIC expects
continued growth, estimating its annual
production to reach 135 million tons by 2020.
The combination of higher production from
existing capacity and new capacity from recent
entrants often generates more supply than demand.
It is in no individual competitor’s interest to shut a
plant, however. Companies often find it easier to
shut plants across the larger combined entity
resulting from an acquisition than to shut their
least productive plants without one and end up
with a smaller company.
Reducing excess in an industry can also extend to
less tangible forms of capacity. Consolidation in
4 McKinsey on Finance Number 36, Summer 2010
the pharmaceutical industry, for example, has
significantly reduced the capacity of the sales force
as the product portfolios of merged companies
change and they rethink how to interact with
doctors. Pharmaceutical companies have also
significantly reduced their R&D capacity as they
found more productive ways to conduct research
and pruned their portfolios of development
projects.
While there is substantial value to be created from
removing excess capacity, as in most M&A activity
the bulk of the value often accrues to the seller’s
shareholders, not the buyer’s.
Accelerate market access for the target’s (or
buyer’s) products
Often, relatively small companies with innovative
products have difficulty reaching the entire
potential market for their products. Small
pharmaceutical companies, for example, typically
lack the large sales forces required to cultivate
relationships with the many doctors they need to
promote their products. Bigger pharmaceutical
companies sometimes purchase these smaller
companies and use their own large-scale sales
forces to accelerate the sales of the smaller
companies’ products.
IBM, for instance, has pursued this strategy in its
software business. From 2002 to 2009, it acquired
70 companies for about $14 billion. By pushing
their products through a global sales force, IBM
estimates it increased their revenues by almost
50 percent in the first two years after each
acquisition and an average of more than 10 percent
in the next three years.
In some cases, the target can also help accelerate
the acquirer’s revenue growth. In Procter &
Gamble’s acquisition of Gillette, the combined
company benefited because P&G had stronger
sales in some emerging markets, Gillette in others.
Working together, they introduced their products
into new markets much more quickly.
Get skills or technologies faster or at lower cost
than they can be built
Cisco Systems has used acquisitions to close gaps
in its technologies, allowing it to assemble a broad
line of networking products and to grow very
quickly from a company with a single product line
into the key player in Internet equipment. From
1993 to 2001, Cisco acquired 71 companies, at an
average price of approximately $350 million.
Cisco’s sales increased from $650 million in 1993
to $22 billion in 2001, with nearly 40 percent
of its 2001 revenue coming directly from these
acquisitions. By 2009, Cisco had more than
$36 billion in revenues and a market cap of
approximately $150 billion.
Pick winners early and help them develop their
businesses
The final winning strategy involves making
acquisitions early in the life cycle of a new industry
or product line, long before most others recognize
that it will grow significantly. Johnson & Johnson
pursued this strategy in its early acquisitions of
medical-device businesses. When J&J bought
device manufacturer Cordis, in 1996, Cordis had
$500 million in revenues. By 2007, its revenues
had increased to $3.8 billion, reflecting a 20 percent
annual growth rate. J&J purchased orthopedic-
device manufacturer DePuy in 1998, when DePuy
had $900 million in revenues. By 2007, they had
grown to $4.6 billion, also at an annual growth
rate of 20 percent.
This acquisition strategy requires a disciplined
approach by management in three dimensions.
First, you must be willing to make investments
early, long before your competitors and the market
see the industry’s or company’s potential. Second,
5The five types of successful acquisitions
you need to make multiple bets and to expect that
some will fail. Third, you need the skills and
patience to nurture the acquired businesses.
Harder strategies
Beyond the five main acquisition strategies we’ve
explored, a handful of others can create value,
though in our experience they do so relatively
rarely.
Roll-up strategy
Roll-up strategies consolidate highly fragmented
markets where the current competitors are too
small to achieve scale economies. Beginning in the
1960s, Service Corporation International, for
instance, grew from a single funeral home in
Houston to more than 1,400 funeral homes and
cemeteries in 2008. Similarly, Clear Channel
Communications rolled up the US market for radio
stations, eventually owning more than 900.
This strategy works when businesses as a group
can realize substantial cost savings or achieve
higher revenues than individual businesses can.
Service Corporation’s funeral homes in a given city
can share vehicles, purchasing, and back-office
operations, for example. They can also coordinate
advertising across a city to reduce costs and raise
revenues.
Size per se is not what creates a successful roll-up;
what matters is the right kind of size. For Service
Corporation, multiple locations in individual cities
have been more important than many branches
spread over many cities, because the cost savings
(such as sharing vehicles) can be realized only if
the branches are near one another. Roll-up
strategies are hard to disguise, so they invite
copycats. As others tried to imitate Service
Corporation’s strategy, prices for some funeral
homes were eventually bid up to levels that made
additional acquisitions uneconomic.
Consolidate to improve competitive behavior
Many executives in highly competitive industries
hope consolidation will lead competitors to focus
6 McKinsey on Finance Number 36, Summer 2010
less on price competition, thereby improving the
ROIC of the industry. The evidence shows, however,
that unless it consolidates to just three or four
companies and can keep out new entrants, pricing
behavior doesn’t change: smaller businesses or new
entrants often have an incentive to gain share
through lower prices. So in an industry with, say,
ten companies, lots of deals must be done before
the basis of competition changes.
Enter into a transformational merger
A commonly mentioned reason for an acquisition
or merger is the desire to transform one or both
companies. Transformational mergers are rare,
however, because the circumstances have to be just
right, and the management team needs to execute
the strategy well.
Transformational mergers can best be described by
example. One of the world’s leading
pharmaceutical companies, Switzerland’s Novartis,
was formed in 1996 by the $30 billion merger of
Ciba-Geigy and Sandoz. But this merger was much
more than a simple combination of businesses:
under the leadership of the new CEO, Daniel
Vasella, Ciba-Geigy and Sandoz were transformed
into an entirely new company. Using the merger as
a catalyst for change, Vasella and his management
team not only captured $1.4 billion in cost
synergies but also redefined the company’s
mission, strategy, portfolio, and organization, as
well as all key processes, from research to sales. In
every area, there was no automatic choice for either
the Ciba or the Sandoz way of doing things; instead,
the organization made a systematic effort to find
the best way.
Novartis shifted its strategic focus to innovation in
its life sciences business (pharmaceuticals,
nutrition, and products for agriculture) and spun
off the $7 billion Ciba Specialty Chemicals
business in 1997. Organizational changes included
structuring R&D worldwide by therapeutic rather
than geographic area, enabling Novartis to build a
world-leading oncology franchise.
Across all departments and management layers,
Novartis created a strong performance-oriented
culture supported by shifting from a seniority- to a
performance-based compensation system for
managers.
Buy cheap
The final way to create value from an acquisition is
to buy cheap—in other words, at a price below a
company’s intrinsic value. In our experience,
however, such opportunities are rare and relatively
small. Nonetheless, though market values revert to
intrinsic values over longer periods, there can be
brief moments when the two fall out of alignment.
Markets, for example, sometimes overreact to
negative news, such as a criminal investigation of
an executive or the failure of a single product in a
portfolio with many strong ones.
Such moments are less rare in cyclical industries,
where assets are often undervalued at the bottom
of a cycle. Comparing actual market valuations
with intrinsic values based on a “perfect foresight”
model, we found that companies in cyclical
industries could more than double their
shareholder returns (relative to actual returns) if
they acquired assets at the bottom of a cycle and
sold at the top.
While markets do throw up occasional
opportunities for companies to buy targets at levels
below their intrinsic value, we haven’t seen many
cases. To gain control of a target, acquirers must
pay its shareholders a premium over the current
market value. Although premiums can vary widely,
the average ones for corporate control have been
7The five types of successful acquisitions
fairly stable: almost 30 percent of the
preannouncement price of the target’s equity. For
targets pursued by multiple acquirers, the
premium rises dramatically, creating the so-called
winner’s curse. If several companies evaluate a
given target and all identify roughly the same
potential synergies, the pursuer that overestimates
them most will offer the highest price. Since it is
based on an overestimation of the value to be
created, the winner pays too much—and is
ultimately a loser.
Since market values can sometimes deviate from
intrinsic ones, management must also beware the
possibility that markets may be overvaluing a
potential acquisition. Consider the stock market
bubble during the late 1990s. Companies that
merged with or acquired technology, media, or
telecommunications businesses saw their share
prices plummet when the market reverted to
earlier levels. The possibility that a company might
pay too much when the market is inflated deserves
serious consideration, because M&A activity seems
to rise following periods of strong market
performance. If (and when) prices are artificially
high, large improvements are necessary to justify
an acquisition, even when the target can be
purchased at no premium to market value.
Premiums for private deals tend to be smaller,
although comprehensive evidence is difficult to
collect because publicly available data are scarce.
Private acquisitions often stem from the seller’s
desire to get out rather than the buyer’s desire
for a purchase.
By focusing on the types of acquisition strategies
that have created value for acquirers in the past,
managers can make it more likely that their
acquisitions will create value for their shareholders.
1 Viral V. Acharya, Moritz Hahn, and Conor Kehoe,
“Corporate
governance and value creation: Evidence from private equity,”
Social Science Research Network Working Paper, February 19,
2010.
2 IBM investor briefing, May 12, 2010
(www.ibm.com/investor/
events/investor0510/presentation/pres3.pdf).
3 Marco de Heer and Timothy M. Koller, “Valuing cyclical
companies,” mckinseyquarterly.com, May 2000.
4 Kevin Rock, “Why new issues are underpriced,” Journal of
Financial Economics, 1986, Volume 15, Number 1–2, pp. 187–
212.
Marc Goedhart ([email protected]) is a consultant in
McKinsey’s Amsterdam office, Tim Koller
([email protected]) is a partner in the New York office, and
David Wessels, an alumnus of the New York
office, is an adjunct professor of finance at the University of
Pennsylvania’s Wharton School. This article is excerpted
from Tim Koller, Marc Goedhart, and David Wessels,
Valuation: Measuring and Managing the Value of Companies
(fifth
edition, Hoboken, NJ: John Wiley & Sons, August 2010). Tim
Koller is also coauthor, with Richard Dobbs and Bill
Huyett, of a forthcoming managers’ guide to value creation,
titled Value: The Four Cornerstones of Corporate Finance
(Hoboken, NJ: John Wiley & Sons, October 2010). Copyright ©
2010 McKinsey & Company. All rights reserved.
related files/1472378321.pptx
Strategic Financial Analysis
MBA Module 5
1
Session 4
School of Business
1
2
Session 4
Readings and assignments
Have you tested your strategy lately?, McKinsey Quarterly,
January 2011 (Bradley, et al)
Why bad multiples happen to good companies, McKinsey
Quarterly, May 2012 (Foushee, et al)
Good Financial Analysts are Made, not Born and FP&A Peril:
Too Much Data, Too Little Judgment, CFO.com, 6/20/2012 and
4/23/2012, respectively
Pink, “The Truth About What Motivates Us, Aspen Ideas
Festival, July 29, 2010 (a podcast – over one hour)
PowerPoint deck in Bb (session 4)
Activities in class
Two merger paper presentations and “role teams” evaluate
Discuss readings
Goals
Bring closure to merger paper assignment
Answer any “open questions” on financial analysis and
valuation
Emphasize the importance of leadership in implementing a
financially well grounded new strategic direction
Answer any remaining questions about final paper and
spreadsheet submission details
School of Business
2
3
Merger Paper Presentations
Creditors
Activist
Investors
Investors
Employees
COO
CFO
CEO
Presenters
Use your paper to present your merger paper (no new .ppt
slides)
You have 15 minutes, including questions
Be sure to focus on the rationale of the acquisition, going
forward targets to ensure success, and risks (if you acquired
PSMT).
Role Teams
Evaluate the proposal from your perspective, specifically noting
the strength of the rationale, supporting data, and risk
identification.
What weaknesses do you see in the recommendation?
Of the two proposals, which is stronger and why? What would
you change about it before going to the BoD?
School of Business
3
Final Readings – Discussion
How Finance Dovetails with Strategy
4
School of Business
4
5
Bradley et al: Have you tested your strategy lately? *
Article Overview
What surprised you in this article?
Do you know your company’s strategy, and how many of the
tests does it pass?
Which of the “test” are the most difficult to evaluate and why?
Why do you think so few companies only “pass” four or fewer
tests?
Did any of the footnotes inspire you to read more on strategy?
If so, which readings?
* McKinsey Quarterly, January 2011
_____________________________________________________
__________________________________
_____________________________________________________
__________________________________
_____________________________________________________
__________________________________
_____________________________________________________
__________________________________
_____________________________________________________
__________________________________
School of Business
5
6
Nolen et al: Why bad multiples happen to good companies *
Article Overview
What are your three key take-a-ways from this article?
Why do you think the article was written?
Any surprises for you in this material?
What is “enterprise value”?
Did you think about NewCo’s revenue growth after you read
this article? What insight did you have?
* Mckinsey Quarterly, May 2012
_____________________________________________________
__________________________________
_____________________________________________________
__________________________________
_____________________________________________________
__________________________________
_____________________________________________________
__________________________________
_____________________________________________________
__________________________________
School of Business
6
7
McCann: Good Financial Analyst … & Too Much Data …*
Article Overview
What are your three key take-a-ways from these papers?
On a scale of one to 10, 10 being the best, rate yourself as a
financial analyst? Why did you give yourself this rating?
Do these insights extend beyond financial analysis? Why or
why not?
* CFO.com, June 20th and April 23rd, 2012
_____________________________________________________
__________________________________
_____________________________________________________
__________________________________
_____________________________________________________
__________________________________
School of Business
7
8
Daniel Pink: The Truth About What Motivates Us? *
Interesting points about the speech and speaking style
________________________________________________
________________________________________________
________________________________________________
________________________________________________
________________________________________________
________________________________________________
________________________________________________
* Aspen Institute, July 29, 2010; Podcast from Aspen Public
Radio – posted in Bb (it takes a while for the file to download
before it starts)
Insights on the scientific evidence of what motivates us
________________________________________________
________________________________________________
________________________________________________
________________________________________________
________________________________________________
________________________________________________
________________________________________________
What can motivation science say about financial management
________________________________________________
________________________________________________
________________________________________________
________________________________________________
________________________________________________
________________________________________________
________________________________________________
School of Business
8
Final Reminders
9
* Proofread before submitting your paper and spreadsheet on
Blackboard
Check for grammar – see “Examples of Poor Writing & How to
Correct Them”
Reread the rubric on your syllabus
Follow the detailed instructions we have covered three times
already
QUALITATIVE EVALUATION Paper (MS Word’s .doc or
.docx format only!)
Cover sheet with Hamline ID #
Executive Summary Page
Maximum three additional pages using suggested headings
Have you gone “beyond the numbers” to describe precisely how
value can be created (or destroyed) by putting COST & PSMT
together?
Reference page (minimum 5 references from this course)
QUANTITATIVE VALUATION Spreadsheet
Don’t forget to add your Hamline ID # to the Summary Tab
Don’t touch tabs 1 & 2 that we completed as a class
Change 4-5 variables on Combined New Company Inc. Stmt.
Do your changes from the weighted averages of COST
and PSMT continuing to operate separately reflect
the + or – synergies described in your paper?
On the Summary tab is your NPV reasonable?
Did you want to add a 5th tab? (DuPont analysis or WACC?)
School of Business
9
Final Reminders (continued)
10
Submit paper and spreadsheet by deadline = 10:00 PM this
Saturday night!
Complete Course Evaluation on Hamline’s Piperline
I’ll try to return your evaluated papers to you via e-mail by
evening, Tuesday July 28th; and I should have all course grades
posted on Piperline late that night.
Best wishes to all of you as you come down the “home stretch”
toward earning your MBA degree!
David Christopherson
School of Business
10
related files/1501597129.docx
Grading Rubric for Individual Paper (merger paper – 400
possible points)
Graded Elements &
Relative Weighting
(Share of 100%)
Does not Meet Expectations
Below 70%
Approaches Expectations
70% - 79%
Meets Expectations
80% - 89%
Exceeds Expectations
90% - 100%
Problem Formulation
20%
Problems, issues, opportunities, or questions are identified and
formulated comprehensively
Fails to identify and formulate the problems, issues,
opportunities, or questions
48 55
Recognizes one or more of the problems, but they are not stated
correctly in all cases; may be confused as to some key
information
56 63
Recognizes most of the problems and those seen are stated
clearly and correctly, but formulation(s) are not comprehensive
64 71
Clearly identifies and formulates problems or issues and
correctly summarizes implications and relationship among key
factors
72 80
Information and Assumptions
10%
Evidence, information quality and assumptions are evaluated
Fails to assess the quality of data, and supporting evidence;
does not identify key assumptions.
24 27
Available evidence is partially assessed but observations are
limited and inadequate for the purpose used; key assumptions
not explicitly stated
28 31
Available data and other evidence are reasonably assessed; and
observations are made upon the adequacy of that data; key
assumptions are stated, but their implications may not be noted
32 35
The evidence sources are validated and examined for relevancy
and completeness, and the information referenced is determined
to be suitable for use; key assumptions and the implications
related to their use are noted
36 40
Analytical Skill
30%
Quantitative and / or qualitative analysis undertaken for
problem solving (30)
Quantitative or qualitative analysis is inappropriate, inaccurate
or incomplete
72 43
Analysis is somewhat appropriate but elements fall-short or are
inaccurate, limiting its usefulness for decision-making
84 95
Analysis is mostly appropriate and is a reasonable beginning
that is likely to lead to useful decision-making
96 107
Analysis is appropriate, accurate and complete, and enables
good decision-making
108 120
Communication of Recommendations
25%
Communicates effectively well-reasoned, creative, useful, and
logical recommendations
No actions proposed and communication is limited and narrow;
and or with a high number of grammatical errors
60 69
Proposes solutions are expressed somewhat completely, but
communication falls short of being fully effective and
compelling and/or grammatically correct
70 79
Proposed solutions are expressed clearly and completely in the
whole, though supporting rationale may not be compelling
and/or some grammar mistakes present
80 89
Logical and reasoned recommendations or solutions are
advanced and communication is effective, grammatically
correct, and acknowledging both limitations and broader
implications
90 100
Alternatives Addressed
15%
Alternative perspectives incorporated in the analysis
Fails to recognize the perspective of others or that other
potential decisions that are possible
36 41
Begins to address the perspective of others and attempts to
address other decisions, but not comprehensively
42 47
Addresses the perspective of others and begins to address other
potential solutions, but is not compelling
48 53
Fully integrates alternative perspectives and decisions in the
analysis and justifies the actions proposed in relations to other
options
54 60
related files/1941091412.docx
Grading Rubric for Individual Paper (merger paper – 400
possible points)
Graded Elements &
Relative Weighting
(Share of 100%)
Does not Meet Expectations
Below 70%
Approaches Expectations
70% - 79%
Meets Expectations
80% - 89%
Exceeds Expectations
90% - 100%
Problem Formulation
20%
Problems, issues, opportunities, or questions are identified and
formulated comprehensively
Fails to identify and formulate the problems, issues,
opportunities, or questions
48 55
Recognizes one or more of the problems, but they are not stated
correctly in all cases; may be confused as to some key
information
56 63
Recognizes most of the problems and those seen are stated
clearly and correctly, but formulation(s) are not comprehensive
64 71
Clearly identifies and formulates problems or issues and
correctly summarizes implications and relationship among key
factors
72 80
Information and Assumptions
10%
Evidence, information quality and assumptions are evaluated
Fails to assess the quality of data, and supporting evidence;
does not identify key assumptions.
24 27
Available evidence is partially assessed but observations are
limited and inadequate for the purpose used; key assumptions
not explicitly stated
28 31
Available data and other evidence are reasonably assessed; and
observations are made upon the adequacy of that data; key
assumptions are stated, but their implications may not be noted
32 35
The evidence sources are validated and examined for relevancy
and completeness, and the information referenced is determined
to be suitable for use; key assumptions and the implications
related to their use are noted
36 40
Analytical Skill
30%
Quantitative and / or qualitative analysis undertaken for
problem solving (30)
Quantitative or qualitative analysis is inappropriate, inaccurate
or incomplete
72 43
Analysis is somewhat appropriate but elements fall-short or are
inaccurate, limiting its usefulness for decision-making
84 95
Analysis is mostly appropriate and is a reasonable beginning
that is likely to lead to useful decision-making
96 107
Analysis is appropriate, accurate and complete, and enables
good decision-making
108 120
Communication of Recommendations
25%
Communicates effectively well-reasoned, creative, useful, and
logical recommendations
No actions proposed and communication is limited and narrow;
and or with a high number of grammatical errors
60 69
Proposes solutions are expressed somewhat completely, but
communication falls short of being fully effective and
compelling and/or grammatically correct
70 79
Proposed solutions are expressed clearly and completely in the
whole, though supporting rationale may not be compelling
and/or some grammar mistakes present
80 89
Logical and reasoned recommendations or solutions are
advanced and communication is effective, grammatically
correct, and acknowledging both limitations and broader
implications
90 100
Alternatives Addressed
15%
Alternative perspectives incorporated in the analysis
Fails to recognize the perspective of others or that other
potential decisions that are possible
36 41
Begins to address the perspective of others and attempts to
address other decisions, but not comprehensively
42 47
Addresses the perspective of others and begins to address other
potential solutions, but is not compelling
48 53
Fully integrates alternative perspectives and decisions in the
analysis and justifies the actions proposed in relations to other
options
54 60
related files/202335146.xlsx
Costco ISAnnual Income Statement * To Be Finalized July 16
2015Divd. Growth Model CAPMSales
growth8.21%STUDENT ID #(Millions except for per
share)Divd. Yield1.11%rf2.35%Gross profit
margin12.60%gs5.99%Beta0.76SG&A % of
sales8.90%COSTCO WHOLESALE CORPSIC: 5399 (Misc.
General Mdse Stores)Mkt prem6.25% Tax rate35.00%999
Lake DriveGICS: 30101040 (Hypermarkets & Super
Centers)E(Ret)7.10%RRR7.10%Chg. NWC % of
sales0.50%Issaquah, WA 98027S&P Long-Term Issuer Credit
Rating: A+Equibrium CAPM=DGM Price$ 144.33
WACC6.95%Ticker: COSTS&P Short-Term Issuer Credit
Rating: Extremely Strong (A1)Market Price 7/16/2015$
144.33RADR (WACC + 10%)7.65%Depr. % of Sales0.91% Cap
Exp. % of Sales1.92%2009 Aug2010 Aug2011 Aug2012
Aug2013 Aug2014 AugCAGRAug-15Aug-16Aug-17Aug-
18Aug-19Aug-20Aug-21Aug-22Aug-232024
Aug2025Sales71,44977,94688,91599,137105,156112,6409.5%1
21,888131,895142,723154,441167,120180,841195,688211,7542
29,139247,951Cost of Goods
Sold61,60767,99577,73986,82391,94898,4589.8%106,530115,2
76124,740134,981146,063158,055171,031185,073200,268216,7
10Gross
Profit9,8429,95111,17612,31413,20814,1827.6%15,35816,6191
7,98319,46021,05722,78624,65726,68128,87231,242Selling,
General, & Administrative
Exp.7,3037,0797,8828,6479,2099,9336.3%10,84811,73912,7021
3,74514,87416,09517,41618,84620,39322,068Depreciation,
Depletion, &
Amortization7287958559089461,0297.2%1,1091,2001,2991,405
1,5211,6461,7811,9272,0852,256- 0Operating Profit
(EBIT)1,8112,0772,4392,7593,0533,22012.2%3,4013,6803,9824
,3094,6635,0455,4605,9086,3936,918Interest
Expense1161111169599113-0.5%Non-Operating Income /
Expense538860103979011.2%Special Items and
other72001700Pretax
Income1,7142,0542,3832,7503,0513,19713.3%Total Income
Taxes6287318411,0009901,10912.0%Less Non-Cont. Int.
Adj.02080412245Adjusted Net
Income1,0861,3031,4621,7092,0392,04313.5%EPS Basic from
Operations2.552.973.353.944.684.6913.0%EPS Diluted from
Operations2.522.923.303.894.634.6513.0%Dividends Per
Share0.680.770.891.031.101.331.60Com Shares for Basic
EPS433.988438.611436.119433.620435.741438.692Com Shares
for Diluted
EPS440.454445.970443.094439.373440.512442.490NOPAT2,21
02,3922,5882,8013,0313,2803,5493,8404,1554,497Depreciation
1,1091,2001,2991,4051,5211,6461,7811,9272,0852,256Change
in NWC46505459636974808794CAGR for FCFCap
Exp.2,3402,5322,7402,9653,2093,4723,7574,0664,3994,7618.21
%Free cash
flow9331,0101,0931,1821,2791,3841,4981,6211,7541,8982,054
2025 Terminal Value >>>>>>>124,220Discount
Factor0.9350.8740.8170.7640.7150.6680.6250.5840.5460.5110.
478Discounted CF872883893904914925936947958969Sum of
1-10 DCF's9,202Disc. Terminal Value59,320Sensitivity analysis
with WACC and growth ratesTotal of all DCF's68,523Less
Debt4,929Intrinsic Equity Val.63,594DCF/Share144.36
PSMT ISAnnual Income Statement * To Be Finalized July 16
2015Divd. Growth Model CAPMSales
growth13.00%STUDENT ID #(Millions except for per
share)Divd. Yield0.70%rf2.35%Gross profit
margin17.00%gs10.59%Beta1.43SG&A % of
sales8.450%PRICESMART INC.Mkt prem6.25% Tax
rate32.75%9740 Scranton RoadE(Ret)11.29%RRR11.29%NWC
% of sales1.00%San Diego, CA 92121Equibrium CAPM=DGM
Price$ 100.61 WACC10.76%Ticker: PSMTMarket Price
7/16/2015$ 100.61RADR (WACC + 10%)11.84%Fiscal Year:
8Depr. % Sales1.35%Cap. Ex. % Sales1.40%2009 Aug2010
Aug2011 Aug2012 Aug2013 Aug2014 AugCAGRAug-15Aug-
16Aug-17Aug-18Aug-19Aug-20Aug-21Aug-22Aug-232024
Aug2025Sales1,2521,3961,7142,0512,3002,51810.4%2,8453,21
53,6334,1064,6395,2425,9246,6947,5648,548Cost of Goods
Sold1,0341,1601,4311,7191,9292,11410.7%2,3622,6693,0163,4
083,8514,3514,9175,5566,2787,094Gross
Profit2172362833323714048.8%4845476186987898911,0071,13
81,2861,453Selling, General, & Administrative
Exp.1321461742002182388.7%240272307347392443501566639
722Depreciation, Depletion, &
Amortization14151924242811.5%38495563718090102115Opera
ting Profit
(EBIT)7275901081291388.5%2052752622963343774274825456
15Interest Expense334644Non-Operating Income /
Expense000020Special Items and other003100Pretax
Income687289103123134Total Income
Taxes192327353941(Adjustments)200000Adjusted Net
Income474962688493EPS Basic from
Operations1.461.662.002.242.783.07EPS Diluted from
Operations1.451.652.002.242.783.07Dividends Per
Share0.500.500.600.600.600.600.70Com Shares for Basic
EPS28.95929.25429.44129.55429.6529.75Com Shares for
Diluted
EPS29.18129.27929.45029.56629.6829.76NOPAT13818517619
9225254287324366414Depreciation380495563718090102115Ch
ange in NWC34455678910CAGR for FCFCap
Exp.404551576573839410612013.00%Free cash
flow133136170192217245277313354400452 2025
Terminal Value >>>>>>>5,416Discount
Factor0.9030.8150.7360.6640.6000.5420.4890.4420.3990.3600.
325Discounted CF120111125128130133135138141144Sum of
1-10 DCF's1,305Disc. Terminal Value1,760Sensitivity analysis
with WACC and growth ratesTotal of all DCF's3,065Less
Debt90Intrinsic Equity Val.2,975DCF/Share100.63
Combined ISCombined Pro Forma Income Statement -
Projections Assuming Costco Acquires
PriceSmartAssumptions:Sales growth8.42%Gs6.0835% Fill in
your 10 assumptions about positive or negative Gross profit
margin12.80% synergy by changing any of the cells shaded in
blue to the left.SG&A % of sales8.88%Weights<<<<====Tax
rate34.90%0.95531COSTNWC % of
sales0.52%0.04469PSMTWACC7.12%RADR (WACC +
10%)7.83%Depr. % Sales0.93%Cap. Ex. % Sales1.90%Aug-
15Aug-16Aug-17Aug-18Aug-19Aug-20Aug-21Aug-22Aug-
232024
AugCAGR2025Sales124,733135,241146,633158,986172,379186
,900202,645219,716238,225258,2938.42%Cost of Goods
Sold108,771117,934127,869138,641150,320162,983176,713191
,600207,740225,2418.42%Gross
Profit15,96217,30618,76420,34522,05923,91725,93228,11630,4
8533,0538.42%Selling, General, & Administrative
Exp.11,07612,00913,02114,11815,30716,59717,99519,51121,15
422,9368.42%Depreciation, Depletion, &
Amortization1,1601,2571,3631,4781,6031,7381,8842,0432,2152
,4018.42%Operating Profit
(EBIT)3,7264,0404,3804,7495,1495,5836,0536,5637,1167,7158.
42%NOPAT2,4262,6302,8513,0923,3523,6343,9414,2734,6335,
0238.42%Depreciation1,1601,2571,3631,4781,6031,7381,8842,
0432,2152,4018.42%Change in
NWC9255606570768289971051.52%CapEx2,3662,5652,7813,0
163,2703,5453,8444,1674,5194,8998.42%Free cash
flow1,1281,2671,3741,4901,6151,7511,8992,0592,2322,4208.85
%2,634119,559Discount
factor0.9340.8710.8140.7590.7090.6620.6180.5770.5380.503Di
scounted
CF1,0531,1041,1181,1311,1451,1591,1731,1871,2021,216Sum
of DCF yrs 1-10)11,489DCF of terminal perp.60,099Total of all
DCFs71,588 Less Debt5,019Intrinsic Equity Value66,569DCF
per share 150.4414107145Total Shares442.490costco is 19
times bigger than coscto
SummaryPresent value of Costco (PV-C)63,594July 16
2015STUDENT ID #NOTE: All numbers in millions of
USD.Present value of Pricesmart (PV-P)2,975PV of C and P
alone66,569 Baseline value to exceed separatePresent value of
C & P Combined (PV-C&P)66,569 Synergies included here
(revenue, costs, efficiency, etc.)togetherGain in value with
synergies-0 % gain-0.0%Cash to be paid for PriceSmart3,868
Premium = 30% (if PV = market value) (change if you
like)Premium Cost (cash paid - PV-PS)893Overall NPV (+
gain or - loss)(893)
Sheet1
related files/243990533.xlsx
Costco ISAnnual Income Statement * To Be Finalized July 16
2015Divd. Growth Model CAPMSales
growth8.21%STUDENT ID #(Millions except for per
share)Divd. Yield1.11%rf2.35%Gross profit
margin12.60%gs5.99%Beta0.76SG&A % of
sales8.90%COSTCO WHOLESALE CORPSIC: 5399 (Misc.
General Mdse Stores)Mkt prem6.25% Tax rate35.00%999
Lake DriveGICS: 30101040 (Hypermarkets & Super
Centers)E(Ret)7.10%RRR7.10%Chg. NWC % of
sales0.50%Issaquah, WA 98027S&P Long-Term Issuer Credit
Rating: A+Equibrium CAPM=DGM Price$ 144.33
WACC6.95%Ticker: COSTS&P Short-Term Issuer Credit
Rating: Extremely Strong (A1)Market Price 7/16/2015$
144.33RADR (WACC + 10%)7.65%Depr. % of Sales0.91% Cap
Exp. % of Sales1.92%2009 Aug2010 Aug2011 Aug2012
Aug2013 Aug2014 AugCAGRAug-15Aug-16Aug-17Aug-
18Aug-19Aug-20Aug-21Aug-22Aug-232024
Aug2025Sales71,44977,94688,91599,137105,156112,6409.5%1
21,888131,895142,723154,441167,120180,841195,688211,7542
29,139247,951Cost of Goods
Sold61,60767,99577,73986,82391,94898,4589.8%106,530115,2
76124,740134,981146,063158,055171,031185,073200,268216,7
10Gross
Profit9,8429,95111,17612,31413,20814,1827.6%15,35816,6191
7,98319,46021,05722,78624,65726,68128,87231,242Selling,
General, & Administrative
Exp.7,3037,0797,8828,6479,2099,9336.3%10,84811,73912,7021
3,74514,87416,09517,41618,84620,39322,068Depreciation,
Depletion, &
Amortization7287958559089461,0297.2%1,1091,2001,2991,405
1,5211,6461,7811,9272,0852,256- 0Operating Profit
(EBIT)1,8112,0772,4392,7593,0533,22012.2%3,4013,6803,9824
,3094,6635,0455,4605,9086,3936,918Interest
Expense1161111169599113-0.5%Non-Operating Income /
Expense538860103979011.2%Special Items and
other72001700Pretax
Income1,7142,0542,3832,7503,0513,19713.3%Total Income
Taxes6287318411,0009901,10912.0%Less Non-Cont. Int.
Adj.02080412245Adjusted Net
Income1,0861,3031,4621,7092,0392,04313.5%EPS Basic from
Operations2.552.973.353.944.684.6913.0%EPS Diluted from
Operations2.522.923.303.894.634.6513.0%Dividends Per
Share0.680.770.891.031.101.331.60Com Shares for Basic
EPS433.988438.611436.119433.620435.741438.692Com Shares
for Diluted
EPS440.454445.970443.094439.373440.512442.490NOPAT2,21
02,3922,5882,8013,0313,2803,5493,8404,1554,497Depreciation
1,1091,2001,2991,4051,5211,6461,7811,9272,0852,256Change
in NWC46505459636974808794CAGR for FCFCap
Exp.2,3402,5322,7402,9653,2093,4723,7574,0664,3994,7618.21
%Free cash
flow9331,0101,0931,1821,2791,3841,4981,6211,7541,8982,054
2025 Terminal Value >>>>>>>124,220Discount
Factor0.9350.8740.8170.7640.7150.6680.6250.5840.5460.5110.
478Discounted CF872883893904914925936947958969Sum of
1-10 DCF's9,202Disc. Terminal Value59,320Sensitivity analysis
with WACC and growth ratesTotal of all DCF's68,523Less
Debt4,929Intrinsic Equity Val.63,594DCF/Share144.36
PSMT ISAnnual Income Statement * To Be Finalized July 16
2015Divd. Growth Model CAPMSales
growth13.00%STUDENT ID #(Millions except for per
share)Divd. Yield0.70%rf2.35%Gross profit
margin17.00%gs10.59%Beta1.43SG&A % of
sales8.450%PRICESMART INC.Mkt prem6.25% Tax
rate32.75%9740 Scranton RoadE(Ret)11.29%RRR11.29%NWC
% of sales1.00%San Diego, CA 92121Equibrium CAPM=DGM
Price$ 100.61 WACC10.76%Ticker: PSMTMarket Price
7/16/2015$ 100.61RADR (WACC + 10%)11.84%Fiscal Year:
8Depr. % Sales1.35%Cap. Ex. % Sales1.40%2009 Aug2010
Aug2011 Aug2012 Aug2013 Aug2014 AugCAGRAug-15Aug-
16Aug-17Aug-18Aug-19Aug-20Aug-21Aug-22Aug-232024
Aug2025Sales1,2521,3961,7142,0512,3002,51810.4%2,8453,21
53,6334,1064,6395,2425,9246,6947,5648,548Cost of Goods
Sold1,0341,1601,4311,7191,9292,11410.7%2,3622,6693,0163,4
083,8514,3514,9175,5566,2787,094Gross
Profit2172362833323714048.8%4845476186987898911,0071,13
81,2861,453Selling, General, & Administrative
Exp.1321461742002182388.7%240272307347392443501566639
722Depreciation, Depletion, &
Amortization14151924242811.5%38495563718090102115Opera
ting Profit
(EBIT)7275901081291388.5%2052752622963343774274825456
15Interest Expense334644Non-Operating Income /
Expense000020Special Items and other003100Pretax
Income687289103123134Total Income
Taxes192327353941(Adjustments)200000Adjusted Net
Income474962688493EPS Basic from
Operations1.461.662.002.242.783.07EPS Diluted from
Operations1.451.652.002.242.783.07Dividends Per
Share0.500.500.600.600.600.600.70Com Shares for Basic
EPS28.95929.25429.44129.55429.6529.75Com Shares for
Diluted
EPS29.18129.27929.45029.56629.6829.76NOPAT13818517619
9225254287324366414Depreciation380495563718090102115Ch
ange in NWC34455678910CAGR for FCFCap
Exp.404551576573839410612013.00%Free cash
flow133136170192217245277313354400452 2025
Terminal Value >>>>>>>5,416Discount
Factor0.9030.8150.7360.6640.6000.5420.4890.4420.3990.3600.
325Discounted CF120111125128130133135138141144Sum of
1-10 DCF's1,305Disc. Terminal Value1,760Sensitivity analysis
with WACC and growth ratesTotal of all DCF's3,065Less
Debt90Intrinsic Equity Val.2,975DCF/Share100.63
Combined ISCombined Pro Forma Income Statement -
Projections Assuming Costco Acquires
PriceSmartAssumptions:Sales growth8.42%Gs6.0835% Fill in
your 10 assumptions about positive or negative Gross profit
margin12.80% synergy by changing any of the cells shaded in
blue to the left.SG&A % of sales8.88%Weights<<<<====Tax
rate34.90%0.95531COSTNWC % of
sales0.52%0.04469PSMTWACC7.12%RADR (WACC +
10%)7.83%Depr. % Sales0.93%Cap. Ex. % Sales1.90%Aug-
15Aug-16Aug-17Aug-18Aug-19Aug-20Aug-21Aug-22Aug-
232024
AugCAGR2025Sales124,733135,241146,633158,986172,379186
,900202,645219,716238,225258,2938.42%Cost of Goods
Sold108,771117,934127,869138,641150,320162,983176,713191
,600207,740225,2418.42%Gross
Profit15,96217,30618,76420,34522,05923,91725,93228,11630,4
8533,0538.42%Selling, General, & Administrative
Exp.11,07612,00913,02114,11815,30716,59717,99519,51121,15
422,9368.42%Depreciation, Depletion, &
Amortization1,1601,2571,3631,4781,6031,7381,8842,0432,2152
,4018.42%Operating Profit
(EBIT)3,7264,0404,3804,7495,1495,5836,0536,5637,1167,7158.
42%NOPAT2,4262,6302,8513,0923,3523,6343,9414,2734,6335,
0238.42%Depreciation1,1601,2571,3631,4781,6031,7381,8842,
0432,2152,4018.42%Change in
NWC9255606570768289971051.52%CapEx2,3662,5652,7813,0
163,2703,5453,8444,1674,5194,8998.42%Free cash
flow1,1281,2671,3741,4901,6151,7511,8992,0592,2322,4208.85
%2,634119,559Discount
factor0.9340.8710.8140.7590.7090.6620.6180.5770.5380.503Di
scounted
CF1,0531,1041,1181,1311,1451,1591,1731,1871,2021,216Sum
of DCF yrs 1-10)11,489DCF of terminal perp.60,099Total of all
DCFs71,588 Less Debt5,019Intrinsic Equity Value66,569DCF
per share 150.4414107145Total Shares442.490costco is 19
times bigger than coscto
SummaryPresent value of Costco (PV-C)63,594July 16
2015STUDENT ID #NOTE: All numbers in millions of
USD.Present value of Pricesmart (PV-P)2,975PV of C and P
alone66,569 Baseline value to exceed separatePresent value of
C & P Combined (PV-C&P)66,569 Synergies included here
(revenue, costs, efficiency, etc.)togetherGain in value with
synergies-0 % gain-0.0%Cash to be paid for PriceSmart3,868
Premium = 30% (if PV = market value) (change if you
like)Premium Cost (cash paid - PV-PS)893Overall NPV (+
gain or - loss)(893)
Sheet1
related files/469290633.pdf
McKinsey on Finance
Number 36,
Summer 2010
Perspectives on
Corporate Finance
and Strategy
Why Asia’s banks
underperform
at M&A
21
Five ways CFOs can
make cost cuts stick
25
The right way
to hedge
32
A singular moment
for merger value?
8
The five types
of successful
acquisitions
2
McKinsey
conversations with
global leaders:
David Rubenstein of
The Carlyle Group
10
2
There is no magic formula to make acquisitions
successful. Like any other business process, they
are not inherently good or bad, just as marketing
and R&D aren’t. Each deal must have its own
strategic logic. In our experience, acquirers in the
most successful deals have specific, well-
articulated value creation ideas going in. For less
successful deals, the strategic rationales—such as
pursuing international scale, filling portfolio gaps,
or building a third leg of the portfolio—tend to be
vague.
Empirical analysis of specific acquisition strategies
offers limited insight, largely because of the wide
variety of types and sizes of acquisitions and the
lack of an objective way to classify them by
strategy. What’s more, the stated strategy may not
Marc Goedhart,
Tim Koller,
and David Wessels
The five types of successful
acquisitions
even be the real one: companies typically talk up
all kinds of strategic benefits from acquisitions that
are really entirely about cost cutting. In the
absence of empirical research, our suggestions for
strategies that create value reflect our acquisitions
work with companies.
In our experience, the strategic rationale for an
acquisition that creates value typically conforms to
at least one of the following five archetypes:
improving the performance of the target company,
removing excess capacity from an industry,
creating market access for products, acquiring
skills or technologies more quickly or at lower cost
than they could be built in-house, and picking
winners early and helping them develop their
businesses. If an acquisition does not fit one or
Companies advance myriad strategies for creating value with
acquisitions—but only
a handful are likely to do so.
3
more of these archetypes, it’s unlikely to create
value. Executives, of course, often justify
acquisitions by choosing from a much broader
menu of strategies, including roll-ups,
consolidating to improve competitive behavior,
transformational mergers, and buying cheap.
While these strategies can create value, we find
that they seldom do. Value-minded executives
should view them with a gimlet eye.
Five archetypes
An acquisition’s strategic rationale should be a
specific articulation of one of these archetypes,
not a vague concept like growth or strategic
positioning, which may be important but must be
translated into something more tangible.
Furthermore, even if your acquisition is based on
one of the archetypes below, it won’t create value
if you overpay.
Improve the target company’s performance
Improving the performance of the target company
is one of the most common value-creating
acquisition strategies. Put simply, you buy a
company and radically reduce costs to improve
margins and cash flows. In some cases, the acquirer
may also take steps to accelerate revenue growth.
Pursuing this strategy is what the best private-
equity firms do. Among successful private-equity
acquisitions in which a target company was
bought, improved, and sold, with no additional
acquisitions along the way, operating-profit
margins increased by an average of about
2.5 percentage points more than those at peer
companies during the same period. This means
that many of the transactions increased
operating-profit margins even more.
Keep in mind that it is easier to improve the
performance of a company with low margins and
low returns on invested capital (ROIC) than that
of a high-margin, high-ROIC company. Consider a
target company with a 6 percent operating-profit
margin. Reducing costs by three percentage points,
to 91 percent of revenues, from 94 percent,
increases the margin to 9 percent and could lead to
a 50 percent increase in the company’s value. In
contrast, if the operating-profit margin of a
company is 30 percent, increasing its value by
50 percent requires increasing the margin to
45 percent. Costs would need to decline from
70 percent of revenues to 55 percent, a 21 percent
reduction in the cost base. That might not be
reasonable to expect.
Consolidate to remove excess capacity from
industry
As industries mature, they typically develop excess
capacity. In chemicals, for example, companies are
constantly looking for ways to get more production
out of their plants, while new competitors continue
to enter the industry. For example, Saudi Basic
Industries Corporation (SABIC), which began
production in the mid-1980s, grew from 6.3 million
metric tons of value-added commodities—such as
chemicals, polymers, and fertilizers—in 1985 to
56 million tons in 2008. Now one of the world’s
largest petrochemicals concerns, SABIC expects
continued growth, estimating its annual
production to reach 135 million tons by 2020.
The combination of higher production from
existing capacity and new capacity from recent
entrants often generates more supply than demand.
It is in no individual competitor’s interest to shut a
plant, however. Companies often find it easier to
shut plants across the larger combined entity
resulting from an acquisition than to shut their
least productive plants without one and end up
with a smaller company.
Reducing excess in an industry can also extend to
less tangible forms of capacity. Consolidation in
4 McKinsey on Finance Number 36, Summer 2010
the pharmaceutical industry, for example, has
significantly reduced the capacity of the sales force
as the product portfolios of merged companies
change and they rethink how to interact with
doctors. Pharmaceutical companies have also
significantly reduced their R&D capacity as they
found more productive ways to conduct research
and pruned their portfolios of development
projects.
While there is substantial value to be created from
removing excess capacity, as in most M&A activity
the bulk of the value often accrues to the seller’s
shareholders, not the buyer’s.
Accelerate market access for the target’s (or
buyer’s) products
Often, relatively small companies with innovative
products have difficulty reaching the entire
potential market for their products. Small
pharmaceutical companies, for example, typically
lack the large sales forces required to cultivate
relationships with the many doctors they need to
promote their products. Bigger pharmaceutical
companies sometimes purchase these smaller
companies and use their own large-scale sales
forces to accelerate the sales of the smaller
companies’ products.
IBM, for instance, has pursued this strategy in its
software business. From 2002 to 2009, it acquired
70 companies for about $14 billion. By pushing
their products through a global sales force, IBM
estimates it increased their revenues by almost
50 percent in the first two years after each
acquisition and an average of more than 10 percent
in the next three years.
In some cases, the target can also help accelerate
the acquirer’s revenue growth. In Procter &
Gamble’s acquisition of Gillette, the combined
company benefited because P&G had stronger
sales in some emerging markets, Gillette in others.
Working together, they introduced their products
into new markets much more quickly.
Get skills or technologies faster or at lower cost
than they can be built
Cisco Systems has used acquisitions to close gaps
in its technologies, allowing it to assemble a broad
line of networking products and to grow very
quickly from a company with a single product line
into the key player in Internet equipment. From
1993 to 2001, Cisco acquired 71 companies, at an
average price of approximately $350 million.
Cisco’s sales increased from $650 million in 1993
to $22 billion in 2001, with nearly 40 percent
of its 2001 revenue coming directly from these
acquisitions. By 2009, Cisco had more than
$36 billion in revenues and a market cap of
approximately $150 billion.
Pick winners early and help them develop their
businesses
The final winning strategy involves making
acquisitions early in the life cycle of a new industry
or product line, long before most others recognize
that it will grow significantly. Johnson & Johnson
pursued this strategy in its early acquisitions of
medical-device businesses. When J&J bought
device manufacturer Cordis, in 1996, Cordis had
$500 million in revenues. By 2007, its revenues
had increased to $3.8 billion, reflecting a 20 percent
annual growth rate. J&J purchased orthopedic-
device manufacturer DePuy in 1998, when DePuy
had $900 million in revenues. By 2007, they had
grown to $4.6 billion, also at an annual growth
rate of 20 percent.
This acquisition strategy requires a disciplined
approach by management in three dimensions.
First, you must be willing to make investments
early, long before your competitors and the market
see the industry’s or company’s potential. Second,
5The five types of successful acquisitions
you need to make multiple bets and to expect that
some will fail. Third, you need the skills and
patience to nurture the acquired businesses.
Harder strategies
Beyond the five main acquisition strategies we’ve
explored, a handful of others can create value,
though in our experience they do so relatively
rarely.
Roll-up strategy
Roll-up strategies consolidate highly fragmented
markets where the current competitors are too
small to achieve scale economies. Beginning in the
1960s, Service Corporation International, for
instance, grew from a single funeral home in
Houston to more than 1,400 funeral homes and
cemeteries in 2008. Similarly, Clear Channel
Communications rolled up the US market for radio
stations, eventually owning more than 900.
This strategy works when businesses as a group
can realize substantial cost savings or achieve
higher revenues than individual businesses can.
Service Corporation’s funeral homes in a given city
can share vehicles, purchasing, and back-office
operations, for example. They can also coordinate
advertising across a city to reduce costs and raise
revenues.
Size per se is not what creates a successful roll-up;
what matters is the right kind of size. For Service
Corporation, multiple locations in individual cities
have been more important than many branches
spread over many cities, because the cost savings
(such as sharing vehicles) can be realized only if
the branches are near one another. Roll-up
strategies are hard to disguise, so they invite
copycats. As others tried to imitate Service
Corporation’s strategy, prices for some funeral
homes were eventually bid up to levels that made
additional acquisitions uneconomic.
Consolidate to improve competitive behavior
Many executives in highly competitive industries
hope consolidation will lead competitors to focus
6 McKinsey on Finance Number 36, Summer 2010
less on price competition, thereby improving the
ROIC of the industry. The evidence shows, however,
that unless it consolidates to just three or four
companies and can keep out new entrants, pricing
behavior doesn’t change: smaller businesses or new
entrants often have an incentive to gain share
through lower prices. So in an industry with, say,
ten companies, lots of deals must be done before
the basis of competition changes.
Enter into a transformational merger
A commonly mentioned reason for an acquisition
or merger is the desire to transform one or both
companies. Transformational mergers are rare,
however, because the circumstances have to be just
right, and the management team needs to execute
the strategy well.
Transformational mergers can best be described by
example. One of the world’s leading
pharmaceutical companies, Switzerland’s Novartis,
was formed in 1996 by the $30 billion merger of
Ciba-Geigy and Sandoz. But this merger was much
more than a simple combination of businesses:
under the leadership of the new CEO, Daniel
Vasella, Ciba-Geigy and Sandoz were transformed
into an entirely new company. Using the merger as
a catalyst for change, Vasella and his management
team not only captured $1.4 billion in cost
synergies but also redefined the company’s
mission, strategy, portfolio, and organization, as
well as all key processes, from research to sales. In
every area, there was no automatic choice for either
the Ciba or the Sandoz way of doing things; instead,
the organization made a systematic effort to find
the best way.
Novartis shifted its strategic focus to innovation in
its life sciences business (pharmaceuticals,
nutrition, and products for agriculture) and spun
off the $7 billion Ciba Specialty Chemicals
business in 1997. Organizational changes included
structuring R&D worldwide by therapeutic rather
than geographic area, enabling Novartis to build a
world-leading oncology franchise.
Across all departments and management layers,
Novartis created a strong performance-oriented
culture supported by shifting from a seniority- to a
performance-based compensation system for
managers.
Buy cheap
The final way to create value from an acquisition is
to buy cheap—in other words, at a price below a
company’s intrinsic value. In our experience,
however, such opportunities are rare and relatively
small. Nonetheless, though market values revert to
intrinsic values over longer periods, there can be
brief moments when the two fall out of alignment.
Markets, for example, sometimes overreact to
negative news, such as a criminal investigation of
an executive or the failure of a single product in a
portfolio with many strong ones.
Such moments are less rare in cyclical industries,
where assets are often undervalued at the bottom
of a cycle. Comparing actual market valuations
with intrinsic values based on a “perfect foresight”
model, we found that companies in cyclical
industries could more than double their
shareholder returns (relative to actual returns) if
they acquired assets at the bottom of a cycle and
sold at the top.
While markets do throw up occasional
opportunities for companies to buy targets at levels
below their intrinsic value, we haven’t seen many
cases. To gain control of a target, acquirers must
pay its shareholders a premium over the current
market value. Although premiums can vary widely,
the average ones for corporate control have been
7The five types of successful acquisitions
fairly stable: almost 30 percent of the
preannouncement price of the target’s equity. For
targets pursued by multiple acquirers, the
premium rises dramatically, creating the so-called
winner’s curse. If several companies evaluate a
given target and all identify roughly the same
potential synergies, the pursuer that overestimates
them most will offer the highest price. Since it is
based on an overestimation of the value to be
created, the winner pays too much—and is
ultimately a loser.
Since market values can sometimes deviate from
intrinsic ones, management must also beware the
possibility that markets may be overvaluing a
potential acquisition. Consider the stock market
bubble during the late 1990s. Companies that
merged with or acquired technology, media, or
telecommunications businesses saw their share
prices plummet when the market reverted to
earlier levels. The possibility that a company might
pay too much when the market is inflated deserves
serious consideration, because M&A activity seems
to rise following periods of strong market
performance. If (and when) prices are artificially
high, large improvements are necessary to justify
an acquisition, even when the target can be
purchased at no premium to market value.
Premiums for private deals tend to be smaller,
although comprehensive evidence is difficult to
collect because publicly available data are scarce.
Private acquisitions often stem from the seller’s
desire to get out rather than the buyer’s desire
for a purchase.
By focusing on the types of acquisition strategies
that have created value for acquirers in the past,
managers can make it more likely that their
acquisitions will create value for their shareholders.
1 Viral V. Acharya, Moritz Hahn, and Conor Kehoe,
“Corporate
governance and value creation: Evidence from private equity,”
Social Science Research Network Working Paper, February 19,
2010.
2 IBM investor briefing, May 12, 2010
(www.ibm.com/investor/
events/investor0510/presentation/pres3.pdf).
3 Marco de Heer and Timothy M. Koller, “Valuing cyclical
companies,” mckinseyquarterly.com, May 2000.
4 Kevin Rock, “Why new issues are underpriced,” Journal of
Financial Economics, 1986, Volume 15, Number 1–2, pp. 187–
212.
Marc Goedhart ([email protected]) is a consultant in
McKinsey’s Amsterdam office, Tim Koller
([email protected]) is a partner in the New York office, and
David Wessels, an alumnus of the New York
office, is an adjunct professor of finance at the University of
Pennsylvania’s Wharton School. This article is excerpted
from Tim Koller, Marc Goedhart, and David Wessels,
Valuation: Measuring and Managing the Value of Companies
(fifth
edition, Hoboken, NJ: John Wiley & Sons, August 2010). Tim
Koller is also coauthor, with Richard Dobbs and Bill
Huyett, of a forthcoming managers’ guide to value creation,
titled Value: The Four Cornerstones of Corporate Finance
(Hoboken, NJ: John Wiley & Sons, October 2010). Copyright ©
2010 McKinsey & Company. All rights reserved.
related files/485230635.docx
Good Financial Analysts Are Made, Not Born
They probably won’t know what effective analysis looks like
when they show up for work, so CFOs have to teach them.
Here’s how.
David McCann
CFOs who are looking to expand their roster of financial
analysts, and not finding as many high-quality ones as they
want, perhaps should assign some of the blame to themselves.
Rather than simply seek top talent, companies should also
impose “rules of engagement” on those they hire that are likely
to result in superior-quality analysis, according to the Corporate
Executive Board (CEB), a membership-based research
organization.
Many finance teams struggle to define the skills and behaviors
that will deliver effective analytic support, CEB says. They
often use generic descriptions of desired analyst skills, such as
“thinks critically,” “influences business partners,” or “fosters
innovation.” As a result, they may inadequately develop their
financial-planning-and-analysis (FP&A) staffs.
The best companies, CEB says, describe more specific
behaviors and techniques they want their analysts to
demonstrate, such as “challenges conventional ideas in both
group and one-on-one settings,” “proposes clear action steps,”
and “focuses on cause-and-effect relationships between
observable factors.”
“Financial analysts may come out of MBA or undergrad
programs with good, finance-oriented analytical toolboxes, but
they don’t necessarily have a good sense for how to produce
analysis that’s easily consumable by senior executives and
business partners,” says Tim Raiswell, a senior research
director for the CEB Finance Leadership Council. “One thing
that differentiates great organizations is having rules of
engagement for what good analysis and a good analytic process
look like.”
For example, CFOs could have a rule that they won’t even look
at an analyst’s report unless it begins with the one thing they
need to take away from the analysis or actions the company or
business lines should take as a result of the analyst’s findings.
CEB came to its insights through qualitative research that
consisted largely of extensive interviews with 70 corporate
FP&A heads, as well as academics and consultants. Based on
that research, it recommends a methodology for analysts to
follow that it calls “insight as a process,” which consists of
three key principles.
The first principle is that all analysis should include both
inductive and deductive elements. Inductive analysis, also
called pattern analysis, involves seeing patterns in data and
related files1208771704.pdfTen timeless tests can help yo.docx

More Related Content

Similar to related files1208771704.pdfTen timeless tests can help yo.docx

Ch-5 Competitor Analysis.pdf
Ch-5 Competitor Analysis.pdfCh-5 Competitor Analysis.pdf
Ch-5 Competitor Analysis.pdfEmaArbySugianto
 
COMPETITIVE Books by Michael E. Porter The Com.docx
COMPETITIVE Books by Michael E. Porter The Com.docxCOMPETITIVE Books by Michael E. Porter The Com.docx
COMPETITIVE Books by Michael E. Porter The Com.docxmccormicknadine86
 
What does success look like in your industry how do you get top
What does success look like   in your industry how do you   get topWhat does success look like   in your industry how do you   get top
What does success look like in your industry how do you get topLeul Girma
 
Tuesday's Leaders. Growing When Your Industry Doesn’t from Strategy+ Business.
Tuesday's Leaders. Growing When Your Industry Doesn’t from Strategy+ Business.Tuesday's Leaders. Growing When Your Industry Doesn’t from Strategy+ Business.
Tuesday's Leaders. Growing When Your Industry Doesn’t from Strategy+ Business.BURESI
 
9. life cycle strategies
9. life cycle strategies9. life cycle strategies
9. life cycle strategiesJigar Lakhani
 
Tools and Techniques of Strategic Management
Tools and Techniques of Strategic ManagementTools and Techniques of Strategic Management
Tools and Techniques of Strategic ManagementSaumya Singh
 
INDUSTRY ANALYSIS One of the major competences that str.docx
INDUSTRY ANALYSIS  One of the major competences that str.docxINDUSTRY ANALYSIS  One of the major competences that str.docx
INDUSTRY ANALYSIS One of the major competences that str.docxcarliotwaycave
 
Porters five model
Porters five modelPorters five model
Porters five modelHEMA SANKAR
 
Assignment 3 Case StudyE-Business Strategy and Models in B.docx
Assignment 3  Case StudyE-Business Strategy and Models in B.docxAssignment 3  Case StudyE-Business Strategy and Models in B.docx
Assignment 3 Case StudyE-Business Strategy and Models in B.docxbraycarissa250
 
Module CLC AssignmentCollaborative Learning Community C.docx
Module CLC AssignmentCollaborative Learning Community C.docxModule CLC AssignmentCollaborative Learning Community C.docx
Module CLC AssignmentCollaborative Learning Community C.docxgilpinleeanna
 
Industry and Competitor Analysis | Five Competitive Forces | Five Primary Ind...
Industry and Competitor Analysis | Five Competitive Forces | Five Primary Ind...Industry and Competitor Analysis | Five Competitive Forces | Five Primary Ind...
Industry and Competitor Analysis | Five Competitive Forces | Five Primary Ind...FaHaD .H. NooR
 
managerial policy Defin+industry+competition
managerial policy Defin+industry+competitionmanagerial policy Defin+industry+competition
managerial policy Defin+industry+competitionAshar Azam
 
Mtm4 white paper industry analysis (featuring the 5 forces)
Mtm4 white paper   industry analysis (featuring the 5 forces)Mtm4 white paper   industry analysis (featuring the 5 forces)
Mtm4 white paper industry analysis (featuring the 5 forces)IntelCollab.com
 
SCIP & PDMA 20090917 Milwaukee - Intelligence 2.0: A Worldview For Anticipati...
SCIP & PDMA 20090917 Milwaukee - Intelligence 2.0: A Worldview For Anticipati...SCIP & PDMA 20090917 Milwaukee - Intelligence 2.0: A Worldview For Anticipati...
SCIP & PDMA 20090917 Milwaukee - Intelligence 2.0: A Worldview For Anticipati...Arik Johnson
 
Building_a_Sustainable_Competitive_Advantage.pdf
Building_a_Sustainable_Competitive_Advantage.pdfBuilding_a_Sustainable_Competitive_Advantage.pdf
Building_a_Sustainable_Competitive_Advantage.pdfMohamedMetwally496403
 

Similar to related files1208771704.pdfTen timeless tests can help yo.docx (19)

Mc Kinsey Quarterly Q4 2013
Mc Kinsey Quarterly Q4 2013Mc Kinsey Quarterly Q4 2013
Mc Kinsey Quarterly Q4 2013
 
Ch-5 Competitor Analysis.pdf
Ch-5 Competitor Analysis.pdfCh-5 Competitor Analysis.pdf
Ch-5 Competitor Analysis.pdf
 
COMPETITIVE Books by Michael E. Porter The Com.docx
COMPETITIVE Books by Michael E. Porter The Com.docxCOMPETITIVE Books by Michael E. Porter The Com.docx
COMPETITIVE Books by Michael E. Porter The Com.docx
 
What does success look like in your industry how do you get top
What does success look like   in your industry how do you   get topWhat does success look like   in your industry how do you   get top
What does success look like in your industry how do you get top
 
It strategy lecture
It strategy lectureIt strategy lecture
It strategy lecture
 
Tuesday's Leaders. Growing When Your Industry Doesn’t from Strategy+ Business.
Tuesday's Leaders. Growing When Your Industry Doesn’t from Strategy+ Business.Tuesday's Leaders. Growing When Your Industry Doesn’t from Strategy+ Business.
Tuesday's Leaders. Growing When Your Industry Doesn’t from Strategy+ Business.
 
Growing When Your Industry Doesn't
Growing When Your Industry Doesn'tGrowing When Your Industry Doesn't
Growing When Your Industry Doesn't
 
9. life cycle strategies
9. life cycle strategies9. life cycle strategies
9. life cycle strategies
 
Tools and Techniques of Strategic Management
Tools and Techniques of Strategic ManagementTools and Techniques of Strategic Management
Tools and Techniques of Strategic Management
 
INDUSTRY ANALYSIS One of the major competences that str.docx
INDUSTRY ANALYSIS  One of the major competences that str.docxINDUSTRY ANALYSIS  One of the major competences that str.docx
INDUSTRY ANALYSIS One of the major competences that str.docx
 
Porters five model
Porters five modelPorters five model
Porters five model
 
Assignment 3 Case StudyE-Business Strategy and Models in B.docx
Assignment 3  Case StudyE-Business Strategy and Models in B.docxAssignment 3  Case StudyE-Business Strategy and Models in B.docx
Assignment 3 Case StudyE-Business Strategy and Models in B.docx
 
Module CLC AssignmentCollaborative Learning Community C.docx
Module CLC AssignmentCollaborative Learning Community C.docxModule CLC AssignmentCollaborative Learning Community C.docx
Module CLC AssignmentCollaborative Learning Community C.docx
 
Industry and Competitor Analysis | Five Competitive Forces | Five Primary Ind...
Industry and Competitor Analysis | Five Competitive Forces | Five Primary Ind...Industry and Competitor Analysis | Five Competitive Forces | Five Primary Ind...
Industry and Competitor Analysis | Five Competitive Forces | Five Primary Ind...
 
managerial policy Defin+industry+competition
managerial policy Defin+industry+competitionmanagerial policy Defin+industry+competition
managerial policy Defin+industry+competition
 
Advertising and Campaign planning
Advertising and Campaign planningAdvertising and Campaign planning
Advertising and Campaign planning
 
Mtm4 white paper industry analysis (featuring the 5 forces)
Mtm4 white paper   industry analysis (featuring the 5 forces)Mtm4 white paper   industry analysis (featuring the 5 forces)
Mtm4 white paper industry analysis (featuring the 5 forces)
 
SCIP & PDMA 20090917 Milwaukee - Intelligence 2.0: A Worldview For Anticipati...
SCIP & PDMA 20090917 Milwaukee - Intelligence 2.0: A Worldview For Anticipati...SCIP & PDMA 20090917 Milwaukee - Intelligence 2.0: A Worldview For Anticipati...
SCIP & PDMA 20090917 Milwaukee - Intelligence 2.0: A Worldview For Anticipati...
 
Building_a_Sustainable_Competitive_Advantage.pdf
Building_a_Sustainable_Competitive_Advantage.pdfBuilding_a_Sustainable_Competitive_Advantage.pdf
Building_a_Sustainable_Competitive_Advantage.pdf
 

More from debishakespeare

Ethical Case Study 2Gloria is a housekeeper in an independent li.docx
Ethical Case Study 2Gloria is a housekeeper in an independent li.docxEthical Case Study 2Gloria is a housekeeper in an independent li.docx
Ethical Case Study 2Gloria is a housekeeper in an independent li.docxdebishakespeare
 
Ethical consideration is important in nursing practice, especial.docx
Ethical consideration is important in nursing practice, especial.docxEthical consideration is important in nursing practice, especial.docx
Ethical consideration is important in nursing practice, especial.docxdebishakespeare
 
Ethical Competency Writing Assignment DescriptionPHI 108 Spr.docx
Ethical Competency Writing Assignment DescriptionPHI 108 Spr.docxEthical Competency Writing Assignment DescriptionPHI 108 Spr.docx
Ethical Competency Writing Assignment DescriptionPHI 108 Spr.docxdebishakespeare
 
Ethical Case StudyAn example of unethical treatment of participa.docx
Ethical Case StudyAn example of unethical treatment of participa.docxEthical Case StudyAn example of unethical treatment of participa.docx
Ethical Case StudyAn example of unethical treatment of participa.docxdebishakespeare
 
Ethical AwarenessDEFINITION a brief definition of the k.docx
Ethical AwarenessDEFINITION a brief definition of the k.docxEthical AwarenessDEFINITION a brief definition of the k.docx
Ethical AwarenessDEFINITION a brief definition of the k.docxdebishakespeare
 
ETHICAL CHALLENGES JOYCAROLYNE MUIGAINTC3025262020.docx
ETHICAL CHALLENGES JOYCAROLYNE MUIGAINTC3025262020.docxETHICAL CHALLENGES JOYCAROLYNE MUIGAINTC3025262020.docx
ETHICAL CHALLENGES JOYCAROLYNE MUIGAINTC3025262020.docxdebishakespeare
 
Ethical Conduct of Researchpower point from this document, 1.docx
Ethical Conduct of Researchpower point from this document, 1.docxEthical Conduct of Researchpower point from this document, 1.docx
Ethical Conduct of Researchpower point from this document, 1.docxdebishakespeare
 
Ethical Challenges and Agency IssuesI.IntroductionII.E.docx
Ethical Challenges and Agency IssuesI.IntroductionII.E.docxEthical Challenges and Agency IssuesI.IntroductionII.E.docx
Ethical Challenges and Agency IssuesI.IntroductionII.E.docxdebishakespeare
 
Ethical Approaches An Overview of .docx
Ethical Approaches An Overview of .docxEthical Approaches An Overview of .docx
Ethical Approaches An Overview of .docxdebishakespeare
 
Ethical and Professional Issues in Group PracticeThose who seek .docx
Ethical and Professional Issues in Group PracticeThose who seek .docxEthical and Professional Issues in Group PracticeThose who seek .docx
Ethical and Professional Issues in Group PracticeThose who seek .docxdebishakespeare
 
Ethical AnalysisSelect a work-related ethical scenario that .docx
Ethical AnalysisSelect a work-related ethical scenario that .docxEthical AnalysisSelect a work-related ethical scenario that .docx
Ethical AnalysisSelect a work-related ethical scenario that .docxdebishakespeare
 
Ethical (Moral) RelativismIn America, many are comfortable describ.docx
Ethical (Moral) RelativismIn America, many are comfortable describ.docxEthical (Moral) RelativismIn America, many are comfortable describ.docx
Ethical (Moral) RelativismIn America, many are comfortable describ.docxdebishakespeare
 
Ethical Analysis on Lehman Brothers financial crisis of 2008 , pleas.docx
Ethical Analysis on Lehman Brothers financial crisis of 2008 , pleas.docxEthical Analysis on Lehman Brothers financial crisis of 2008 , pleas.docx
Ethical Analysis on Lehman Brothers financial crisis of 2008 , pleas.docxdebishakespeare
 
Ethical Analysis on Merrill lynch financial crisis of 2008 , please .docx
Ethical Analysis on Merrill lynch financial crisis of 2008 , please .docxEthical Analysis on Merrill lynch financial crisis of 2008 , please .docx
Ethical Analysis on Merrill lynch financial crisis of 2008 , please .docxdebishakespeare
 
ETHC 101Discussion Board Reply Grading RubricCriteriaLevels .docx
ETHC 101Discussion Board Reply Grading RubricCriteriaLevels .docxETHC 101Discussion Board Reply Grading RubricCriteriaLevels .docx
ETHC 101Discussion Board Reply Grading RubricCriteriaLevels .docxdebishakespeare
 
Ethical and Human Rights Concerns in Global HealthChapter Fou.docx
Ethical and Human Rights Concerns in Global HealthChapter  Fou.docxEthical and Human Rights Concerns in Global HealthChapter  Fou.docx
Ethical and Human Rights Concerns in Global HealthChapter Fou.docxdebishakespeare
 
Ethical & Legal Aspects in Nursing WK 14Please answer the .docx
Ethical & Legal Aspects in Nursing WK 14Please answer the .docxEthical & Legal Aspects in Nursing WK 14Please answer the .docx
Ethical & Legal Aspects in Nursing WK 14Please answer the .docxdebishakespeare
 
EthernetSatellite dishInternational Plastics, Inc. - C.docx
EthernetSatellite dishInternational Plastics, Inc. -  C.docxEthernetSatellite dishInternational Plastics, Inc. -  C.docx
EthernetSatellite dishInternational Plastics, Inc. - C.docxdebishakespeare
 
Ethanolv.DrizinUnited States District Court, N.D. Iowa, Eastern .docx
Ethanolv.DrizinUnited States District Court, N.D. Iowa, Eastern .docxEthanolv.DrizinUnited States District Court, N.D. Iowa, Eastern .docx
Ethanolv.DrizinUnited States District Court, N.D. Iowa, Eastern .docxdebishakespeare
 
Ethan FromeEdith WhartonTHE EMC MASTERPIECE SERIES.docx
Ethan FromeEdith WhartonTHE EMC MASTERPIECE SERIES.docxEthan FromeEdith WhartonTHE EMC MASTERPIECE SERIES.docx
Ethan FromeEdith WhartonTHE EMC MASTERPIECE SERIES.docxdebishakespeare
 

More from debishakespeare (20)

Ethical Case Study 2Gloria is a housekeeper in an independent li.docx
Ethical Case Study 2Gloria is a housekeeper in an independent li.docxEthical Case Study 2Gloria is a housekeeper in an independent li.docx
Ethical Case Study 2Gloria is a housekeeper in an independent li.docx
 
Ethical consideration is important in nursing practice, especial.docx
Ethical consideration is important in nursing practice, especial.docxEthical consideration is important in nursing practice, especial.docx
Ethical consideration is important in nursing practice, especial.docx
 
Ethical Competency Writing Assignment DescriptionPHI 108 Spr.docx
Ethical Competency Writing Assignment DescriptionPHI 108 Spr.docxEthical Competency Writing Assignment DescriptionPHI 108 Spr.docx
Ethical Competency Writing Assignment DescriptionPHI 108 Spr.docx
 
Ethical Case StudyAn example of unethical treatment of participa.docx
Ethical Case StudyAn example of unethical treatment of participa.docxEthical Case StudyAn example of unethical treatment of participa.docx
Ethical Case StudyAn example of unethical treatment of participa.docx
 
Ethical AwarenessDEFINITION a brief definition of the k.docx
Ethical AwarenessDEFINITION a brief definition of the k.docxEthical AwarenessDEFINITION a brief definition of the k.docx
Ethical AwarenessDEFINITION a brief definition of the k.docx
 
ETHICAL CHALLENGES JOYCAROLYNE MUIGAINTC3025262020.docx
ETHICAL CHALLENGES JOYCAROLYNE MUIGAINTC3025262020.docxETHICAL CHALLENGES JOYCAROLYNE MUIGAINTC3025262020.docx
ETHICAL CHALLENGES JOYCAROLYNE MUIGAINTC3025262020.docx
 
Ethical Conduct of Researchpower point from this document, 1.docx
Ethical Conduct of Researchpower point from this document, 1.docxEthical Conduct of Researchpower point from this document, 1.docx
Ethical Conduct of Researchpower point from this document, 1.docx
 
Ethical Challenges and Agency IssuesI.IntroductionII.E.docx
Ethical Challenges and Agency IssuesI.IntroductionII.E.docxEthical Challenges and Agency IssuesI.IntroductionII.E.docx
Ethical Challenges and Agency IssuesI.IntroductionII.E.docx
 
Ethical Approaches An Overview of .docx
Ethical Approaches An Overview of .docxEthical Approaches An Overview of .docx
Ethical Approaches An Overview of .docx
 
Ethical and Professional Issues in Group PracticeThose who seek .docx
Ethical and Professional Issues in Group PracticeThose who seek .docxEthical and Professional Issues in Group PracticeThose who seek .docx
Ethical and Professional Issues in Group PracticeThose who seek .docx
 
Ethical AnalysisSelect a work-related ethical scenario that .docx
Ethical AnalysisSelect a work-related ethical scenario that .docxEthical AnalysisSelect a work-related ethical scenario that .docx
Ethical AnalysisSelect a work-related ethical scenario that .docx
 
Ethical (Moral) RelativismIn America, many are comfortable describ.docx
Ethical (Moral) RelativismIn America, many are comfortable describ.docxEthical (Moral) RelativismIn America, many are comfortable describ.docx
Ethical (Moral) RelativismIn America, many are comfortable describ.docx
 
Ethical Analysis on Lehman Brothers financial crisis of 2008 , pleas.docx
Ethical Analysis on Lehman Brothers financial crisis of 2008 , pleas.docxEthical Analysis on Lehman Brothers financial crisis of 2008 , pleas.docx
Ethical Analysis on Lehman Brothers financial crisis of 2008 , pleas.docx
 
Ethical Analysis on Merrill lynch financial crisis of 2008 , please .docx
Ethical Analysis on Merrill lynch financial crisis of 2008 , please .docxEthical Analysis on Merrill lynch financial crisis of 2008 , please .docx
Ethical Analysis on Merrill lynch financial crisis of 2008 , please .docx
 
ETHC 101Discussion Board Reply Grading RubricCriteriaLevels .docx
ETHC 101Discussion Board Reply Grading RubricCriteriaLevels .docxETHC 101Discussion Board Reply Grading RubricCriteriaLevels .docx
ETHC 101Discussion Board Reply Grading RubricCriteriaLevels .docx
 
Ethical and Human Rights Concerns in Global HealthChapter Fou.docx
Ethical and Human Rights Concerns in Global HealthChapter  Fou.docxEthical and Human Rights Concerns in Global HealthChapter  Fou.docx
Ethical and Human Rights Concerns in Global HealthChapter Fou.docx
 
Ethical & Legal Aspects in Nursing WK 14Please answer the .docx
Ethical & Legal Aspects in Nursing WK 14Please answer the .docxEthical & Legal Aspects in Nursing WK 14Please answer the .docx
Ethical & Legal Aspects in Nursing WK 14Please answer the .docx
 
EthernetSatellite dishInternational Plastics, Inc. - C.docx
EthernetSatellite dishInternational Plastics, Inc. -  C.docxEthernetSatellite dishInternational Plastics, Inc. -  C.docx
EthernetSatellite dishInternational Plastics, Inc. - C.docx
 
Ethanolv.DrizinUnited States District Court, N.D. Iowa, Eastern .docx
Ethanolv.DrizinUnited States District Court, N.D. Iowa, Eastern .docxEthanolv.DrizinUnited States District Court, N.D. Iowa, Eastern .docx
Ethanolv.DrizinUnited States District Court, N.D. Iowa, Eastern .docx
 
Ethan FromeEdith WhartonTHE EMC MASTERPIECE SERIES.docx
Ethan FromeEdith WhartonTHE EMC MASTERPIECE SERIES.docxEthan FromeEdith WhartonTHE EMC MASTERPIECE SERIES.docx
Ethan FromeEdith WhartonTHE EMC MASTERPIECE SERIES.docx
 

Recently uploaded

POINT- BIOCHEMISTRY SEM 2 ENZYMES UNIT 5.pptx
POINT- BIOCHEMISTRY SEM 2 ENZYMES UNIT 5.pptxPOINT- BIOCHEMISTRY SEM 2 ENZYMES UNIT 5.pptx
POINT- BIOCHEMISTRY SEM 2 ENZYMES UNIT 5.pptxSayali Powar
 
Employee wellbeing at the workplace.pptx
Employee wellbeing at the workplace.pptxEmployee wellbeing at the workplace.pptx
Employee wellbeing at the workplace.pptxNirmalaLoungPoorunde1
 
Final demo Grade 9 for demo Plan dessert.pptx
Final demo Grade 9 for demo Plan dessert.pptxFinal demo Grade 9 for demo Plan dessert.pptx
Final demo Grade 9 for demo Plan dessert.pptxAvyJaneVismanos
 
Crayon Activity Handout For the Crayon A
Crayon Activity Handout For the Crayon ACrayon Activity Handout For the Crayon A
Crayon Activity Handout For the Crayon AUnboundStockton
 
MARGINALIZATION (Different learners in Marginalized Group
MARGINALIZATION (Different learners in Marginalized GroupMARGINALIZATION (Different learners in Marginalized Group
MARGINALIZATION (Different learners in Marginalized GroupJonathanParaisoCruz
 
Types of Journalistic Writing Grade 8.pptx
Types of Journalistic Writing Grade 8.pptxTypes of Journalistic Writing Grade 8.pptx
Types of Journalistic Writing Grade 8.pptxEyham Joco
 
Organic Name Reactions for the students and aspirants of Chemistry12th.pptx
Organic Name Reactions  for the students and aspirants of Chemistry12th.pptxOrganic Name Reactions  for the students and aspirants of Chemistry12th.pptx
Organic Name Reactions for the students and aspirants of Chemistry12th.pptxVS Mahajan Coaching Centre
 
Interactive Powerpoint_How to Master effective communication
Interactive Powerpoint_How to Master effective communicationInteractive Powerpoint_How to Master effective communication
Interactive Powerpoint_How to Master effective communicationnomboosow
 
How to Make a Pirate ship Primary Education.pptx
How to Make a Pirate ship Primary Education.pptxHow to Make a Pirate ship Primary Education.pptx
How to Make a Pirate ship Primary Education.pptxmanuelaromero2013
 
Incoming and Outgoing Shipments in 1 STEP Using Odoo 17
Incoming and Outgoing Shipments in 1 STEP Using Odoo 17Incoming and Outgoing Shipments in 1 STEP Using Odoo 17
Incoming and Outgoing Shipments in 1 STEP Using Odoo 17Celine George
 
Full Stack Web Development Course for Beginners
Full Stack Web Development Course  for BeginnersFull Stack Web Development Course  for Beginners
Full Stack Web Development Course for BeginnersSabitha Banu
 
Historical philosophical, theoretical, and legal foundations of special and i...
Historical philosophical, theoretical, and legal foundations of special and i...Historical philosophical, theoretical, and legal foundations of special and i...
Historical philosophical, theoretical, and legal foundations of special and i...jaredbarbolino94
 
CARE OF CHILD IN INCUBATOR..........pptx
CARE OF CHILD IN INCUBATOR..........pptxCARE OF CHILD IN INCUBATOR..........pptx
CARE OF CHILD IN INCUBATOR..........pptxGaneshChakor2
 
ECONOMIC CONTEXT - PAPER 1 Q3: NEWSPAPERS.pptx
ECONOMIC CONTEXT - PAPER 1 Q3: NEWSPAPERS.pptxECONOMIC CONTEXT - PAPER 1 Q3: NEWSPAPERS.pptx
ECONOMIC CONTEXT - PAPER 1 Q3: NEWSPAPERS.pptxiammrhaywood
 
Framing an Appropriate Research Question 6b9b26d93da94caf993c038d9efcdedb.pdf
Framing an Appropriate Research Question 6b9b26d93da94caf993c038d9efcdedb.pdfFraming an Appropriate Research Question 6b9b26d93da94caf993c038d9efcdedb.pdf
Framing an Appropriate Research Question 6b9b26d93da94caf993c038d9efcdedb.pdfUjwalaBharambe
 
Computed Fields and api Depends in the Odoo 17
Computed Fields and api Depends in the Odoo 17Computed Fields and api Depends in the Odoo 17
Computed Fields and api Depends in the Odoo 17Celine George
 
KSHARA STURA .pptx---KSHARA KARMA THERAPY (CAUSTIC THERAPY)————IMP.OF KSHARA ...
KSHARA STURA .pptx---KSHARA KARMA THERAPY (CAUSTIC THERAPY)————IMP.OF KSHARA ...KSHARA STURA .pptx---KSHARA KARMA THERAPY (CAUSTIC THERAPY)————IMP.OF KSHARA ...
KSHARA STURA .pptx---KSHARA KARMA THERAPY (CAUSTIC THERAPY)————IMP.OF KSHARA ...M56BOOKSTORE PRODUCT/SERVICE
 

Recently uploaded (20)

POINT- BIOCHEMISTRY SEM 2 ENZYMES UNIT 5.pptx
POINT- BIOCHEMISTRY SEM 2 ENZYMES UNIT 5.pptxPOINT- BIOCHEMISTRY SEM 2 ENZYMES UNIT 5.pptx
POINT- BIOCHEMISTRY SEM 2 ENZYMES UNIT 5.pptx
 
Employee wellbeing at the workplace.pptx
Employee wellbeing at the workplace.pptxEmployee wellbeing at the workplace.pptx
Employee wellbeing at the workplace.pptx
 
Final demo Grade 9 for demo Plan dessert.pptx
Final demo Grade 9 for demo Plan dessert.pptxFinal demo Grade 9 for demo Plan dessert.pptx
Final demo Grade 9 for demo Plan dessert.pptx
 
TataKelola dan KamSiber Kecerdasan Buatan v022.pdf
TataKelola dan KamSiber Kecerdasan Buatan v022.pdfTataKelola dan KamSiber Kecerdasan Buatan v022.pdf
TataKelola dan KamSiber Kecerdasan Buatan v022.pdf
 
9953330565 Low Rate Call Girls In Rohini Delhi NCR
9953330565 Low Rate Call Girls In Rohini  Delhi NCR9953330565 Low Rate Call Girls In Rohini  Delhi NCR
9953330565 Low Rate Call Girls In Rohini Delhi NCR
 
Crayon Activity Handout For the Crayon A
Crayon Activity Handout For the Crayon ACrayon Activity Handout For the Crayon A
Crayon Activity Handout For the Crayon A
 
MARGINALIZATION (Different learners in Marginalized Group
MARGINALIZATION (Different learners in Marginalized GroupMARGINALIZATION (Different learners in Marginalized Group
MARGINALIZATION (Different learners in Marginalized Group
 
Model Call Girl in Tilak Nagar Delhi reach out to us at 🔝9953056974🔝
Model Call Girl in Tilak Nagar Delhi reach out to us at 🔝9953056974🔝Model Call Girl in Tilak Nagar Delhi reach out to us at 🔝9953056974🔝
Model Call Girl in Tilak Nagar Delhi reach out to us at 🔝9953056974🔝
 
Types of Journalistic Writing Grade 8.pptx
Types of Journalistic Writing Grade 8.pptxTypes of Journalistic Writing Grade 8.pptx
Types of Journalistic Writing Grade 8.pptx
 
Organic Name Reactions for the students and aspirants of Chemistry12th.pptx
Organic Name Reactions  for the students and aspirants of Chemistry12th.pptxOrganic Name Reactions  for the students and aspirants of Chemistry12th.pptx
Organic Name Reactions for the students and aspirants of Chemistry12th.pptx
 
Interactive Powerpoint_How to Master effective communication
Interactive Powerpoint_How to Master effective communicationInteractive Powerpoint_How to Master effective communication
Interactive Powerpoint_How to Master effective communication
 
How to Make a Pirate ship Primary Education.pptx
How to Make a Pirate ship Primary Education.pptxHow to Make a Pirate ship Primary Education.pptx
How to Make a Pirate ship Primary Education.pptx
 
Incoming and Outgoing Shipments in 1 STEP Using Odoo 17
Incoming and Outgoing Shipments in 1 STEP Using Odoo 17Incoming and Outgoing Shipments in 1 STEP Using Odoo 17
Incoming and Outgoing Shipments in 1 STEP Using Odoo 17
 
Full Stack Web Development Course for Beginners
Full Stack Web Development Course  for BeginnersFull Stack Web Development Course  for Beginners
Full Stack Web Development Course for Beginners
 
Historical philosophical, theoretical, and legal foundations of special and i...
Historical philosophical, theoretical, and legal foundations of special and i...Historical philosophical, theoretical, and legal foundations of special and i...
Historical philosophical, theoretical, and legal foundations of special and i...
 
CARE OF CHILD IN INCUBATOR..........pptx
CARE OF CHILD IN INCUBATOR..........pptxCARE OF CHILD IN INCUBATOR..........pptx
CARE OF CHILD IN INCUBATOR..........pptx
 
ECONOMIC CONTEXT - PAPER 1 Q3: NEWSPAPERS.pptx
ECONOMIC CONTEXT - PAPER 1 Q3: NEWSPAPERS.pptxECONOMIC CONTEXT - PAPER 1 Q3: NEWSPAPERS.pptx
ECONOMIC CONTEXT - PAPER 1 Q3: NEWSPAPERS.pptx
 
Framing an Appropriate Research Question 6b9b26d93da94caf993c038d9efcdedb.pdf
Framing an Appropriate Research Question 6b9b26d93da94caf993c038d9efcdedb.pdfFraming an Appropriate Research Question 6b9b26d93da94caf993c038d9efcdedb.pdf
Framing an Appropriate Research Question 6b9b26d93da94caf993c038d9efcdedb.pdf
 
Computed Fields and api Depends in the Odoo 17
Computed Fields and api Depends in the Odoo 17Computed Fields and api Depends in the Odoo 17
Computed Fields and api Depends in the Odoo 17
 
KSHARA STURA .pptx---KSHARA KARMA THERAPY (CAUSTIC THERAPY)————IMP.OF KSHARA ...
KSHARA STURA .pptx---KSHARA KARMA THERAPY (CAUSTIC THERAPY)————IMP.OF KSHARA ...KSHARA STURA .pptx---KSHARA KARMA THERAPY (CAUSTIC THERAPY)————IMP.OF KSHARA ...
KSHARA STURA .pptx---KSHARA KARMA THERAPY (CAUSTIC THERAPY)————IMP.OF KSHARA ...
 

related files1208771704.pdfTen timeless tests can help yo.docx

  • 1. related files/1208771704.pdf Ten timeless tests can help you kick the tires on your strategy and kick up the level of strategic dialogue throughout your company. Have you tested your strategy lately? ‘What’s the next new thing in strategy?’ a senior executive recently asked Phil Rosenzweig, a professor at IMD,1 in Switzerland. His response was surprising for someone whose career is devoted to advancing the state of the art of strategy: “With all respect, I think that’s the wrong question. There’s always new stuff out there, and most of it’s not very good. Rather than looking for the next musing, it’s probably better to be thorough about what we know is true and make sure we do that well.” Let’s face it: the basic principles that make for good strategy often get
  • 2. obscured. Sometimes the explanation is a quest for the next new thing— natural in a field that emerged through the steady accumulation of frameworks promising to unlock the secret of competitive advantage.2 In other cases, the culprit is torrents of data, reams of analysis, and piles of documents that can be more distracting than enlightening. Ultimately, strategy is a way of thinking, not a procedural exercise or a set of frameworks. To stimulate that thinking and the dialogue that goes along with it, we developed a set of tests aimed at helping exec- utives assess the strength of their strategies. We focused on testing the strategy itself (in other words, the output of the strategy- development process), rather than the frameworks, tools, and approaches that generate Chris Bradley, Martin Hirt, and Sven Smit
  • 3. 1 International Institute for Management Development. 2 For a rich account of strategy’s birth and growth as a field, see Walter Kiechel, The Lords of Strategy, Boston, MA: Harvard Business School Press, 2010. J A N U A R Y 2 0 1 1 s t r a t e g y p r a c t i c e 2Have you tested your strategy lately? strategies, for two reasons. First, companies develop strategy in many different ways, often idiosyncratic to their organizations, people, and markets. Second, many strategies emerge over time rather than from a process of deliberate formulation.3 There are ten tests on our list, and not all are created equal. The first— “will it beat the market?”—is comprehensive. The remaining nine dis- aggregate the picture of a market-beating strategy, though it’s certainly possible for a strategy to succeed without “passing” all nine of them.
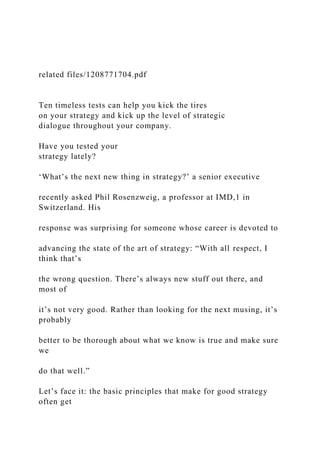
  • 4. This list may sound more complicated than the three Cs or the five forces of strategy.4 But detailed pressure testing, in our experience, helps pinpoint more precisely where the strategy needs work, while gener- ating a deeper and more fruitful strategic dialogue. Those conversations matter, but they often are loose and disjointed. We heard that, loud and clear, over the past two years in workshops where we explored our tests with more than 700 senior strategists around the world. Furthermore, a recent McKinsey Quarterly survey of 2,135 executives indicates that few strategies pass more than three 3 For a classic statement of the idea that strategies are more emergent than planned, see Henry Mintzberg, “Crafting strategy,” Harvard Business Review, 1987, July–August, Volume 65, Number 4, pp. 66–75. 4 The three Cs and the five forces are seminal strategy frameworks. The three Cs (competitors, customers, and company) were articulated by retired McKinsey partner
  • 5. Kenichi Ohmae in The Mind of the Strategist (McGraw-Hill, 1982). The five forces (barriers to entry, buyer power, supplier power, the threat of substitutes, and the degree of rivalry) were set forth by Harvard Business School professor Michael Porter in Competitive Strategy (Free Press, 1998). Q1 2011 Ten timeless tests Exhibit 1 of 2 Number of tests rated as fully consistent with company strategy, % of respondents 3 or fewer 4–6 Source: 2010 McKinsey survey of 2,135 global executives on testing business strategy Most companies’ strategies pass fewer than four of the ten tests. 7–10 25 10 65 3 January 2011
  • 6. of the tests. In contrast, the ref lections of a range of current and former strategy practitioners (see “How we do it: Strategic tests from four senior executives,” on mckinseyquarterly.com) suggest that the tests described here help formalize something that the best strategists do quite intuitively. The tests of a good strategy are timeless in nature. But the ability to pressure-test a strategy is especially timely now. The financial crisis of 2008 and the recession that followed made some strategies obsolete, revealed weaknesses in others, and forced many companies to confront choices and trade-offs they put off in boom years. At the same time, a shift toward shorter planning cycles and decentralized strategic deci- sion making are increasing the utility of a common set of tests.5 All this makes today an ideal time to kick the tires on your strategy.
  • 7. Will your strategy beat the market? All companies operate in markets surrounded by customers, suppliers, competitors, substitutes, and potential entrants, all seeking to advance their own positions. That process, unimpeded, inexorably drives eco- nomic surplus—the gap between the return a company earns and its cost of capital—toward zero. For a company to beat the market by capturing and retaining an eco- nomic surplus, there must be an imperfection that stops or at least slows the working of the market. An imperfection controlled by a company is a competitive advantage. These are by definition scarce and f leeting because markets drive reversion to mean performance. The best com- panies are emulated by those in the middle of the pack, and the worst exit or undergo significant reform. As each player responds to
  • 8. and learns from the actions of others, best practice becomes commonplace rather than a market-beating strategy. Good strategies emphasize difference—versus your direct competitors, versus potential substitutes, and versus potential entrants. Market participants play out the drama of competition on a stage beset by randomness. Because the evolution of markets is path dependent— that is, its current state at any one time is the sum product of all pre- Test 1: 5 For more on strategy setting in today’s environment, see Lowell Bryan, “Dynamic management: Better decisions in uncertain times,” mckinseyquarterly.com, December 2009; and “Navigating the new normal: A conversation with four chief strategy officers,” mckinseyquarterly.com, December 2009. 4Have you tested your strategy lately?
  • 9. vious events, including a great many random ones—the winners of today are often the accidents of history. Consider the development of the US tire industry. At its peak in the mid-1920s, a frenzy of entry had created almost 300 competitors. Yet by the 1940s, four producers con- trolled more than 70 percent of the market. Those winners happened to make retrospectively lucky choices about location and technology, but at the time it was difficult to tell which companies were truly fit for the evolving environment. The histories of many other industries, from aerospace to information technology, show remarkably simi- lar patterns. To beat the market, therefore, advantages have to be robust and respon- sive in the face of onrushing market forces. Few companies, in our experience, ask themselves if they are beating the market—the
  • 10. pres- sures of “just playing along” seem intense enough. But playing along can feel safer than it is. Weaker contenders win surprisingly often in war when they deploy a divergent strategy, and the same is true in business.6 Q1 2011 10 Timeless tests Exhibit 2 of 2 Performance cohorts based on position in 2001 relative to mean, n = 7431 20 15 10 5 0 –5 –10 –15 2001 2003 2005 2007 2009 2001 2003 2005 2007 2009
  • 11. 3.5 3.0 2.5 2.0 1.5 1.0 0.5 0 –0.5 –1.0 –1.5 Return on invested capital (ROIC), % Ratio of enterprise value to invested capital (EV/IC) 1 Sample of largest 1,200 nonfinancial US-listed companies in 2009 was narrowed to 743 that were also listed in 2001. Source: Standard & Poor’s Compustat; McKinsey analysis Markets drive a reversion to mean performance. Top quintile
  • 12. Middle quintile Bottom quintile 6 See Ivan Arreguin-Toft, How the weak win wars: A theory of asymmetric conflict, Cambridge, UK: Cambridge University Press, 2005. 5 January 2011 Does your strategy tap a true source of advantage? Know your competitive advantage, and you’ve answered the question of why you make money (and vice versa). Competitive advantage stems from two sources of scarcity: positional advantages and special capabilities. Positional advantages are rooted in structurally attractive markets. By definition, such advantages favor incumbents: they create an asym- metry between those inside and those outside high walls. For example,
  • 13. in Australia, two beer makers control 95 percent of the market and enjoy triple the margins of US brewers. This situation has sustained itself for two decades, but it wasn’t always so. Beginning in the 1980s, the Australian industry experienced consolidation. That change in struc- ture was associated with a change in industry conduct (price growth began outstripping general inf lation) and a change in industry perfor- mance (higher profitability). Understanding the relationship among structure, conduct, and performance is a critical part of the quest for positional advantage. Special capabilities, the second source of competitive advantage, are scarce resources whose possession confers unique benefits. The most obvious resources, such as drug patents or leases on mineral deposits, we call “privileged, tradable assets”: they can be bought and
  • 14. sold. A second category of special capabilities, “distinctive competencies,” consists of things a company does particularly well, such as innovating or managing stakeholders. These capabilities can be just as powerful in creating advantage but cannot be easily traded. Too often, companies are cavalier about claiming special capabilities. Such a capability must be critical to a company’s prof its and exist in abundance within it while being scarce outside. As such, special capabilities tend to be specific in nature and few in number. Companies often err here by mistaking size for scale advantage or overestimating their ability to leverage capabilities across markets. They infer special capabilities from observed performance, often without considering other explanations (such as luck or positional advantage). Companies
  • 15. should test any claimed capability advantage vigorously before pin- ning their hopes on it. When companies bundle together activities that collectively create advantage, it becomes more difficult for competitors to identify and Test 2: 6Have you tested your strategy lately? replicate its exact source. Consider Aldi, the highly successful dis- count grocery retailer. To deliver its value proposition of lower prices, Aldi has completely redesigned the typical business system of a supermarket: only 1,500 or so products rather than 30,000, the stock- ing of one own-brand or private label rather than hundreds of national brands, and superlean replenishment on pallets and trolleys, thus avoiding the expensive task of hand stacking shelves. Given
  • 16. the enormous changes necessary for any supermarket that wishes to copy the total system, it is extremely difficult to mimic Aldi’s value proposition. Finally, don’t forget to take a dynamic view. What can erode positional advantage? Which special capabilities are becoming vulnerable? There is every reason to believe that competitors will exploit points of vulnerability. Assume, like Lewis Carroll’s Red Queen, that you have to run just to stay in the same place. Is your strategy granular about where to compete? The need to beat the market begs the question of which market. Research shows that the unit of analysis used in determining strategy (essentially, the degree to which a market is segmented) signif i- cantly inf luences resource allocation and thus the likelihood of success: dividing the same businesses in different ways leads to
  • 17. strikingly different capital allocations. What is the right level of granularity? Push within reason for the finest possible objective segmentation of the market: think 30 to 50 seg- ments rather than the more typical 5 or so. Too often, by contrast, the business unit as defined by the organizational chart becomes the default for defining markets, reducing from the start the potential scope of strategic thinking. Defining and understanding these segments correctly is one of the most practical things a company can do to improve its strategy. Manage- ment at one large bank attributed fast growth and share gains to measurably superior customer perceptions and satisfaction. Examining the bank’s markets at a more granular level suggested that 90 percent of its outperformance could be attributed to a relatively high exposure
  • 18. to one fast-growing city and to a presence in a fast-growing product segment. This insight helped the bank avoid building its strategy on Test 3: 7 January 2011 false assumptions about what was and wasn’t working for the operation as a whole. In fact, 80 percent of the variance in revenue growth is explained by choices about where to compete, according to research summarized in The Granularity of Growth, leaving only 20 percent explained by choices about how to compete. Unfortunately, this is the exact opposite of the allocation of time and effort in a typical strategy- development process. Companies should be shifting their attention greatly toward
  • 19. the “where” and should strive to outposition competitors by regularly reallocating resources as opportunities shift within and between segments. Does your strategy put you ahead of trends? The emergence of new trends is the norm. But many strategies place too much weight on the continuation of the status quo because they extrapolate from the past three to five years, a time frame too brief to capture the true violence of market forces. A major innovation or an external shock in regulation, demand, or technology, for example, can drive a rapid, full-scale industry tran- sition. But most trends emerge fairly slowly—so slowly that com- panies generally fail to respond until a trend hits profits. At this point, it is too late to mount a strategically effective response, let alone shape the change to your advantage. Managers typically delay
  • 20. action, held back by sunk costs, an unwillingness to cannibalize a legacy business, or an attachment to yesterday’s formula for success. The cost of delay is steep: consider the plight of major travel agency chains slow to understand the power of online intermediaries. Con- versely, for companies that get ahead of the curve, major market transitions are an opportunity to rethink their commitments in areas ranging from technology to distribution and to tailor their strategies to the new environment. To do so, strategists must take trend analysis seriously. Always look to the edges. How are early adopters and that small cadre of consumers who seem to be ahead of the curve acting? What are small, innovative entrants doing? What technologies under development could change the game? To see which trends really matter, assess their
  • 21. potential Test 4: 8Have you tested your strategy lately? impact on the financial position of your company and articulate the decisions you would make differently if that outcome were certain. For example, don’t just stop at an aging population as a trend— work it through to its conclusion. Which consumer behaviors would change? Which particular product lines would be affected? What would be the precise effect on the P&L? And how does that picture line up with today’s investment priorities? Does your strategy rest on privileged insights? Data today can be cheap, accessible, and easily assembled into detailed analyses that leave executives with the comfortable feeling of pos-
  • 22. sessing an informed strategy. But much of this is noise and most of it is widely available to rivals. Furthermore, routinely analyzing readily available data diverts attention from where insight-creating advantage lies: in the weak signals buried in the noise. In the 1990s, when the ability to burn music onto CDs emerged, no one knew how digitization would play out; MP3s, peer-to- peer file sharing, and streaming Web-based media were not on the horizon. But one corporation with a large record label recognized more rapidly than others that the practical advantage of copyright protection could quickly become diluted if consumers began copying material. Early recognition of that possibility allowed the CEO to sell the business at a multiple based on everyone else’s assumption that the status quo was unthreatened. Developing proprietary insights isn’t easy. In fact, this is the
  • 23. element of good strategy where most companies stumble (see sidebar, “The insight def icit”). A search for problems can help you get started. Create a short list of questions whose answers would have major implications for the company’s strategy—for example, “What will we regret doing if the development of India hiccups or stalls, and what will we not regret?” In doing so, don’t forget to examine the assump- tions, explicit and implicit, behind an established business model. Do they still fit the current environment? Another key is to collect new data through f ield observations or research rather than to recycle the same industry reports everyone else uses. Similarly, seeking novel ways to analyze the data can generate Test 5:
  • 24. 9 January 2011 powerful new insights. For example, one supermarket chain we know recently rethought its store network strategy on the basis of surprising results from a new clustering algorithm. Finally, many strategic breakthroughs have their root in a simple but profound customer insight (usually solving an old problem for the customer in a new way). In our experience, companies that go out of their way to experience the world from the customer’s perspective routinely develop better strategies. Does your strategy embrace uncertainty? A central challenge of strategy is that we have to make choices now, but the payoffs occur in a future environment we cannot fully know or control. A critical step in embracing uncertainty is to try to charac- terize exactly what variety of it you face—a surprisingly rare
  • 25. activity at many companies. Our work over the years has emphasized four levels of uncertainty. Level one offers a reasonably clear view of the future: a range of outcomes tight enough to support a firm decision. At level two, there are a number of identifiable outcomes for which a company should prepare. At level three, the possible outcomes are represented not by a set of points but by a range that can be understood as a proba- bility distribution. Level four features total ambiguity, where even the distribution of outcomes is unknown. In our experience, companies oscillate between assuming, simplis- tically, that they are operating at level one (and making bold but unjusti- fied point forecasts) and succumbing to an unnecessarily pessimistic level-four paralysis. In each case, careful analysis of the situation usually
  • 26. redistributes the variables into the middle ground of levels two and three. Rigorously understanding the uncertainty you face starts with listing the variables that would inf luence a strategic decision and prioritizing them according to their impact. Focus early analysis on removing as much uncertainty as you can—by, for example, ruling out impossible outcomes and using the underlying economics at work to highlight outcomes that are either mutually reinforcing or unlikely because they would undermine one another in the market. Then apply tools such as scenario analysis to the remaining, irreducible uncertainty, which should be at the heart of your strategy. Test 6: 10Have you tested your strategy lately?
  • 27. Does your strategy balance commitment and flexibility? Commitment and f lexibility exist in inverse proportion to each other: the greater the commitment you make, the less f lexibility remains. This tension is one of the core challenges of strategy. Indeed, strategy can be expressed as making the right trade-offs over time between commitment and f lexibility. Making such trade-offs effectively requires an understanding of which decisions involve commitment. Inside any large company, hundreds of people make thousands of decisions each year. Only a few are strategic: those that involve commitment through hard-to-reverse investments in long-lasting, company-specific assets. Commitment is the only path to sustainable competitive advantage. In a world of uncertainty, strategy is about not just where and
  • 28. how to compete but also when. Committing too early can be a leap in the dark. Being too late is also dangerous, either because opportunities are perishable or rivals can seize advantage while your company stands on the sidelines. Flexibility is the essential ingredient that allows com- panies to make commitments when the risk/return trade-off seems most advantageous. A market-beating strategy will focus on just a few crucial, high- commitment choices to be made now, while leaving f lexibility for other such choices to be made over time. In practice, this approach means building your strategy as a portfolio comprising three things: big bets, or committed positions aimed at gaining signif icant competitive advantage; no-regrets moves, which will pay off whatever happens; and
  • 29. real options, or actions that involve relatively low costs now but can be elevated to a higher level of commitment as changing conditions war- rant. You can build underpriced options into a strategy by, for exam- ple, modularizing major capital projects or maintaining the f lexibility to switch between different inputs. Test 7: 11 January 2011 Is your strategy contaminated by bias? It’s possible to believe honestly that you have a market-beating strat- egy when, in fact, you don’t. Sometimes, that’s because forces beyond your control change. But in other cases, the cause is unintentional fuzzy thinking. Behavioral economists have identified many characteristics of the
  • 30. brain that are often strengths in our broader, personal environment but that can work against us in the world of business decision making. The worst offenders include overoptimism (our tendency to hope for the best and believe too much in our own forecasts and abilities), anchoring (tying our valuation of something to an arbitrary reference point), loss aversion (putting too much emphasis on avoiding down- sides and so eschewing risks worth taking), the confirmation bias (over- weighting information that validates our opinions), herding (taking comfort in following the crowd), and the champion bias (assigning to an idea merit that’s based on the person proposing it). Strategy is especially prone to faulty logic because it relies on extrap- olating ways to win in the future from a complex set of factors observed today. This is fertile ground for two big inference problems:
  • 31. attribution error (succumbing to the “halo effect”) and survivorship bias (ignoring the “graveyard of silent failures”). Attribution error is the false attribution of success to observed factors; it is strategy by hindsight and assumes that replicating the actions of another company will lead to similar results. Survivorship bias refers to an analysis based on a surviving population, without consideration of those who did not live to tell their tale: this approach skews our view of what caused success and presents no insights into what might cause failure— were the survivors just luckier? Case studies have their place, but hindsight is in reality not 20/20. There are too many unseen factors. Developing multiple hypotheses and potential solutions to choose among is one way to “de-bias” decision making. Too often, the typical
  • 32. Test 8: 12Have you tested your strategy lately? drill is to develop a promising hypothesis and put a lot of effort into building a fact base to validate it. In contrast, it is critical to bring fresh eyes to the issues and to maintain a culture of challenge, in which the obligation to dissent is fostered. The decision-making process can also be de-biased by, for example, specifying objective decision criteria in advance and examining the possibility of being wrong. Techniques such as the “premortem assess- ment” (imagining yourself in a future where your decision turns out to have been mistaken and identifying why that might have been so) can also be useful. Is there conviction to act on your strategy?
  • 33. This test and the one that follows aren’t strictly about the strategy itself but about the investment you’ve made in implementing it—a distinc- tion that in our experience quickly becomes meaningless because the two, inevitably, become intertwined. Many good strategies fall short in implementation because of an absence of conviction in the organi- zation, particularly among the top team, where just one or two non- believers can strangle strategic change at birth. Where a change of strategy is needed, that is usually because changes in the external environment have rendered obsolete the assumptions underlying a company’s earlier strategy. To move ahead with imple- mentation, you need a process that openly questions the old assump- tions and allows managers to develop a new set of beliefs in tune
  • 34. with the new situation. This goal is not likely to be achieved just via lengthy reports and presentations. Nor will the social processes required to absorb new beliefs—group formation, building shared meaning, exposing and reconciling differences, aligning and accept- ing accountability—occur in formal meetings. CEOs and boards should not be fooled by the warm glow they feel after a nice presentation by management. They must make sure that the whole team actually shares the new beliefs that support the strategy. This requirement means taking decision makers on a journey of discovery by creating experiences that will help them viscerally grasp mismatches that may exist between what the new strategy requires and the actions and behavior that have brought them success for many Test 9:
  • 35. 13 January 2011 years. For example, visit plants and customers or tour a country your company plans to enter, so that the leadership team can personally meet crucial stakeholders. Mock-ups, video clips, and virtual experiences also can help. The result of such an effort should be a support base of inf luencers who feel connected to the strategy and may even become evangelists for it. Because strategy often emanates from the top, and CEOs are accus- tomed to being heeded, this commonsense step often gets overlooked, to the great detriment of the strategy. Have you translated your strategy into an action plan? In implementing any new strategy, it’s imperative to define clearly what you are moving from and where you are moving to with respect
  • 36. to your company’s business model, organization, and capabilities. Develop a detailed view of the shifts required to make the move, and ensure that processes and mechanisms, for which individual exec- utives must be accountable, are in place to effect the changes. Quite simply, this is an action plan. Everyone needs to know what to do. Be sure that each major “from–to shift” is matched with the energy to make it happen. And since the totality of the change often repre- sents a major organizational transformation, make sure you and your senior team are drawing on the large body of research and experi- ence offering solid advice on change management—a topic beyond the scope of this article! Finally, don’t forget to make sure your ongoing resource allocation pro-
  • 37. cesses are aligned with your strategy. If you want to know what it actually is, look where the best people and the most generous budgets are—and be prepared to change these things significantly. Effort spent aligning the budget with the strategy will pay off many times over. As we’ve discussed the tests with hundreds of senior executives at many of the world’s largest companies, we’ve come away convinced that a lot of these topics are part of the strategic dialogue in organizations. But we’ve also heard time and again that discussion of such issues is often, as one executive in Japan recently told us, “random, simultaneous, and extremely confusing.” Our hope is that the tests will prove a simple and effective antidote: a means of quickly identifying gaps in executives’ Test 10:
  • 38. 14Have you tested your strategy lately? strategic thinking, opening their minds toward new ways of using strategy to create value, and improving the quality of the strategy- development process itself. The authors wish to acknowledge the many contributions of McKinsey alumnus Nick Percy, now the head of strategy for BBC Worldwide, to the thinking behind this article. Chris Bradley is a principal in McKinsey’s Sydney office, Martin Hirt is a director in the Taipei office, and Sven Smit is a director in the Amsterdam office. The insight deficit A fresh strategic insight—something your company sees that no one else does—is one of the foundations of competitive advantage. It helps
  • 39. companies focus their resources on moves that separate them from the pack. That makes the following interesting: in a recent survey, only 35% of 2,135 global executives believed their strategies rested on unique and powerful insights. That figure was dramatically lower than the average—62 percent—for nine other tests we asked executives to measure their strategies against. What’s more, only 14 percent of surveyed executives placed novel insights among the top three strategic influencers of financial performance. One likely explanation: the widespread availability of information and
  • 40. adoption of sophisticated strategy frameworks creates an impression that “everyone knows what we know and is probably analyzing the data in the same ways that we are.” The danger is obvious: if strategists question their ability to generate novel insights, they are less likely to reach for the relative advantages that are most likely to differentiate them from competitors. For the complete survey results, see “Putting strategies to the test: McKinsey Global Survey results,” on mckinseyquarterly.com. Copyright © 2011 McKinsey & Company. All rights reserved. We welcome your comments on this article. Please send them to [email protected]
  • 41. related files/1349723555.pdf McKinsey on Finance Number 36, Summer 2010 Perspectives on Corporate Finance and Strategy Why Asia’s banks underperform at M&A 21 Five ways CFOs can make cost cuts stick 25 The right way to hedge 32 A singular moment for merger value? 8 The five types of successful acquisitions
  • 42. 2 McKinsey conversations with global leaders: David Rubenstein of The Carlyle Group 10 2 There is no magic formula to make acquisitions successful. Like any other business process, they are not inherently good or bad, just as marketing and R&D aren’t. Each deal must have its own strategic logic. In our experience, acquirers in the most successful deals have specific, well- articulated value creation ideas going in. For less successful deals, the strategic rationales—such as pursuing international scale, filling portfolio gaps, or building a third leg of the portfolio—tend to be vague.
  • 43. Empirical analysis of specific acquisition strategies offers limited insight, largely because of the wide variety of types and sizes of acquisitions and the lack of an objective way to classify them by strategy. What’s more, the stated strategy may not Marc Goedhart, Tim Koller, and David Wessels The five types of successful acquisitions even be the real one: companies typically talk up all kinds of strategic benefits from acquisitions that are really entirely about cost cutting. In the absence of empirical research, our suggestions for strategies that create value reflect our acquisitions work with companies. In our experience, the strategic rationale for an acquisition that creates value typically conforms to
  • 44. at least one of the following five archetypes: improving the performance of the target company, removing excess capacity from an industry, creating market access for products, acquiring skills or technologies more quickly or at lower cost than they could be built in-house, and picking winners early and helping them develop their businesses. If an acquisition does not fit one or Companies advance myriad strategies for creating value with acquisitions—but only a handful are likely to do so. 3 more of these archetypes, it’s unlikely to create value. Executives, of course, often justify acquisitions by choosing from a much broader menu of strategies, including roll-ups, consolidating to improve competitive behavior, transformational mergers, and buying cheap.
  • 45. While these strategies can create value, we find that they seldom do. Value-minded executives should view them with a gimlet eye. Five archetypes An acquisition’s strategic rationale should be a specific articulation of one of these archetypes, not a vague concept like growth or strategic positioning, which may be important but must be translated into something more tangible. Furthermore, even if your acquisition is based on one of the archetypes below, it won’t create value if you overpay. Improve the target company’s performance Improving the performance of the target company is one of the most common value-creating acquisition strategies. Put simply, you buy a company and radically reduce costs to improve margins and cash flows. In some cases, the acquirer
  • 46. may also take steps to accelerate revenue growth. Pursuing this strategy is what the best private- equity firms do. Among successful private-equity acquisitions in which a target company was bought, improved, and sold, with no additional acquisitions along the way, operating-profit margins increased by an average of about 2.5 percentage points more than those at peer companies during the same period. This means that many of the transactions increased operating-profit margins even more. Keep in mind that it is easier to improve the performance of a company with low margins and low returns on invested capital (ROIC) than that of a high-margin, high-ROIC company. Consider a target company with a 6 percent operating-profit margin. Reducing costs by three percentage points, to 91 percent of revenues, from 94 percent,
  • 47. increases the margin to 9 percent and could lead to a 50 percent increase in the company’s value. In contrast, if the operating-profit margin of a company is 30 percent, increasing its value by 50 percent requires increasing the margin to 45 percent. Costs would need to decline from 70 percent of revenues to 55 percent, a 21 percent reduction in the cost base. That might not be reasonable to expect. Consolidate to remove excess capacity from industry As industries mature, they typically develop excess capacity. In chemicals, for example, companies are constantly looking for ways to get more production out of their plants, while new competitors continue to enter the industry. For example, Saudi Basic Industries Corporation (SABIC), which began production in the mid-1980s, grew from 6.3 million
  • 48. metric tons of value-added commodities—such as chemicals, polymers, and fertilizers—in 1985 to 56 million tons in 2008. Now one of the world’s largest petrochemicals concerns, SABIC expects continued growth, estimating its annual production to reach 135 million tons by 2020. The combination of higher production from existing capacity and new capacity from recent entrants often generates more supply than demand. It is in no individual competitor’s interest to shut a plant, however. Companies often find it easier to shut plants across the larger combined entity resulting from an acquisition than to shut their least productive plants without one and end up with a smaller company. Reducing excess in an industry can also extend to less tangible forms of capacity. Consolidation in
  • 49. 4 McKinsey on Finance Number 36, Summer 2010 the pharmaceutical industry, for example, has significantly reduced the capacity of the sales force as the product portfolios of merged companies change and they rethink how to interact with doctors. Pharmaceutical companies have also significantly reduced their R&D capacity as they found more productive ways to conduct research and pruned their portfolios of development projects. While there is substantial value to be created from removing excess capacity, as in most M&A activity the bulk of the value often accrues to the seller’s shareholders, not the buyer’s. Accelerate market access for the target’s (or buyer’s) products Often, relatively small companies with innovative products have difficulty reaching the entire
  • 50. potential market for their products. Small pharmaceutical companies, for example, typically lack the large sales forces required to cultivate relationships with the many doctors they need to promote their products. Bigger pharmaceutical companies sometimes purchase these smaller companies and use their own large-scale sales forces to accelerate the sales of the smaller companies’ products. IBM, for instance, has pursued this strategy in its software business. From 2002 to 2009, it acquired 70 companies for about $14 billion. By pushing their products through a global sales force, IBM estimates it increased their revenues by almost 50 percent in the first two years after each acquisition and an average of more than 10 percent in the next three years. In some cases, the target can also help accelerate
  • 51. the acquirer’s revenue growth. In Procter & Gamble’s acquisition of Gillette, the combined company benefited because P&G had stronger sales in some emerging markets, Gillette in others. Working together, they introduced their products into new markets much more quickly. Get skills or technologies faster or at lower cost than they can be built Cisco Systems has used acquisitions to close gaps in its technologies, allowing it to assemble a broad line of networking products and to grow very quickly from a company with a single product line into the key player in Internet equipment. From 1993 to 2001, Cisco acquired 71 companies, at an average price of approximately $350 million. Cisco’s sales increased from $650 million in 1993 to $22 billion in 2001, with nearly 40 percent of its 2001 revenue coming directly from these
  • 52. acquisitions. By 2009, Cisco had more than $36 billion in revenues and a market cap of approximately $150 billion. Pick winners early and help them develop their businesses The final winning strategy involves making acquisitions early in the life cycle of a new industry or product line, long before most others recognize that it will grow significantly. Johnson & Johnson pursued this strategy in its early acquisitions of medical-device businesses. When J&J bought device manufacturer Cordis, in 1996, Cordis had $500 million in revenues. By 2007, its revenues had increased to $3.8 billion, reflecting a 20 percent annual growth rate. J&J purchased orthopedic- device manufacturer DePuy in 1998, when DePuy had $900 million in revenues. By 2007, they had grown to $4.6 billion, also at an annual growth
  • 53. rate of 20 percent. This acquisition strategy requires a disciplined approach by management in three dimensions. First, you must be willing to make investments early, long before your competitors and the market see the industry’s or company’s potential. Second, 5The five types of successful acquisitions you need to make multiple bets and to expect that some will fail. Third, you need the skills and patience to nurture the acquired businesses. Harder strategies Beyond the five main acquisition strategies we’ve explored, a handful of others can create value, though in our experience they do so relatively rarely. Roll-up strategy Roll-up strategies consolidate highly fragmented
  • 54. markets where the current competitors are too small to achieve scale economies. Beginning in the 1960s, Service Corporation International, for instance, grew from a single funeral home in Houston to more than 1,400 funeral homes and cemeteries in 2008. Similarly, Clear Channel Communications rolled up the US market for radio stations, eventually owning more than 900. This strategy works when businesses as a group can realize substantial cost savings or achieve higher revenues than individual businesses can. Service Corporation’s funeral homes in a given city can share vehicles, purchasing, and back-office operations, for example. They can also coordinate advertising across a city to reduce costs and raise revenues. Size per se is not what creates a successful roll-up; what matters is the right kind of size. For Service
  • 55. Corporation, multiple locations in individual cities have been more important than many branches spread over many cities, because the cost savings (such as sharing vehicles) can be realized only if the branches are near one another. Roll-up strategies are hard to disguise, so they invite copycats. As others tried to imitate Service Corporation’s strategy, prices for some funeral homes were eventually bid up to levels that made additional acquisitions uneconomic. Consolidate to improve competitive behavior Many executives in highly competitive industries hope consolidation will lead competitors to focus 6 McKinsey on Finance Number 36, Summer 2010 less on price competition, thereby improving the ROIC of the industry. The evidence shows, however, that unless it consolidates to just three or four
  • 56. companies and can keep out new entrants, pricing behavior doesn’t change: smaller businesses or new entrants often have an incentive to gain share through lower prices. So in an industry with, say, ten companies, lots of deals must be done before the basis of competition changes. Enter into a transformational merger A commonly mentioned reason for an acquisition or merger is the desire to transform one or both companies. Transformational mergers are rare, however, because the circumstances have to be just right, and the management team needs to execute the strategy well. Transformational mergers can best be described by example. One of the world’s leading pharmaceutical companies, Switzerland’s Novartis, was formed in 1996 by the $30 billion merger of Ciba-Geigy and Sandoz. But this merger was much
  • 57. more than a simple combination of businesses: under the leadership of the new CEO, Daniel Vasella, Ciba-Geigy and Sandoz were transformed into an entirely new company. Using the merger as a catalyst for change, Vasella and his management team not only captured $1.4 billion in cost synergies but also redefined the company’s mission, strategy, portfolio, and organization, as well as all key processes, from research to sales. In every area, there was no automatic choice for either the Ciba or the Sandoz way of doing things; instead, the organization made a systematic effort to find the best way. Novartis shifted its strategic focus to innovation in its life sciences business (pharmaceuticals, nutrition, and products for agriculture) and spun off the $7 billion Ciba Specialty Chemicals business in 1997. Organizational changes included
  • 58. structuring R&D worldwide by therapeutic rather than geographic area, enabling Novartis to build a world-leading oncology franchise. Across all departments and management layers, Novartis created a strong performance-oriented culture supported by shifting from a seniority- to a performance-based compensation system for managers. Buy cheap The final way to create value from an acquisition is to buy cheap—in other words, at a price below a company’s intrinsic value. In our experience, however, such opportunities are rare and relatively small. Nonetheless, though market values revert to intrinsic values over longer periods, there can be brief moments when the two fall out of alignment. Markets, for example, sometimes overreact to negative news, such as a criminal investigation of
  • 59. an executive or the failure of a single product in a portfolio with many strong ones. Such moments are less rare in cyclical industries, where assets are often undervalued at the bottom of a cycle. Comparing actual market valuations with intrinsic values based on a “perfect foresight” model, we found that companies in cyclical industries could more than double their shareholder returns (relative to actual returns) if they acquired assets at the bottom of a cycle and sold at the top. While markets do throw up occasional opportunities for companies to buy targets at levels below their intrinsic value, we haven’t seen many cases. To gain control of a target, acquirers must pay its shareholders a premium over the current market value. Although premiums can vary widely, the average ones for corporate control have been
  • 60. 7The five types of successful acquisitions fairly stable: almost 30 percent of the preannouncement price of the target’s equity. For targets pursued by multiple acquirers, the premium rises dramatically, creating the so-called winner’s curse. If several companies evaluate a given target and all identify roughly the same potential synergies, the pursuer that overestimates them most will offer the highest price. Since it is based on an overestimation of the value to be created, the winner pays too much—and is ultimately a loser. Since market values can sometimes deviate from intrinsic ones, management must also beware the possibility that markets may be overvaluing a potential acquisition. Consider the stock market bubble during the late 1990s. Companies that
  • 61. merged with or acquired technology, media, or telecommunications businesses saw their share prices plummet when the market reverted to earlier levels. The possibility that a company might pay too much when the market is inflated deserves serious consideration, because M&A activity seems to rise following periods of strong market performance. If (and when) prices are artificially high, large improvements are necessary to justify an acquisition, even when the target can be purchased at no premium to market value. Premiums for private deals tend to be smaller, although comprehensive evidence is difficult to collect because publicly available data are scarce. Private acquisitions often stem from the seller’s desire to get out rather than the buyer’s desire for a purchase. By focusing on the types of acquisition strategies
  • 62. that have created value for acquirers in the past, managers can make it more likely that their acquisitions will create value for their shareholders. 1 Viral V. Acharya, Moritz Hahn, and Conor Kehoe, “Corporate governance and value creation: Evidence from private equity,” Social Science Research Network Working Paper, February 19, 2010. 2 IBM investor briefing, May 12, 2010 (www.ibm.com/investor/ events/investor0510/presentation/pres3.pdf). 3 Marco de Heer and Timothy M. Koller, “Valuing cyclical companies,” mckinseyquarterly.com, May 2000. 4 Kevin Rock, “Why new issues are underpriced,” Journal of Financial Economics, 1986, Volume 15, Number 1–2, pp. 187– 212. Marc Goedhart ([email protected]) is a consultant in McKinsey’s Amsterdam office, Tim Koller ([email protected]) is a partner in the New York office, and David Wessels, an alumnus of the New York office, is an adjunct professor of finance at the University of Pennsylvania’s Wharton School. This article is excerpted from Tim Koller, Marc Goedhart, and David Wessels, Valuation: Measuring and Managing the Value of Companies (fifth
  • 63. edition, Hoboken, NJ: John Wiley & Sons, August 2010). Tim Koller is also coauthor, with Richard Dobbs and Bill Huyett, of a forthcoming managers’ guide to value creation, titled Value: The Four Cornerstones of Corporate Finance (Hoboken, NJ: John Wiley & Sons, October 2010). Copyright © 2010 McKinsey & Company. All rights reserved. related files/1472378321.pptx Strategic Financial Analysis MBA Module 5 1 Session 4 School of Business 1 2 Session 4 Readings and assignments Have you tested your strategy lately?, McKinsey Quarterly, January 2011 (Bradley, et al) Why bad multiples happen to good companies, McKinsey Quarterly, May 2012 (Foushee, et al) Good Financial Analysts are Made, not Born and FP&A Peril: Too Much Data, Too Little Judgment, CFO.com, 6/20/2012 and 4/23/2012, respectively
  • 64. Pink, “The Truth About What Motivates Us, Aspen Ideas Festival, July 29, 2010 (a podcast – over one hour) PowerPoint deck in Bb (session 4) Activities in class Two merger paper presentations and “role teams” evaluate Discuss readings Goals Bring closure to merger paper assignment Answer any “open questions” on financial analysis and valuation Emphasize the importance of leadership in implementing a financially well grounded new strategic direction Answer any remaining questions about final paper and spreadsheet submission details School of Business 2 3 Merger Paper Presentations Creditors Activist Investors Investors Employees COO CFO CEO Presenters Use your paper to present your merger paper (no new .ppt slides) You have 15 minutes, including questions Be sure to focus on the rationale of the acquisition, going
  • 65. forward targets to ensure success, and risks (if you acquired PSMT). Role Teams Evaluate the proposal from your perspective, specifically noting the strength of the rationale, supporting data, and risk identification. What weaknesses do you see in the recommendation? Of the two proposals, which is stronger and why? What would you change about it before going to the BoD? School of Business 3 Final Readings – Discussion How Finance Dovetails with Strategy 4 School of Business 4 5 Bradley et al: Have you tested your strategy lately? * Article Overview What surprised you in this article? Do you know your company’s strategy, and how many of the tests does it pass? Which of the “test” are the most difficult to evaluate and why? Why do you think so few companies only “pass” four or fewer tests? Did any of the footnotes inspire you to read more on strategy? If so, which readings? * McKinsey Quarterly, January 2011
  • 66. _____________________________________________________ __________________________________ _____________________________________________________ __________________________________ _____________________________________________________ __________________________________ _____________________________________________________ __________________________________ _____________________________________________________ __________________________________ School of Business 5 6 Nolen et al: Why bad multiples happen to good companies * Article Overview What are your three key take-a-ways from this article? Why do you think the article was written? Any surprises for you in this material? What is “enterprise value”? Did you think about NewCo’s revenue growth after you read this article? What insight did you have? * Mckinsey Quarterly, May 2012 _____________________________________________________ __________________________________ _____________________________________________________ __________________________________ _____________________________________________________ __________________________________ _____________________________________________________ __________________________________ _____________________________________________________ __________________________________
  • 67. School of Business 6 7 McCann: Good Financial Analyst … & Too Much Data …* Article Overview What are your three key take-a-ways from these papers? On a scale of one to 10, 10 being the best, rate yourself as a financial analyst? Why did you give yourself this rating? Do these insights extend beyond financial analysis? Why or why not? * CFO.com, June 20th and April 23rd, 2012 _____________________________________________________ __________________________________ _____________________________________________________ __________________________________ _____________________________________________________ __________________________________ School of Business 7 8 Daniel Pink: The Truth About What Motivates Us? * Interesting points about the speech and speaking style ________________________________________________ ________________________________________________ ________________________________________________ ________________________________________________ ________________________________________________ ________________________________________________
  • 68. ________________________________________________ * Aspen Institute, July 29, 2010; Podcast from Aspen Public Radio – posted in Bb (it takes a while for the file to download before it starts) Insights on the scientific evidence of what motivates us ________________________________________________ ________________________________________________ ________________________________________________ ________________________________________________ ________________________________________________ ________________________________________________ ________________________________________________ What can motivation science say about financial management ________________________________________________ ________________________________________________ ________________________________________________ ________________________________________________ ________________________________________________ ________________________________________________ ________________________________________________ School of Business 8 Final Reminders 9 * Proofread before submitting your paper and spreadsheet on Blackboard Check for grammar – see “Examples of Poor Writing & How to Correct Them”
  • 69. Reread the rubric on your syllabus Follow the detailed instructions we have covered three times already QUALITATIVE EVALUATION Paper (MS Word’s .doc or .docx format only!) Cover sheet with Hamline ID # Executive Summary Page Maximum three additional pages using suggested headings Have you gone “beyond the numbers” to describe precisely how value can be created (or destroyed) by putting COST & PSMT together? Reference page (minimum 5 references from this course) QUANTITATIVE VALUATION Spreadsheet Don’t forget to add your Hamline ID # to the Summary Tab Don’t touch tabs 1 & 2 that we completed as a class Change 4-5 variables on Combined New Company Inc. Stmt. Do your changes from the weighted averages of COST and PSMT continuing to operate separately reflect the + or – synergies described in your paper? On the Summary tab is your NPV reasonable? Did you want to add a 5th tab? (DuPont analysis or WACC?) School of Business 9 Final Reminders (continued) 10 Submit paper and spreadsheet by deadline = 10:00 PM this Saturday night! Complete Course Evaluation on Hamline’s Piperline
  • 70. I’ll try to return your evaluated papers to you via e-mail by evening, Tuesday July 28th; and I should have all course grades posted on Piperline late that night. Best wishes to all of you as you come down the “home stretch” toward earning your MBA degree! David Christopherson School of Business 10 related files/1501597129.docx Grading Rubric for Individual Paper (merger paper – 400 possible points) Graded Elements & Relative Weighting (Share of 100%) Does not Meet Expectations Below 70% Approaches Expectations 70% - 79% Meets Expectations 80% - 89% Exceeds Expectations 90% - 100% Problem Formulation
  • 71. 20% Problems, issues, opportunities, or questions are identified and formulated comprehensively Fails to identify and formulate the problems, issues, opportunities, or questions 48 55 Recognizes one or more of the problems, but they are not stated correctly in all cases; may be confused as to some key information 56 63 Recognizes most of the problems and those seen are stated clearly and correctly, but formulation(s) are not comprehensive 64 71 Clearly identifies and formulates problems or issues and correctly summarizes implications and relationship among key factors 72 80 Information and Assumptions 10% Evidence, information quality and assumptions are evaluated Fails to assess the quality of data, and supporting evidence; does not identify key assumptions. 24 27 Available evidence is partially assessed but observations are limited and inadequate for the purpose used; key assumptions not explicitly stated 28 31
  • 72. Available data and other evidence are reasonably assessed; and observations are made upon the adequacy of that data; key assumptions are stated, but their implications may not be noted 32 35 The evidence sources are validated and examined for relevancy and completeness, and the information referenced is determined to be suitable for use; key assumptions and the implications related to their use are noted 36 40 Analytical Skill 30% Quantitative and / or qualitative analysis undertaken for problem solving (30) Quantitative or qualitative analysis is inappropriate, inaccurate or incomplete 72 43 Analysis is somewhat appropriate but elements fall-short or are inaccurate, limiting its usefulness for decision-making 84 95 Analysis is mostly appropriate and is a reasonable beginning that is likely to lead to useful decision-making 96 107 Analysis is appropriate, accurate and complete, and enables good decision-making 108 120 Communication of Recommendations 25% Communicates effectively well-reasoned, creative, useful, and logical recommendations No actions proposed and communication is limited and narrow; and or with a high number of grammatical errors
  • 73. 60 69 Proposes solutions are expressed somewhat completely, but communication falls short of being fully effective and compelling and/or grammatically correct 70 79 Proposed solutions are expressed clearly and completely in the whole, though supporting rationale may not be compelling and/or some grammar mistakes present 80 89 Logical and reasoned recommendations or solutions are advanced and communication is effective, grammatically correct, and acknowledging both limitations and broader implications 90 100 Alternatives Addressed 15% Alternative perspectives incorporated in the analysis Fails to recognize the perspective of others or that other potential decisions that are possible 36 41 Begins to address the perspective of others and attempts to address other decisions, but not comprehensively 42 47 Addresses the perspective of others and begins to address other potential solutions, but is not compelling 48 53 Fully integrates alternative perspectives and decisions in the
  • 74. analysis and justifies the actions proposed in relations to other options 54 60 related files/1941091412.docx Grading Rubric for Individual Paper (merger paper – 400 possible points) Graded Elements & Relative Weighting (Share of 100%) Does not Meet Expectations Below 70% Approaches Expectations 70% - 79% Meets Expectations 80% - 89% Exceeds Expectations 90% - 100% Problem Formulation 20% Problems, issues, opportunities, or questions are identified and formulated comprehensively Fails to identify and formulate the problems, issues, opportunities, or questions 48 55 Recognizes one or more of the problems, but they are not stated correctly in all cases; may be confused as to some key information 56 63
  • 75. Recognizes most of the problems and those seen are stated clearly and correctly, but formulation(s) are not comprehensive 64 71 Clearly identifies and formulates problems or issues and correctly summarizes implications and relationship among key factors 72 80 Information and Assumptions 10% Evidence, information quality and assumptions are evaluated Fails to assess the quality of data, and supporting evidence; does not identify key assumptions. 24 27 Available evidence is partially assessed but observations are limited and inadequate for the purpose used; key assumptions not explicitly stated 28 31 Available data and other evidence are reasonably assessed; and observations are made upon the adequacy of that data; key assumptions are stated, but their implications may not be noted 32 35 The evidence sources are validated and examined for relevancy and completeness, and the information referenced is determined to be suitable for use; key assumptions and the implications related to their use are noted 36 40 Analytical Skill 30%
  • 76. Quantitative and / or qualitative analysis undertaken for problem solving (30) Quantitative or qualitative analysis is inappropriate, inaccurate or incomplete 72 43 Analysis is somewhat appropriate but elements fall-short or are inaccurate, limiting its usefulness for decision-making 84 95 Analysis is mostly appropriate and is a reasonable beginning that is likely to lead to useful decision-making 96 107 Analysis is appropriate, accurate and complete, and enables good decision-making 108 120 Communication of Recommendations 25% Communicates effectively well-reasoned, creative, useful, and logical recommendations No actions proposed and communication is limited and narrow; and or with a high number of grammatical errors 60 69 Proposes solutions are expressed somewhat completely, but communication falls short of being fully effective and compelling and/or grammatically correct 70 79 Proposed solutions are expressed clearly and completely in the whole, though supporting rationale may not be compelling and/or some grammar mistakes present
  • 77. 80 89 Logical and reasoned recommendations or solutions are advanced and communication is effective, grammatically correct, and acknowledging both limitations and broader implications 90 100 Alternatives Addressed 15% Alternative perspectives incorporated in the analysis Fails to recognize the perspective of others or that other potential decisions that are possible 36 41 Begins to address the perspective of others and attempts to address other decisions, but not comprehensively 42 47 Addresses the perspective of others and begins to address other potential solutions, but is not compelling 48 53 Fully integrates alternative perspectives and decisions in the analysis and justifies the actions proposed in relations to other options 54 60 related files/202335146.xlsx Costco ISAnnual Income Statement * To Be Finalized July 16 2015Divd. Growth Model CAPMSales growth8.21%STUDENT ID #(Millions except for per
  • 78. share)Divd. Yield1.11%rf2.35%Gross profit margin12.60%gs5.99%Beta0.76SG&A % of sales8.90%COSTCO WHOLESALE CORPSIC: 5399 (Misc. General Mdse Stores)Mkt prem6.25% Tax rate35.00%999 Lake DriveGICS: 30101040 (Hypermarkets & Super Centers)E(Ret)7.10%RRR7.10%Chg. NWC % of sales0.50%Issaquah, WA 98027S&P Long-Term Issuer Credit Rating: A+Equibrium CAPM=DGM Price$ 144.33 WACC6.95%Ticker: COSTS&P Short-Term Issuer Credit Rating: Extremely Strong (A1)Market Price 7/16/2015$ 144.33RADR (WACC + 10%)7.65%Depr. % of Sales0.91% Cap Exp. % of Sales1.92%2009 Aug2010 Aug2011 Aug2012 Aug2013 Aug2014 AugCAGRAug-15Aug-16Aug-17Aug- 18Aug-19Aug-20Aug-21Aug-22Aug-232024 Aug2025Sales71,44977,94688,91599,137105,156112,6409.5%1 21,888131,895142,723154,441167,120180,841195,688211,7542 29,139247,951Cost of Goods Sold61,60767,99577,73986,82391,94898,4589.8%106,530115,2 76124,740134,981146,063158,055171,031185,073200,268216,7 10Gross Profit9,8429,95111,17612,31413,20814,1827.6%15,35816,6191 7,98319,46021,05722,78624,65726,68128,87231,242Selling, General, & Administrative Exp.7,3037,0797,8828,6479,2099,9336.3%10,84811,73912,7021 3,74514,87416,09517,41618,84620,39322,068Depreciation, Depletion, & Amortization7287958559089461,0297.2%1,1091,2001,2991,405 1,5211,6461,7811,9272,0852,256- 0Operating Profit (EBIT)1,8112,0772,4392,7593,0533,22012.2%3,4013,6803,9824 ,3094,6635,0455,4605,9086,3936,918Interest Expense1161111169599113-0.5%Non-Operating Income / Expense538860103979011.2%Special Items and other72001700Pretax Income1,7142,0542,3832,7503,0513,19713.3%Total Income Taxes6287318411,0009901,10912.0%Less Non-Cont. Int. Adj.02080412245Adjusted Net
  • 79. Income1,0861,3031,4621,7092,0392,04313.5%EPS Basic from Operations2.552.973.353.944.684.6913.0%EPS Diluted from Operations2.522.923.303.894.634.6513.0%Dividends Per Share0.680.770.891.031.101.331.60Com Shares for Basic EPS433.988438.611436.119433.620435.741438.692Com Shares for Diluted EPS440.454445.970443.094439.373440.512442.490NOPAT2,21 02,3922,5882,8013,0313,2803,5493,8404,1554,497Depreciation 1,1091,2001,2991,4051,5211,6461,7811,9272,0852,256Change in NWC46505459636974808794CAGR for FCFCap Exp.2,3402,5322,7402,9653,2093,4723,7574,0664,3994,7618.21 %Free cash flow9331,0101,0931,1821,2791,3841,4981,6211,7541,8982,054 2025 Terminal Value >>>>>>>124,220Discount Factor0.9350.8740.8170.7640.7150.6680.6250.5840.5460.5110. 478Discounted CF872883893904914925936947958969Sum of 1-10 DCF's9,202Disc. Terminal Value59,320Sensitivity analysis with WACC and growth ratesTotal of all DCF's68,523Less Debt4,929Intrinsic Equity Val.63,594DCF/Share144.36 PSMT ISAnnual Income Statement * To Be Finalized July 16 2015Divd. Growth Model CAPMSales growth13.00%STUDENT ID #(Millions except for per share)Divd. Yield0.70%rf2.35%Gross profit margin17.00%gs10.59%Beta1.43SG&A % of sales8.450%PRICESMART INC.Mkt prem6.25% Tax rate32.75%9740 Scranton RoadE(Ret)11.29%RRR11.29%NWC % of sales1.00%San Diego, CA 92121Equibrium CAPM=DGM Price$ 100.61 WACC10.76%Ticker: PSMTMarket Price 7/16/2015$ 100.61RADR (WACC + 10%)11.84%Fiscal Year: 8Depr. % Sales1.35%Cap. Ex. % Sales1.40%2009 Aug2010 Aug2011 Aug2012 Aug2013 Aug2014 AugCAGRAug-15Aug- 16Aug-17Aug-18Aug-19Aug-20Aug-21Aug-22Aug-232024 Aug2025Sales1,2521,3961,7142,0512,3002,51810.4%2,8453,21 53,6334,1064,6395,2425,9246,6947,5648,548Cost of Goods Sold1,0341,1601,4311,7191,9292,11410.7%2,3622,6693,0163,4 083,8514,3514,9175,5566,2787,094Gross
  • 80. Profit2172362833323714048.8%4845476186987898911,0071,13 81,2861,453Selling, General, & Administrative Exp.1321461742002182388.7%240272307347392443501566639 722Depreciation, Depletion, & Amortization14151924242811.5%38495563718090102115Opera ting Profit (EBIT)7275901081291388.5%2052752622963343774274825456 15Interest Expense334644Non-Operating Income / Expense000020Special Items and other003100Pretax Income687289103123134Total Income Taxes192327353941(Adjustments)200000Adjusted Net Income474962688493EPS Basic from Operations1.461.662.002.242.783.07EPS Diluted from Operations1.451.652.002.242.783.07Dividends Per Share0.500.500.600.600.600.600.70Com Shares for Basic EPS28.95929.25429.44129.55429.6529.75Com Shares for Diluted EPS29.18129.27929.45029.56629.6829.76NOPAT13818517619 9225254287324366414Depreciation380495563718090102115Ch ange in NWC34455678910CAGR for FCFCap Exp.404551576573839410612013.00%Free cash flow133136170192217245277313354400452 2025 Terminal Value >>>>>>>5,416Discount Factor0.9030.8150.7360.6640.6000.5420.4890.4420.3990.3600. 325Discounted CF120111125128130133135138141144Sum of 1-10 DCF's1,305Disc. Terminal Value1,760Sensitivity analysis with WACC and growth ratesTotal of all DCF's3,065Less Debt90Intrinsic Equity Val.2,975DCF/Share100.63 Combined ISCombined Pro Forma Income Statement - Projections Assuming Costco Acquires PriceSmartAssumptions:Sales growth8.42%Gs6.0835% Fill in your 10 assumptions about positive or negative Gross profit margin12.80% synergy by changing any of the cells shaded in blue to the left.SG&A % of sales8.88%Weights<<<<====Tax rate34.90%0.95531COSTNWC % of sales0.52%0.04469PSMTWACC7.12%RADR (WACC +
  • 81. 10%)7.83%Depr. % Sales0.93%Cap. Ex. % Sales1.90%Aug- 15Aug-16Aug-17Aug-18Aug-19Aug-20Aug-21Aug-22Aug- 232024 AugCAGR2025Sales124,733135,241146,633158,986172,379186 ,900202,645219,716238,225258,2938.42%Cost of Goods Sold108,771117,934127,869138,641150,320162,983176,713191 ,600207,740225,2418.42%Gross Profit15,96217,30618,76420,34522,05923,91725,93228,11630,4 8533,0538.42%Selling, General, & Administrative Exp.11,07612,00913,02114,11815,30716,59717,99519,51121,15 422,9368.42%Depreciation, Depletion, & Amortization1,1601,2571,3631,4781,6031,7381,8842,0432,2152 ,4018.42%Operating Profit (EBIT)3,7264,0404,3804,7495,1495,5836,0536,5637,1167,7158. 42%NOPAT2,4262,6302,8513,0923,3523,6343,9414,2734,6335, 0238.42%Depreciation1,1601,2571,3631,4781,6031,7381,8842, 0432,2152,4018.42%Change in NWC9255606570768289971051.52%CapEx2,3662,5652,7813,0 163,2703,5453,8444,1674,5194,8998.42%Free cash flow1,1281,2671,3741,4901,6151,7511,8992,0592,2322,4208.85 %2,634119,559Discount factor0.9340.8710.8140.7590.7090.6620.6180.5770.5380.503Di scounted CF1,0531,1041,1181,1311,1451,1591,1731,1871,2021,216Sum of DCF yrs 1-10)11,489DCF of terminal perp.60,099Total of all DCFs71,588 Less Debt5,019Intrinsic Equity Value66,569DCF per share 150.4414107145Total Shares442.490costco is 19 times bigger than coscto SummaryPresent value of Costco (PV-C)63,594July 16 2015STUDENT ID #NOTE: All numbers in millions of USD.Present value of Pricesmart (PV-P)2,975PV of C and P alone66,569 Baseline value to exceed separatePresent value of C & P Combined (PV-C&P)66,569 Synergies included here (revenue, costs, efficiency, etc.)togetherGain in value with synergies-0 % gain-0.0%Cash to be paid for PriceSmart3,868 Premium = 30% (if PV = market value) (change if you
  • 82. like)Premium Cost (cash paid - PV-PS)893Overall NPV (+ gain or - loss)(893) Sheet1 related files/243990533.xlsx Costco ISAnnual Income Statement * To Be Finalized July 16 2015Divd. Growth Model CAPMSales growth8.21%STUDENT ID #(Millions except for per share)Divd. Yield1.11%rf2.35%Gross profit margin12.60%gs5.99%Beta0.76SG&A % of sales8.90%COSTCO WHOLESALE CORPSIC: 5399 (Misc. General Mdse Stores)Mkt prem6.25% Tax rate35.00%999 Lake DriveGICS: 30101040 (Hypermarkets & Super Centers)E(Ret)7.10%RRR7.10%Chg. NWC % of sales0.50%Issaquah, WA 98027S&P Long-Term Issuer Credit Rating: A+Equibrium CAPM=DGM Price$ 144.33 WACC6.95%Ticker: COSTS&P Short-Term Issuer Credit Rating: Extremely Strong (A1)Market Price 7/16/2015$ 144.33RADR (WACC + 10%)7.65%Depr. % of Sales0.91% Cap Exp. % of Sales1.92%2009 Aug2010 Aug2011 Aug2012 Aug2013 Aug2014 AugCAGRAug-15Aug-16Aug-17Aug- 18Aug-19Aug-20Aug-21Aug-22Aug-232024 Aug2025Sales71,44977,94688,91599,137105,156112,6409.5%1 21,888131,895142,723154,441167,120180,841195,688211,7542 29,139247,951Cost of Goods Sold61,60767,99577,73986,82391,94898,4589.8%106,530115,2 76124,740134,981146,063158,055171,031185,073200,268216,7 10Gross Profit9,8429,95111,17612,31413,20814,1827.6%15,35816,6191 7,98319,46021,05722,78624,65726,68128,87231,242Selling, General, & Administrative Exp.7,3037,0797,8828,6479,2099,9336.3%10,84811,73912,7021 3,74514,87416,09517,41618,84620,39322,068Depreciation, Depletion, & Amortization7287958559089461,0297.2%1,1091,2001,2991,405 1,5211,6461,7811,9272,0852,256- 0Operating Profit
  • 83. (EBIT)1,8112,0772,4392,7593,0533,22012.2%3,4013,6803,9824 ,3094,6635,0455,4605,9086,3936,918Interest Expense1161111169599113-0.5%Non-Operating Income / Expense538860103979011.2%Special Items and other72001700Pretax Income1,7142,0542,3832,7503,0513,19713.3%Total Income Taxes6287318411,0009901,10912.0%Less Non-Cont. Int. Adj.02080412245Adjusted Net Income1,0861,3031,4621,7092,0392,04313.5%EPS Basic from Operations2.552.973.353.944.684.6913.0%EPS Diluted from Operations2.522.923.303.894.634.6513.0%Dividends Per Share0.680.770.891.031.101.331.60Com Shares for Basic EPS433.988438.611436.119433.620435.741438.692Com Shares for Diluted EPS440.454445.970443.094439.373440.512442.490NOPAT2,21 02,3922,5882,8013,0313,2803,5493,8404,1554,497Depreciation 1,1091,2001,2991,4051,5211,6461,7811,9272,0852,256Change in NWC46505459636974808794CAGR for FCFCap Exp.2,3402,5322,7402,9653,2093,4723,7574,0664,3994,7618.21 %Free cash flow9331,0101,0931,1821,2791,3841,4981,6211,7541,8982,054 2025 Terminal Value >>>>>>>124,220Discount Factor0.9350.8740.8170.7640.7150.6680.6250.5840.5460.5110. 478Discounted CF872883893904914925936947958969Sum of 1-10 DCF's9,202Disc. Terminal Value59,320Sensitivity analysis with WACC and growth ratesTotal of all DCF's68,523Less Debt4,929Intrinsic Equity Val.63,594DCF/Share144.36 PSMT ISAnnual Income Statement * To Be Finalized July 16 2015Divd. Growth Model CAPMSales growth13.00%STUDENT ID #(Millions except for per share)Divd. Yield0.70%rf2.35%Gross profit margin17.00%gs10.59%Beta1.43SG&A % of sales8.450%PRICESMART INC.Mkt prem6.25% Tax rate32.75%9740 Scranton RoadE(Ret)11.29%RRR11.29%NWC % of sales1.00%San Diego, CA 92121Equibrium CAPM=DGM Price$ 100.61 WACC10.76%Ticker: PSMTMarket Price
  • 84. 7/16/2015$ 100.61RADR (WACC + 10%)11.84%Fiscal Year: 8Depr. % Sales1.35%Cap. Ex. % Sales1.40%2009 Aug2010 Aug2011 Aug2012 Aug2013 Aug2014 AugCAGRAug-15Aug- 16Aug-17Aug-18Aug-19Aug-20Aug-21Aug-22Aug-232024 Aug2025Sales1,2521,3961,7142,0512,3002,51810.4%2,8453,21 53,6334,1064,6395,2425,9246,6947,5648,548Cost of Goods Sold1,0341,1601,4311,7191,9292,11410.7%2,3622,6693,0163,4 083,8514,3514,9175,5566,2787,094Gross Profit2172362833323714048.8%4845476186987898911,0071,13 81,2861,453Selling, General, & Administrative Exp.1321461742002182388.7%240272307347392443501566639 722Depreciation, Depletion, & Amortization14151924242811.5%38495563718090102115Opera ting Profit (EBIT)7275901081291388.5%2052752622963343774274825456 15Interest Expense334644Non-Operating Income / Expense000020Special Items and other003100Pretax Income687289103123134Total Income Taxes192327353941(Adjustments)200000Adjusted Net Income474962688493EPS Basic from Operations1.461.662.002.242.783.07EPS Diluted from Operations1.451.652.002.242.783.07Dividends Per Share0.500.500.600.600.600.600.70Com Shares for Basic EPS28.95929.25429.44129.55429.6529.75Com Shares for Diluted EPS29.18129.27929.45029.56629.6829.76NOPAT13818517619 9225254287324366414Depreciation380495563718090102115Ch ange in NWC34455678910CAGR for FCFCap Exp.404551576573839410612013.00%Free cash flow133136170192217245277313354400452 2025 Terminal Value >>>>>>>5,416Discount Factor0.9030.8150.7360.6640.6000.5420.4890.4420.3990.3600. 325Discounted CF120111125128130133135138141144Sum of 1-10 DCF's1,305Disc. Terminal Value1,760Sensitivity analysis with WACC and growth ratesTotal of all DCF's3,065Less Debt90Intrinsic Equity Val.2,975DCF/Share100.63
  • 85. Combined ISCombined Pro Forma Income Statement - Projections Assuming Costco Acquires PriceSmartAssumptions:Sales growth8.42%Gs6.0835% Fill in your 10 assumptions about positive or negative Gross profit margin12.80% synergy by changing any of the cells shaded in blue to the left.SG&A % of sales8.88%Weights<<<<====Tax rate34.90%0.95531COSTNWC % of sales0.52%0.04469PSMTWACC7.12%RADR (WACC + 10%)7.83%Depr. % Sales0.93%Cap. Ex. % Sales1.90%Aug- 15Aug-16Aug-17Aug-18Aug-19Aug-20Aug-21Aug-22Aug- 232024 AugCAGR2025Sales124,733135,241146,633158,986172,379186 ,900202,645219,716238,225258,2938.42%Cost of Goods Sold108,771117,934127,869138,641150,320162,983176,713191 ,600207,740225,2418.42%Gross Profit15,96217,30618,76420,34522,05923,91725,93228,11630,4 8533,0538.42%Selling, General, & Administrative Exp.11,07612,00913,02114,11815,30716,59717,99519,51121,15 422,9368.42%Depreciation, Depletion, & Amortization1,1601,2571,3631,4781,6031,7381,8842,0432,2152 ,4018.42%Operating Profit (EBIT)3,7264,0404,3804,7495,1495,5836,0536,5637,1167,7158. 42%NOPAT2,4262,6302,8513,0923,3523,6343,9414,2734,6335, 0238.42%Depreciation1,1601,2571,3631,4781,6031,7381,8842, 0432,2152,4018.42%Change in NWC9255606570768289971051.52%CapEx2,3662,5652,7813,0 163,2703,5453,8444,1674,5194,8998.42%Free cash flow1,1281,2671,3741,4901,6151,7511,8992,0592,2322,4208.85 %2,634119,559Discount factor0.9340.8710.8140.7590.7090.6620.6180.5770.5380.503Di scounted CF1,0531,1041,1181,1311,1451,1591,1731,1871,2021,216Sum of DCF yrs 1-10)11,489DCF of terminal perp.60,099Total of all DCFs71,588 Less Debt5,019Intrinsic Equity Value66,569DCF per share 150.4414107145Total Shares442.490costco is 19 times bigger than coscto
  • 86. SummaryPresent value of Costco (PV-C)63,594July 16 2015STUDENT ID #NOTE: All numbers in millions of USD.Present value of Pricesmart (PV-P)2,975PV of C and P alone66,569 Baseline value to exceed separatePresent value of C & P Combined (PV-C&P)66,569 Synergies included here (revenue, costs, efficiency, etc.)togetherGain in value with synergies-0 % gain-0.0%Cash to be paid for PriceSmart3,868 Premium = 30% (if PV = market value) (change if you like)Premium Cost (cash paid - PV-PS)893Overall NPV (+ gain or - loss)(893) Sheet1 related files/469290633.pdf McKinsey on Finance Number 36, Summer 2010 Perspectives on Corporate Finance and Strategy Why Asia’s banks underperform at M&A 21 Five ways CFOs can make cost cuts stick 25 The right way
  • 87. to hedge 32 A singular moment for merger value? 8 The five types of successful acquisitions 2 McKinsey conversations with global leaders: David Rubenstein of The Carlyle Group 10 2 There is no magic formula to make acquisitions successful. Like any other business process, they are not inherently good or bad, just as marketing and R&D aren’t. Each deal must have its own strategic logic. In our experience, acquirers in the
  • 88. most successful deals have specific, well- articulated value creation ideas going in. For less successful deals, the strategic rationales—such as pursuing international scale, filling portfolio gaps, or building a third leg of the portfolio—tend to be vague. Empirical analysis of specific acquisition strategies offers limited insight, largely because of the wide variety of types and sizes of acquisitions and the lack of an objective way to classify them by strategy. What’s more, the stated strategy may not Marc Goedhart, Tim Koller, and David Wessels The five types of successful acquisitions even be the real one: companies typically talk up all kinds of strategic benefits from acquisitions that
  • 89. are really entirely about cost cutting. In the absence of empirical research, our suggestions for strategies that create value reflect our acquisitions work with companies. In our experience, the strategic rationale for an acquisition that creates value typically conforms to at least one of the following five archetypes: improving the performance of the target company, removing excess capacity from an industry, creating market access for products, acquiring skills or technologies more quickly or at lower cost than they could be built in-house, and picking winners early and helping them develop their businesses. If an acquisition does not fit one or Companies advance myriad strategies for creating value with acquisitions—but only a handful are likely to do so. 3
  • 90. more of these archetypes, it’s unlikely to create value. Executives, of course, often justify acquisitions by choosing from a much broader menu of strategies, including roll-ups, consolidating to improve competitive behavior, transformational mergers, and buying cheap. While these strategies can create value, we find that they seldom do. Value-minded executives should view them with a gimlet eye. Five archetypes An acquisition’s strategic rationale should be a specific articulation of one of these archetypes, not a vague concept like growth or strategic positioning, which may be important but must be translated into something more tangible. Furthermore, even if your acquisition is based on one of the archetypes below, it won’t create value if you overpay.
  • 91. Improve the target company’s performance Improving the performance of the target company is one of the most common value-creating acquisition strategies. Put simply, you buy a company and radically reduce costs to improve margins and cash flows. In some cases, the acquirer may also take steps to accelerate revenue growth. Pursuing this strategy is what the best private- equity firms do. Among successful private-equity acquisitions in which a target company was bought, improved, and sold, with no additional acquisitions along the way, operating-profit margins increased by an average of about 2.5 percentage points more than those at peer companies during the same period. This means that many of the transactions increased operating-profit margins even more. Keep in mind that it is easier to improve the
  • 92. performance of a company with low margins and low returns on invested capital (ROIC) than that of a high-margin, high-ROIC company. Consider a target company with a 6 percent operating-profit margin. Reducing costs by three percentage points, to 91 percent of revenues, from 94 percent, increases the margin to 9 percent and could lead to a 50 percent increase in the company’s value. In contrast, if the operating-profit margin of a company is 30 percent, increasing its value by 50 percent requires increasing the margin to 45 percent. Costs would need to decline from 70 percent of revenues to 55 percent, a 21 percent reduction in the cost base. That might not be reasonable to expect. Consolidate to remove excess capacity from industry As industries mature, they typically develop excess
  • 93. capacity. In chemicals, for example, companies are constantly looking for ways to get more production out of their plants, while new competitors continue to enter the industry. For example, Saudi Basic Industries Corporation (SABIC), which began production in the mid-1980s, grew from 6.3 million metric tons of value-added commodities—such as chemicals, polymers, and fertilizers—in 1985 to 56 million tons in 2008. Now one of the world’s largest petrochemicals concerns, SABIC expects continued growth, estimating its annual production to reach 135 million tons by 2020. The combination of higher production from existing capacity and new capacity from recent entrants often generates more supply than demand. It is in no individual competitor’s interest to shut a plant, however. Companies often find it easier to shut plants across the larger combined entity
  • 94. resulting from an acquisition than to shut their least productive plants without one and end up with a smaller company. Reducing excess in an industry can also extend to less tangible forms of capacity. Consolidation in 4 McKinsey on Finance Number 36, Summer 2010 the pharmaceutical industry, for example, has significantly reduced the capacity of the sales force as the product portfolios of merged companies change and they rethink how to interact with doctors. Pharmaceutical companies have also significantly reduced their R&D capacity as they found more productive ways to conduct research and pruned their portfolios of development projects. While there is substantial value to be created from removing excess capacity, as in most M&A activity
  • 95. the bulk of the value often accrues to the seller’s shareholders, not the buyer’s. Accelerate market access for the target’s (or buyer’s) products Often, relatively small companies with innovative products have difficulty reaching the entire potential market for their products. Small pharmaceutical companies, for example, typically lack the large sales forces required to cultivate relationships with the many doctors they need to promote their products. Bigger pharmaceutical companies sometimes purchase these smaller companies and use their own large-scale sales forces to accelerate the sales of the smaller companies’ products. IBM, for instance, has pursued this strategy in its software business. From 2002 to 2009, it acquired 70 companies for about $14 billion. By pushing
  • 96. their products through a global sales force, IBM estimates it increased their revenues by almost 50 percent in the first two years after each acquisition and an average of more than 10 percent in the next three years. In some cases, the target can also help accelerate the acquirer’s revenue growth. In Procter & Gamble’s acquisition of Gillette, the combined company benefited because P&G had stronger sales in some emerging markets, Gillette in others. Working together, they introduced their products into new markets much more quickly. Get skills or technologies faster or at lower cost than they can be built Cisco Systems has used acquisitions to close gaps in its technologies, allowing it to assemble a broad line of networking products and to grow very quickly from a company with a single product line
  • 97. into the key player in Internet equipment. From 1993 to 2001, Cisco acquired 71 companies, at an average price of approximately $350 million. Cisco’s sales increased from $650 million in 1993 to $22 billion in 2001, with nearly 40 percent of its 2001 revenue coming directly from these acquisitions. By 2009, Cisco had more than $36 billion in revenues and a market cap of approximately $150 billion. Pick winners early and help them develop their businesses The final winning strategy involves making acquisitions early in the life cycle of a new industry or product line, long before most others recognize that it will grow significantly. Johnson & Johnson pursued this strategy in its early acquisitions of medical-device businesses. When J&J bought device manufacturer Cordis, in 1996, Cordis had
  • 98. $500 million in revenues. By 2007, its revenues had increased to $3.8 billion, reflecting a 20 percent annual growth rate. J&J purchased orthopedic- device manufacturer DePuy in 1998, when DePuy had $900 million in revenues. By 2007, they had grown to $4.6 billion, also at an annual growth rate of 20 percent. This acquisition strategy requires a disciplined approach by management in three dimensions. First, you must be willing to make investments early, long before your competitors and the market see the industry’s or company’s potential. Second, 5The five types of successful acquisitions you need to make multiple bets and to expect that some will fail. Third, you need the skills and patience to nurture the acquired businesses. Harder strategies
  • 99. Beyond the five main acquisition strategies we’ve explored, a handful of others can create value, though in our experience they do so relatively rarely. Roll-up strategy Roll-up strategies consolidate highly fragmented markets where the current competitors are too small to achieve scale economies. Beginning in the 1960s, Service Corporation International, for instance, grew from a single funeral home in Houston to more than 1,400 funeral homes and cemeteries in 2008. Similarly, Clear Channel Communications rolled up the US market for radio stations, eventually owning more than 900. This strategy works when businesses as a group can realize substantial cost savings or achieve higher revenues than individual businesses can. Service Corporation’s funeral homes in a given city
  • 100. can share vehicles, purchasing, and back-office operations, for example. They can also coordinate advertising across a city to reduce costs and raise revenues. Size per se is not what creates a successful roll-up; what matters is the right kind of size. For Service Corporation, multiple locations in individual cities have been more important than many branches spread over many cities, because the cost savings (such as sharing vehicles) can be realized only if the branches are near one another. Roll-up strategies are hard to disguise, so they invite copycats. As others tried to imitate Service Corporation’s strategy, prices for some funeral homes were eventually bid up to levels that made additional acquisitions uneconomic. Consolidate to improve competitive behavior Many executives in highly competitive industries
  • 101. hope consolidation will lead competitors to focus 6 McKinsey on Finance Number 36, Summer 2010 less on price competition, thereby improving the ROIC of the industry. The evidence shows, however, that unless it consolidates to just three or four companies and can keep out new entrants, pricing behavior doesn’t change: smaller businesses or new entrants often have an incentive to gain share through lower prices. So in an industry with, say, ten companies, lots of deals must be done before the basis of competition changes. Enter into a transformational merger A commonly mentioned reason for an acquisition or merger is the desire to transform one or both companies. Transformational mergers are rare, however, because the circumstances have to be just right, and the management team needs to execute
  • 102. the strategy well. Transformational mergers can best be described by example. One of the world’s leading pharmaceutical companies, Switzerland’s Novartis, was formed in 1996 by the $30 billion merger of Ciba-Geigy and Sandoz. But this merger was much more than a simple combination of businesses: under the leadership of the new CEO, Daniel Vasella, Ciba-Geigy and Sandoz were transformed into an entirely new company. Using the merger as a catalyst for change, Vasella and his management team not only captured $1.4 billion in cost synergies but also redefined the company’s mission, strategy, portfolio, and organization, as well as all key processes, from research to sales. In every area, there was no automatic choice for either the Ciba or the Sandoz way of doing things; instead, the organization made a systematic effort to find
  • 103. the best way. Novartis shifted its strategic focus to innovation in its life sciences business (pharmaceuticals, nutrition, and products for agriculture) and spun off the $7 billion Ciba Specialty Chemicals business in 1997. Organizational changes included structuring R&D worldwide by therapeutic rather than geographic area, enabling Novartis to build a world-leading oncology franchise. Across all departments and management layers, Novartis created a strong performance-oriented culture supported by shifting from a seniority- to a performance-based compensation system for managers. Buy cheap The final way to create value from an acquisition is to buy cheap—in other words, at a price below a company’s intrinsic value. In our experience,
  • 104. however, such opportunities are rare and relatively small. Nonetheless, though market values revert to intrinsic values over longer periods, there can be brief moments when the two fall out of alignment. Markets, for example, sometimes overreact to negative news, such as a criminal investigation of an executive or the failure of a single product in a portfolio with many strong ones. Such moments are less rare in cyclical industries, where assets are often undervalued at the bottom of a cycle. Comparing actual market valuations with intrinsic values based on a “perfect foresight” model, we found that companies in cyclical industries could more than double their shareholder returns (relative to actual returns) if they acquired assets at the bottom of a cycle and sold at the top. While markets do throw up occasional
  • 105. opportunities for companies to buy targets at levels below their intrinsic value, we haven’t seen many cases. To gain control of a target, acquirers must pay its shareholders a premium over the current market value. Although premiums can vary widely, the average ones for corporate control have been 7The five types of successful acquisitions fairly stable: almost 30 percent of the preannouncement price of the target’s equity. For targets pursued by multiple acquirers, the premium rises dramatically, creating the so-called winner’s curse. If several companies evaluate a given target and all identify roughly the same potential synergies, the pursuer that overestimates them most will offer the highest price. Since it is based on an overestimation of the value to be created, the winner pays too much—and is
  • 106. ultimately a loser. Since market values can sometimes deviate from intrinsic ones, management must also beware the possibility that markets may be overvaluing a potential acquisition. Consider the stock market bubble during the late 1990s. Companies that merged with or acquired technology, media, or telecommunications businesses saw their share prices plummet when the market reverted to earlier levels. The possibility that a company might pay too much when the market is inflated deserves serious consideration, because M&A activity seems to rise following periods of strong market performance. If (and when) prices are artificially high, large improvements are necessary to justify an acquisition, even when the target can be purchased at no premium to market value. Premiums for private deals tend to be smaller,
  • 107. although comprehensive evidence is difficult to collect because publicly available data are scarce. Private acquisitions often stem from the seller’s desire to get out rather than the buyer’s desire for a purchase. By focusing on the types of acquisition strategies that have created value for acquirers in the past, managers can make it more likely that their acquisitions will create value for their shareholders. 1 Viral V. Acharya, Moritz Hahn, and Conor Kehoe, “Corporate governance and value creation: Evidence from private equity,” Social Science Research Network Working Paper, February 19, 2010. 2 IBM investor briefing, May 12, 2010 (www.ibm.com/investor/ events/investor0510/presentation/pres3.pdf). 3 Marco de Heer and Timothy M. Koller, “Valuing cyclical companies,” mckinseyquarterly.com, May 2000. 4 Kevin Rock, “Why new issues are underpriced,” Journal of Financial Economics, 1986, Volume 15, Number 1–2, pp. 187– 212.
  • 108. Marc Goedhart ([email protected]) is a consultant in McKinsey’s Amsterdam office, Tim Koller ([email protected]) is a partner in the New York office, and David Wessels, an alumnus of the New York office, is an adjunct professor of finance at the University of Pennsylvania’s Wharton School. This article is excerpted from Tim Koller, Marc Goedhart, and David Wessels, Valuation: Measuring and Managing the Value of Companies (fifth edition, Hoboken, NJ: John Wiley & Sons, August 2010). Tim Koller is also coauthor, with Richard Dobbs and Bill Huyett, of a forthcoming managers’ guide to value creation, titled Value: The Four Cornerstones of Corporate Finance (Hoboken, NJ: John Wiley & Sons, October 2010). Copyright © 2010 McKinsey & Company. All rights reserved. related files/485230635.docx Good Financial Analysts Are Made, Not Born They probably won’t know what effective analysis looks like when they show up for work, so CFOs have to teach them. Here’s how. David McCann CFOs who are looking to expand their roster of financial analysts, and not finding as many high-quality ones as they want, perhaps should assign some of the blame to themselves. Rather than simply seek top talent, companies should also impose “rules of engagement” on those they hire that are likely to result in superior-quality analysis, according to the Corporate
  • 109. Executive Board (CEB), a membership-based research organization. Many finance teams struggle to define the skills and behaviors that will deliver effective analytic support, CEB says. They often use generic descriptions of desired analyst skills, such as “thinks critically,” “influences business partners,” or “fosters innovation.” As a result, they may inadequately develop their financial-planning-and-analysis (FP&A) staffs. The best companies, CEB says, describe more specific behaviors and techniques they want their analysts to demonstrate, such as “challenges conventional ideas in both group and one-on-one settings,” “proposes clear action steps,” and “focuses on cause-and-effect relationships between observable factors.” “Financial analysts may come out of MBA or undergrad programs with good, finance-oriented analytical toolboxes, but they don’t necessarily have a good sense for how to produce analysis that’s easily consumable by senior executives and business partners,” says Tim Raiswell, a senior research director for the CEB Finance Leadership Council. “One thing that differentiates great organizations is having rules of engagement for what good analysis and a good analytic process look like.” For example, CFOs could have a rule that they won’t even look at an analyst’s report unless it begins with the one thing they need to take away from the analysis or actions the company or business lines should take as a result of the analyst’s findings. CEB came to its insights through qualitative research that consisted largely of extensive interviews with 70 corporate FP&A heads, as well as academics and consultants. Based on that research, it recommends a methodology for analysts to follow that it calls “insight as a process,” which consists of three key principles. The first principle is that all analysis should include both inductive and deductive elements. Inductive analysis, also called pattern analysis, involves seeing patterns in data and