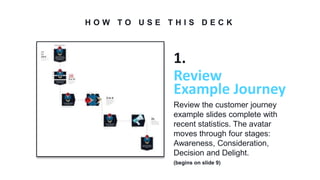
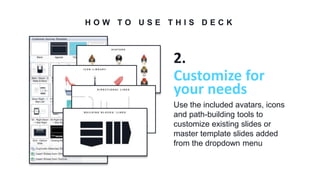
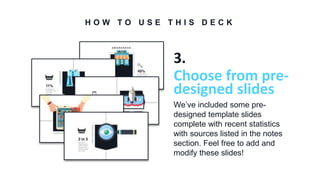
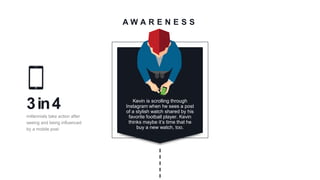
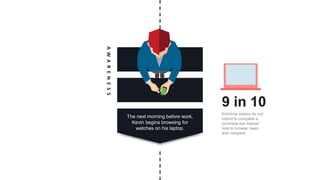
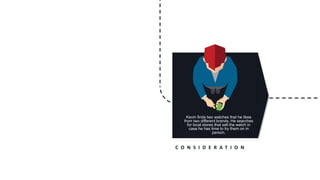
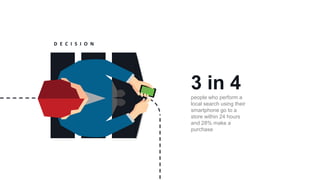
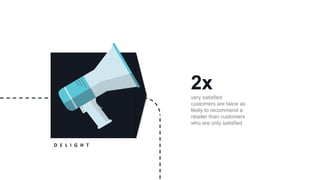
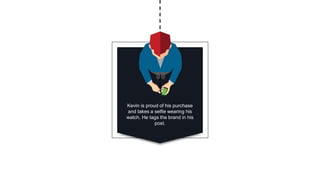
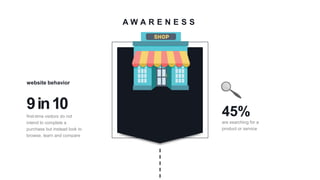
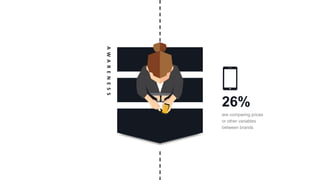
Presented by
RETAIL CUSTOMER JOURNEY
TEMPLATE
P U R C H A S I N G PAT H
Device-Centric View User-Centric View
“The new path
demands a new view”
“Consumers use multiple devices in
the buying journey, from searching
and browsing to buying.
Device-Centric: Traditional analytics
tools look at activities on a single
device, providing only a partial and
distorted view of a multidevice journey.
User-Centric: Only advanced cross-
device measurement can accurately
follow the buyer across devices and
capture full-journey behavior and
intent.”
SOURCE: CRITEO, STATE OF CROSS-DEVICE COMMERCE H2 2016
+ HOW TO USE THIS DECK
+ CUSTOMER JOURNEY TEMPLATE & EXAMPLE
+ TEMPLATE SLIDES WITH RECENT STATISTICS
+ RESOURCES
CONTENTS
HOW TO USE THIS DECK
H O W T O U S E T H I S D E C K
Review the customer journey
example slides complete with
recent statistics. The avatar
moves through four stages:
Awareness, Consideration,
Decision and Delight.
1.
Review
Example Journey
(begins on slide 9)
H O W T O U S E T H I S D E C K
Use the included avatars, icons
and path-building tools to
customize existing slides or
master template slides added
from the dropdown menu
2.
Customize for
your needs
H O W T O U S E T H I S D E C K
We’ve included some pre-
designed template slides
complete with recent statistics
with sources listed in the notes
section. Feel free to add and
modify these slides!
3.
Choose from pre-
designed slides
CUSTOMER JOURNEY TEMPLATE
& EXAMPLE
Kevin is scrolling through
Instagram when he sees a post
of a stylish watch shared by his
favorite football player. Kevin
thinks maybe it’s time that he
buy a new watch, too.
A W A R E N E S S
3in4
millennials take action after
seeing and being influenced
by a mobile post
9 in 10
first-time visitors do not
intend to complete a
purchase but instead
look to browse, learn
and compare
The next morning before work,
Kevin begins browsing for
watches on his laptop.
AWARENESS
C O N S I D E R A T I O N
Kevin finds two watches that he likes
from two different brands. He searches
for local stores that sell the watch in
case he has time to try them on in
person.
D E C I S I O N
3 in 4
people who perform a
local search using their
smartphone go to a
store within 24 hours
and 28% make a
purchase
D E C I S I O N
The next day Kevin visits a local
store that carries both watches. He
tries them on and purchases the
less expensive option.
D E L I G H T
2x
very satisfied
customers are twice as
likely to recommend a
retailer than customers
who are only satisfied
Kevin is proud of his purchase
and takes a selfie wearing his
watch. He tags the brand in his
post.
TEMPLATE SLIDES WITH RECENT
STATISTICS
find sources listed in the notes section
A W A R E N E S S
website behavior
9in10 45%first-time visitors do not
intend to complete a
purchase but instead look to
browse, learn and compare
are searching for a
product or service
26%
are comparing prices
or other variables
between brands
AWARENESS
11%
are searching for
store location, hours
and contact
information
AWARENESS
3 in 4
millennials take action after
seeing and being influenced
by a mobile post
A W A R E N E S S
C O N S I D E R A T I O N
44%
of shoppers prefer that
retailers personalize
content for coupons
using location
2 in 3
generation Z
shoppers prioritize
product availability
and quality when
selecting one brand
over another
CONSIDERATION
of shoppers would frequent
shopping plazas or malls
more often if retailers sent
them personalized alerts
about products they are
interested in buying
39%
C O N S I D E R A T I O N
D E C I S I O N
3 in 4
people who perform a
local search using their
smartphone go to a
store within 24 hours
and 28% make a
purchase
87%
of Millennials and
79% of Generation X
use mobile devices to
place click-and-
collect purchases
DECISION
1 in 3
purchases involve two
or more devices from
the initial website visit to
the point of transaction
DECISION
ModiFace lets users test out makeup
using augmented reality and
Gap is piloting its virtual dressing
room application
Pottery Barn lets customers
visualize décor items in their
homes via its app for AR, product
visualization and 3D room design
Help your customers save time
and energy on the purchasing path
B E S T P R A C T I C E
D E L I G H T
1 in 5shoppers are more
likely to become repeat
customers if a brand
goes the extra mile to
personalize their digital
experiences
very satisfied
customers are twice
as likely to
recommend a retailer
than customers who
are only satisfied
2x DELIGHT
62%
want to virtually see how furniture
and other accessories would fit in
their home prior to purchasing
want to create a shopping list via store
app and be given a floor map that helps
to find those products in store
want to access products available
in store without interacting with a
sales representative
55% 54%
F U T U R E O U T L O O K
2020
RESOURCES
A V A T A R S
I C O N L I B R A R Y
B U I L D I N G B L O C K S - L I N E S
B U I L D I N G B L O C K S - S O L I D
D I R E C T I O N A L L I N E S
valtech.com
where experiences are engineered
READY TO ENGINEER
YOUR RETAIL CUSTOMER
EXPERIENCE?
Check out valtech.com to find more about our retail services.
thank you

Valtech Retail Customer Journey Template

  • 1.
  • 2.
    P U RC H A S I N G PAT H Device-Centric View User-Centric View “The new path demands a new view” “Consumers use multiple devices in the buying journey, from searching and browsing to buying. Device-Centric: Traditional analytics tools look at activities on a single device, providing only a partial and distorted view of a multidevice journey. User-Centric: Only advanced cross- device measurement can accurately follow the buyer across devices and capture full-journey behavior and intent.” SOURCE: CRITEO, STATE OF CROSS-DEVICE COMMERCE H2 2016
  • 3.
    + HOW TOUSE THIS DECK + CUSTOMER JOURNEY TEMPLATE & EXAMPLE + TEMPLATE SLIDES WITH RECENT STATISTICS + RESOURCES CONTENTS
  • 4.
    HOW TO USETHIS DECK
  • 5.
    H O WT O U S E T H I S D E C K Review the customer journey example slides complete with recent statistics. The avatar moves through four stages: Awareness, Consideration, Decision and Delight. 1. Review Example Journey (begins on slide 9)
  • 6.
    H O WT O U S E T H I S D E C K Use the included avatars, icons and path-building tools to customize existing slides or master template slides added from the dropdown menu 2. Customize for your needs
  • 7.
    H O WT O U S E T H I S D E C K We’ve included some pre- designed template slides complete with recent statistics with sources listed in the notes section. Feel free to add and modify these slides! 3. Choose from pre- designed slides
  • 8.
  • 9.
    Kevin is scrollingthrough Instagram when he sees a post of a stylish watch shared by his favorite football player. Kevin thinks maybe it’s time that he buy a new watch, too. A W A R E N E S S 3in4 millennials take action after seeing and being influenced by a mobile post
  • 10.
    9 in 10 first-timevisitors do not intend to complete a purchase but instead look to browse, learn and compare The next morning before work, Kevin begins browsing for watches on his laptop. AWARENESS
  • 11.
    C O NS I D E R A T I O N Kevin finds two watches that he likes from two different brands. He searches for local stores that sell the watch in case he has time to try them on in person.
  • 12.
    D E CI S I O N 3 in 4 people who perform a local search using their smartphone go to a store within 24 hours and 28% make a purchase
  • 13.
    D E CI S I O N The next day Kevin visits a local store that carries both watches. He tries them on and purchases the less expensive option.
  • 14.
    D E LI G H T 2x very satisfied customers are twice as likely to recommend a retailer than customers who are only satisfied
  • 15.
    Kevin is proudof his purchase and takes a selfie wearing his watch. He tags the brand in his post.
  • 16.
    TEMPLATE SLIDES WITHRECENT STATISTICS find sources listed in the notes section
  • 17.
    A W AR E N E S S website behavior 9in10 45%first-time visitors do not intend to complete a purchase but instead look to browse, learn and compare are searching for a product or service
  • 18.
    26% are comparing prices orother variables between brands AWARENESS
  • 19.
    11% are searching for storelocation, hours and contact information AWARENESS
  • 20.
    3 in 4 millennialstake action after seeing and being influenced by a mobile post A W A R E N E S S
  • 21.
    C O NS I D E R A T I O N 44% of shoppers prefer that retailers personalize content for coupons using location
  • 22.
    2 in 3 generationZ shoppers prioritize product availability and quality when selecting one brand over another CONSIDERATION
  • 23.
    of shoppers wouldfrequent shopping plazas or malls more often if retailers sent them personalized alerts about products they are interested in buying 39% C O N S I D E R A T I O N
  • 24.
    D E CI S I O N 3 in 4 people who perform a local search using their smartphone go to a store within 24 hours and 28% make a purchase
  • 25.
    87% of Millennials and 79%of Generation X use mobile devices to place click-and- collect purchases DECISION
  • 26.
    1 in 3 purchasesinvolve two or more devices from the initial website visit to the point of transaction DECISION
  • 27.
    ModiFace lets userstest out makeup using augmented reality and Gap is piloting its virtual dressing room application Pottery Barn lets customers visualize décor items in their homes via its app for AR, product visualization and 3D room design Help your customers save time and energy on the purchasing path B E S T P R A C T I C E
  • 28.
    D E LI G H T 1 in 5shoppers are more likely to become repeat customers if a brand goes the extra mile to personalize their digital experiences
  • 29.
    very satisfied customers aretwice as likely to recommend a retailer than customers who are only satisfied 2x DELIGHT
  • 30.
    62% want to virtuallysee how furniture and other accessories would fit in their home prior to purchasing want to create a shopping list via store app and be given a floor map that helps to find those products in store want to access products available in store without interacting with a sales representative 55% 54% F U T U R E O U T L O O K 2020
  • 31.
  • 32.
    A V AT A R S
  • 33.
    I C ON L I B R A R Y
  • 34.
    I C ON L I B R A R Y
  • 35.
    I C ON L I B R A R Y
  • 36.
    I C ON L I B R A R Y
  • 37.
    B U IL D I N G B L O C K S - L I N E S
  • 38.
    B U IL D I N G B L O C K S - S O L I D
  • 39.
    D I RE C T I O N A L L I N E S
  • 40.
    valtech.com where experiences areengineered READY TO ENGINEER YOUR RETAIL CUSTOMER EXPERIENCE? Check out valtech.com to find more about our retail services.
  • 41.

Editor's Notes

  • #10 Source: Facebook Director of Product Marketing Maz Sharafi https://nrf.com/news/beyond-omnichannel-new-ways-think-about-commerce
  • #11 Source: 2017 Episerver Report, “Experience-driven Commerce - A research report on Reimagining Digital Commerce” http://www.episerver.com/learn/resources/research--reports/experience-driven-commerce-2017/
  • #13 Source: Google/Purchased Digital Diary, "How Consumers Solve Their Needs in the Moment," smartphone users=1,000, local searchers=634, purchases=1,140, May 2016. https://www.thinkwithgoogle.com/articles/purchase-decision-mobile-growth.html
  • #15 Source: Marketforce 2017 Fashion Research Study http://www.marketforce.com/infographic-apparel-retailers
  • #18 Source: 2017 Episerver Report, “Experience-driven Commerce - A research report on Reimagining Digital Commerce” http://www.episerver.com/learn/resources/research--reports/experience-driven-commerce-2017/
  • #19 Source: 2017 Episerver Report, “Experience-driven Commerce - A research report on Reimagining Digital Commerce” http://www.episerver.com/learn/resources/research--reports/experience-driven-commerce-2017/
  • #20 Source: 2017 Episerver Report, “Experience-driven Commerce - A research report on Reimagining Digital Commerce” http://www.episerver.com/learn/resources/research--reports/experience-driven-commerce-2017/
  • #21 Source: Facebook Director of Product Marketing Maz Sharafi https://nrf.com/news/beyond-omnichannel-new-ways-think-about-commerce
  • #22 Source: 2017 Episerver Report, “Experience-driven Commerce - A research report on Reimagining Digital Commerce” http://www.episerver.com/learn/resources/research--reports/experience-driven-commerce-2017/
  • #23 Source: IBM Report on Global Study, “Uniquely Generation Z: What brands should know about today’s youngest consumers” https://www-01.ibm.com/marketing/iwm/dre/signup?source=mrs-form-11766&S_PKG=ov56415
  • #24 Source: 2017 International Council of Shopping Centers (ICSC) Retail Technology Survey http://www.businesswire.com/news/home/20170313005007/en/ICSC-Survey-Technology-Personalization-Drive-Retail-Experience
  • #25 Source: Google/Purchased Digital Diary, "How Consumers Solve Their Needs in the Moment," smartphone users=1,000, local searchers=634, purchases=1,140, May 2016. https://www.thinkwithgoogle.com/articles/purchase-decision-mobile-growth.html
  • #26 Source: 2017 International Council of Shopping Centers (ICSC) Retail Technology Survey http://www.businesswire.com/news/home/20170313005007/en/ICSC-Survey-Technology-Personalization-Drive-Retail-Experience
  • #27 Source: Criteo, State Of Cross-device Commerce H2 2016 http://www.criteo.com/media/6620/criteo-state-of-cross-device-commerce-2016-h2-us.pdf
  • #29 Source: 2017 Episerver Report, “Experience-driven Commerce - A research report on Reimagining Digital Commerce” http://www.episerver.com/learn/resources/research--reports/experience-driven-commerce-2017/
  • #30 Source: Marketforce 2017 Fashion Research Study http://www.marketforce.com/infographic-apparel-retailers
  • #31 Source: 2017 International Council of Shopping Centers (ICSC) Retail Technology Survey http://www.businesswire.com/news/home/20170313005007/en/ICSC-Survey-Technology-Personalization-Drive-Retail-Experience