SlideShare a Scribd company logo
1 of 3
Download to read offline
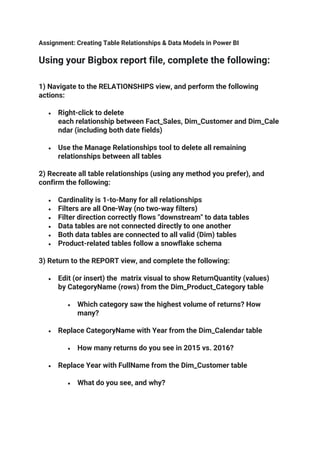
Assignment: Creating Table Relationships & Data Models in Power BI
Using your Bigbox report file, complete the following:
1) Navigate to the RELATIONSHIPS view, and perform the following
actions:
• Right-click to delete
each relationship between Fact_Sales, Dim_Customer and Dim_Cale
ndar (including both date fields)
• Use the Manage Relationships tool to delete all remaining
relationships between all tables
2) Recreate all table relationships (using any method you prefer), and
confirm the following:
• Cardinality is 1-to-Many for all relationships
• Filters are all One-Way (no two-way filters)
• Filter direction correctly flows "downstream" to data tables
• Data tables are not connected directly to one another
• Both data tables are connected to all valid (Dim) tables
• Product-related tables follow a snowflake schema
3) Return to the REPORT view, and complete the following:
• Edit (or insert) the matrix visual to show ReturnQuantity (values)
by CategoryName (rows) from the Dim_Product_Category table
• Which category saw the highest volume of returns? How
many?
• Replace CategoryName with Year from the Dim_Calendar table
• How many returns do you see in 2015 vs. 2016?
• Replace Year with FullName from the Dim_Customer table
• What do you see, and why?
• Update the matrix to show
both OrderQuantity and ReturnQuantity (values) by ProductKey (row
s) from the Dim_Product table
• What was the total OrderQuantity for Product #338?
4) Unhide the ProductKey field from the Fact_Returns tables (using either
the DATA or RELATIONSHIPS view):
• In the matrix,
replace ProductKey from Dim_Product with ProductKey from
the Fact_Returns table
• Why do we see the same repeating values for OrderQuantity?
• Edit the relationship between Fact_Returns and Dim_Product to
change the cross filter direction from Single to Both
• Why does the visual now show OrderQuantity values by
product, even though we are
using ProductKey from Fact_Returns?
• How many orders do we see now for Product #338? What's
going on here?
5) Complete the following :
• Change the cross filter direction
between Fact_Returns and Dim_Product back to single (One-Way)
• Hide the ProductKey field in the Fact_Returns table from report view
(and any other foreign keys, if necessary)
• Update the matrix to show ProductKey from the Dim_Product, rather
than Fact_Returns
• Recommendation: Save a separate backup copy of the .pbix file (i.e.
"AdventureWorks_Report_Backup")
Data model Assignment.pdf

More Related Content

Similar to Data model Assignment.pdf

Designing high performance datawarehouse
Designing high performance datawarehouseDesigning high performance datawarehouse
Designing high performance datawarehouseUday Kothari
 
Working with Pivot Tables
Working with Pivot TablesWorking with Pivot Tables
Working with Pivot TablesKingston Tagoe
 
Tableau - Learning Objectives for Data, Graphs, Filters, Dashboards and Advan...
Tableau - Learning Objectives for Data, Graphs, Filters, Dashboards and Advan...Tableau - Learning Objectives for Data, Graphs, Filters, Dashboards and Advan...
Tableau - Learning Objectives for Data, Graphs, Filters, Dashboards and Advan...Srinath Reddy
 
BI Knowledge Sharing Session 2
BI Knowledge Sharing Session 2BI Knowledge Sharing Session 2
BI Knowledge Sharing Session 2Kelvin Chan
 
I Simply Excel
I Simply ExcelI Simply Excel
I Simply ExcelEric Couch
 
Excel Pivot Tables and Graphing for Auditors
Excel Pivot Tables and Graphing for AuditorsExcel Pivot Tables and Graphing for Auditors
Excel Pivot Tables and Graphing for AuditorsJim Kaplan CIA CFE
 
Mutable data @ scale
Mutable data @ scaleMutable data @ scale
Mutable data @ scaleOri Reshef
 
Birt crosstabtutorialadvanced
Birt crosstabtutorialadvancedBirt crosstabtutorialadvanced
Birt crosstabtutorialadvancedSupratim Ray
 
Performance Tuning Oracle's BI Applications
Performance Tuning Oracle's BI ApplicationsPerformance Tuning Oracle's BI Applications
Performance Tuning Oracle's BI ApplicationsKPI Partners
 
Matrix Diagram
Matrix DiagramMatrix Diagram
Matrix DiagramCIToolkit
 
ReportsDashboardsSql_hbli
ReportsDashboardsSql_hbliReportsDashboardsSql_hbli
ReportsDashboardsSql_hbliHong-Bing Li
 
Reports Dashboards SQL Demo
Reports Dashboards SQL DemoReports Dashboards SQL Demo
Reports Dashboards SQL DemoHong-Bing Li
 
Reports Dashboards ETL SQL_HBLI
Reports Dashboards ETL SQL_HBLIReports Dashboards ETL SQL_HBLI
Reports Dashboards ETL SQL_HBLIHong-Bing Li
 
ReportsDashboardsSQLDemoHBLI
ReportsDashboardsSQLDemoHBLIReportsDashboardsSQLDemoHBLI
ReportsDashboardsSQLDemoHBLIHong-Bing Li
 
Reports Dashboards SQL SSIS Demo
Reports Dashboards SQL SSIS DemoReports Dashboards SQL SSIS Demo
Reports Dashboards SQL SSIS DemoHong-Bing Li
 
ReportsDashboardsSql_hbli
ReportsDashboardsSql_hbliReportsDashboardsSql_hbli
ReportsDashboardsSql_hbliHong-Bing Li
 
DSN_Power BIDSN_Power BIDSN_Power BIDSN_Power BIDSN_Power BIDSN_Power BI
DSN_Power BIDSN_Power BIDSN_Power BIDSN_Power BIDSN_Power BIDSN_Power BIDSN_Power BIDSN_Power BIDSN_Power BIDSN_Power BIDSN_Power BIDSN_Power BI
DSN_Power BIDSN_Power BIDSN_Power BIDSN_Power BIDSN_Power BIDSN_Power BIEzekielJames8
 

Similar to Data model Assignment.pdf (20)

Tableau.pdf
Tableau.pdfTableau.pdf
Tableau.pdf
 
Designing high performance datawarehouse
Designing high performance datawarehouseDesigning high performance datawarehouse
Designing high performance datawarehouse
 
Working with Pivot Tables
Working with Pivot TablesWorking with Pivot Tables
Working with Pivot Tables
 
Tableau - Learning Objectives for Data, Graphs, Filters, Dashboards and Advan...
Tableau - Learning Objectives for Data, Graphs, Filters, Dashboards and Advan...Tableau - Learning Objectives for Data, Graphs, Filters, Dashboards and Advan...
Tableau - Learning Objectives for Data, Graphs, Filters, Dashboards and Advan...
 
advanced sql(database)
advanced sql(database)advanced sql(database)
advanced sql(database)
 
BI Knowledge Sharing Session 2
BI Knowledge Sharing Session 2BI Knowledge Sharing Session 2
BI Knowledge Sharing Session 2
 
I Simply Excel
I Simply ExcelI Simply Excel
I Simply Excel
 
Bis 345-week-4-i lab-new
Bis 345-week-4-i lab-newBis 345-week-4-i lab-new
Bis 345-week-4-i lab-new
 
Excel Pivot Tables and Graphing for Auditors
Excel Pivot Tables and Graphing for AuditorsExcel Pivot Tables and Graphing for Auditors
Excel Pivot Tables and Graphing for Auditors
 
Mutable data @ scale
Mutable data @ scaleMutable data @ scale
Mutable data @ scale
 
Birt crosstabtutorialadvanced
Birt crosstabtutorialadvancedBirt crosstabtutorialadvanced
Birt crosstabtutorialadvanced
 
Performance Tuning Oracle's BI Applications
Performance Tuning Oracle's BI ApplicationsPerformance Tuning Oracle's BI Applications
Performance Tuning Oracle's BI Applications
 
Matrix Diagram
Matrix DiagramMatrix Diagram
Matrix Diagram
 
ReportsDashboardsSql_hbli
ReportsDashboardsSql_hbliReportsDashboardsSql_hbli
ReportsDashboardsSql_hbli
 
Reports Dashboards SQL Demo
Reports Dashboards SQL DemoReports Dashboards SQL Demo
Reports Dashboards SQL Demo
 
Reports Dashboards ETL SQL_HBLI
Reports Dashboards ETL SQL_HBLIReports Dashboards ETL SQL_HBLI
Reports Dashboards ETL SQL_HBLI
 
ReportsDashboardsSQLDemoHBLI
ReportsDashboardsSQLDemoHBLIReportsDashboardsSQLDemoHBLI
ReportsDashboardsSQLDemoHBLI
 
Reports Dashboards SQL SSIS Demo
Reports Dashboards SQL SSIS DemoReports Dashboards SQL SSIS Demo
Reports Dashboards SQL SSIS Demo
 
ReportsDashboardsSql_hbli
ReportsDashboardsSql_hbliReportsDashboardsSql_hbli
ReportsDashboardsSql_hbli
 
DSN_Power BIDSN_Power BIDSN_Power BIDSN_Power BIDSN_Power BIDSN_Power BI
DSN_Power BIDSN_Power BIDSN_Power BIDSN_Power BIDSN_Power BIDSN_Power BIDSN_Power BIDSN_Power BIDSN_Power BIDSN_Power BIDSN_Power BIDSN_Power BI
DSN_Power BIDSN_Power BIDSN_Power BIDSN_Power BIDSN_Power BIDSN_Power BI
 

Recently uploaded

Arihant handbook biology for class 11 .pdf
Arihant handbook biology for class 11 .pdfArihant handbook biology for class 11 .pdf
Arihant handbook biology for class 11 .pdfchloefrazer622
 
Grant Readiness 101 TechSoup and Remy Consulting
Grant Readiness 101 TechSoup and Remy ConsultingGrant Readiness 101 TechSoup and Remy Consulting
Grant Readiness 101 TechSoup and Remy ConsultingTechSoup
 
Web & Social Media Analytics Previous Year Question Paper.pdf
Web & Social Media Analytics Previous Year Question Paper.pdfWeb & Social Media Analytics Previous Year Question Paper.pdf
Web & Social Media Analytics Previous Year Question Paper.pdfJayanti Pande
 
SOCIAL AND HISTORICAL CONTEXT - LFTVD.pptx
SOCIAL AND HISTORICAL CONTEXT - LFTVD.pptxSOCIAL AND HISTORICAL CONTEXT - LFTVD.pptx
SOCIAL AND HISTORICAL CONTEXT - LFTVD.pptxiammrhaywood
 
microwave assisted reaction. General introduction
microwave assisted reaction. General introductionmicrowave assisted reaction. General introduction
microwave assisted reaction. General introductionMaksud Ahmed
 
Introduction to AI in Higher Education_draft.pptx
Introduction to AI in Higher Education_draft.pptxIntroduction to AI in Higher Education_draft.pptx
Introduction to AI in Higher Education_draft.pptxpboyjonauth
 
Nutritional Needs Presentation - HLTH 104
Nutritional Needs Presentation - HLTH 104Nutritional Needs Presentation - HLTH 104
Nutritional Needs Presentation - HLTH 104misteraugie
 
Measures of Central Tendency: Mean, Median and Mode
Measures of Central Tendency: Mean, Median and ModeMeasures of Central Tendency: Mean, Median and Mode
Measures of Central Tendency: Mean, Median and ModeThiyagu K
 
Presentation by Andreas Schleicher Tackling the School Absenteeism Crisis 30 ...
Presentation by Andreas Schleicher Tackling the School Absenteeism Crisis 30 ...Presentation by Andreas Schleicher Tackling the School Absenteeism Crisis 30 ...
Presentation by Andreas Schleicher Tackling the School Absenteeism Crisis 30 ...EduSkills OECD
 
Advanced Views - Calendar View in Odoo 17
Advanced Views - Calendar View in Odoo 17Advanced Views - Calendar View in Odoo 17
Advanced Views - Calendar View in Odoo 17Celine George
 
mini mental status format.docx
mini    mental       status     format.docxmini    mental       status     format.docx
mini mental status format.docxPoojaSen20
 
Accessible design: Minimum effort, maximum impact
Accessible design: Minimum effort, maximum impactAccessible design: Minimum effort, maximum impact
Accessible design: Minimum effort, maximum impactdawncurless
 
Privatization and Disinvestment - Meaning, Objectives, Advantages and Disadva...
Privatization and Disinvestment - Meaning, Objectives, Advantages and Disadva...Privatization and Disinvestment - Meaning, Objectives, Advantages and Disadva...
Privatization and Disinvestment - Meaning, Objectives, Advantages and Disadva...RKavithamani
 
How to Make a Pirate ship Primary Education.pptx
How to Make a Pirate ship Primary Education.pptxHow to Make a Pirate ship Primary Education.pptx
How to Make a Pirate ship Primary Education.pptxmanuelaromero2013
 
Call Girls in Dwarka Mor Delhi Contact Us 9654467111
Call Girls in Dwarka Mor Delhi Contact Us 9654467111Call Girls in Dwarka Mor Delhi Contact Us 9654467111
Call Girls in Dwarka Mor Delhi Contact Us 9654467111Sapana Sha
 
The basics of sentences session 2pptx copy.pptx
The basics of sentences session 2pptx copy.pptxThe basics of sentences session 2pptx copy.pptx
The basics of sentences session 2pptx copy.pptxheathfieldcps1
 
POINT- BIOCHEMISTRY SEM 2 ENZYMES UNIT 5.pptx
POINT- BIOCHEMISTRY SEM 2 ENZYMES UNIT 5.pptxPOINT- BIOCHEMISTRY SEM 2 ENZYMES UNIT 5.pptx
POINT- BIOCHEMISTRY SEM 2 ENZYMES UNIT 5.pptxSayali Powar
 

Recently uploaded (20)

Arihant handbook biology for class 11 .pdf
Arihant handbook biology for class 11 .pdfArihant handbook biology for class 11 .pdf
Arihant handbook biology for class 11 .pdf
 
Grant Readiness 101 TechSoup and Remy Consulting
Grant Readiness 101 TechSoup and Remy ConsultingGrant Readiness 101 TechSoup and Remy Consulting
Grant Readiness 101 TechSoup and Remy Consulting
 
Web & Social Media Analytics Previous Year Question Paper.pdf
Web & Social Media Analytics Previous Year Question Paper.pdfWeb & Social Media Analytics Previous Year Question Paper.pdf
Web & Social Media Analytics Previous Year Question Paper.pdf
 
SOCIAL AND HISTORICAL CONTEXT - LFTVD.pptx
SOCIAL AND HISTORICAL CONTEXT - LFTVD.pptxSOCIAL AND HISTORICAL CONTEXT - LFTVD.pptx
SOCIAL AND HISTORICAL CONTEXT - LFTVD.pptx
 
microwave assisted reaction. General introduction
microwave assisted reaction. General introductionmicrowave assisted reaction. General introduction
microwave assisted reaction. General introduction
 
Introduction to AI in Higher Education_draft.pptx
Introduction to AI in Higher Education_draft.pptxIntroduction to AI in Higher Education_draft.pptx
Introduction to AI in Higher Education_draft.pptx
 
Nutritional Needs Presentation - HLTH 104
Nutritional Needs Presentation - HLTH 104Nutritional Needs Presentation - HLTH 104
Nutritional Needs Presentation - HLTH 104
 
Measures of Central Tendency: Mean, Median and Mode
Measures of Central Tendency: Mean, Median and ModeMeasures of Central Tendency: Mean, Median and Mode
Measures of Central Tendency: Mean, Median and Mode
 
Presentation by Andreas Schleicher Tackling the School Absenteeism Crisis 30 ...
Presentation by Andreas Schleicher Tackling the School Absenteeism Crisis 30 ...Presentation by Andreas Schleicher Tackling the School Absenteeism Crisis 30 ...
Presentation by Andreas Schleicher Tackling the School Absenteeism Crisis 30 ...
 
Código Creativo y Arte de Software | Unidad 1
Código Creativo y Arte de Software | Unidad 1Código Creativo y Arte de Software | Unidad 1
Código Creativo y Arte de Software | Unidad 1
 
Advanced Views - Calendar View in Odoo 17
Advanced Views - Calendar View in Odoo 17Advanced Views - Calendar View in Odoo 17
Advanced Views - Calendar View in Odoo 17
 
mini mental status format.docx
mini    mental       status     format.docxmini    mental       status     format.docx
mini mental status format.docx
 
Accessible design: Minimum effort, maximum impact
Accessible design: Minimum effort, maximum impactAccessible design: Minimum effort, maximum impact
Accessible design: Minimum effort, maximum impact
 
Privatization and Disinvestment - Meaning, Objectives, Advantages and Disadva...
Privatization and Disinvestment - Meaning, Objectives, Advantages and Disadva...Privatization and Disinvestment - Meaning, Objectives, Advantages and Disadva...
Privatization and Disinvestment - Meaning, Objectives, Advantages and Disadva...
 
How to Make a Pirate ship Primary Education.pptx
How to Make a Pirate ship Primary Education.pptxHow to Make a Pirate ship Primary Education.pptx
How to Make a Pirate ship Primary Education.pptx
 
Call Girls in Dwarka Mor Delhi Contact Us 9654467111
Call Girls in Dwarka Mor Delhi Contact Us 9654467111Call Girls in Dwarka Mor Delhi Contact Us 9654467111
Call Girls in Dwarka Mor Delhi Contact Us 9654467111
 
The basics of sentences session 2pptx copy.pptx
The basics of sentences session 2pptx copy.pptxThe basics of sentences session 2pptx copy.pptx
The basics of sentences session 2pptx copy.pptx
 
INDIA QUIZ 2024 RLAC DELHI UNIVERSITY.pptx
INDIA QUIZ 2024 RLAC DELHI UNIVERSITY.pptxINDIA QUIZ 2024 RLAC DELHI UNIVERSITY.pptx
INDIA QUIZ 2024 RLAC DELHI UNIVERSITY.pptx
 
POINT- BIOCHEMISTRY SEM 2 ENZYMES UNIT 5.pptx
POINT- BIOCHEMISTRY SEM 2 ENZYMES UNIT 5.pptxPOINT- BIOCHEMISTRY SEM 2 ENZYMES UNIT 5.pptx
POINT- BIOCHEMISTRY SEM 2 ENZYMES UNIT 5.pptx
 
Mattingly "AI & Prompt Design: Structured Data, Assistants, & RAG"
Mattingly "AI & Prompt Design: Structured Data, Assistants, & RAG"Mattingly "AI & Prompt Design: Structured Data, Assistants, & RAG"
Mattingly "AI & Prompt Design: Structured Data, Assistants, & RAG"
 

Data model Assignment.pdf

  • 1. Assignment: Creating Table Relationships & Data Models in Power BI Using your Bigbox report file, complete the following: 1) Navigate to the RELATIONSHIPS view, and perform the following actions: • Right-click to delete each relationship between Fact_Sales, Dim_Customer and Dim_Cale ndar (including both date fields) • Use the Manage Relationships tool to delete all remaining relationships between all tables 2) Recreate all table relationships (using any method you prefer), and confirm the following: • Cardinality is 1-to-Many for all relationships • Filters are all One-Way (no two-way filters) • Filter direction correctly flows "downstream" to data tables • Data tables are not connected directly to one another • Both data tables are connected to all valid (Dim) tables • Product-related tables follow a snowflake schema 3) Return to the REPORT view, and complete the following: • Edit (or insert) the matrix visual to show ReturnQuantity (values) by CategoryName (rows) from the Dim_Product_Category table • Which category saw the highest volume of returns? How many? • Replace CategoryName with Year from the Dim_Calendar table • How many returns do you see in 2015 vs. 2016? • Replace Year with FullName from the Dim_Customer table • What do you see, and why?
  • 2. • Update the matrix to show both OrderQuantity and ReturnQuantity (values) by ProductKey (row s) from the Dim_Product table • What was the total OrderQuantity for Product #338? 4) Unhide the ProductKey field from the Fact_Returns tables (using either the DATA or RELATIONSHIPS view): • In the matrix, replace ProductKey from Dim_Product with ProductKey from the Fact_Returns table • Why do we see the same repeating values for OrderQuantity? • Edit the relationship between Fact_Returns and Dim_Product to change the cross filter direction from Single to Both • Why does the visual now show OrderQuantity values by product, even though we are using ProductKey from Fact_Returns? • How many orders do we see now for Product #338? What's going on here? 5) Complete the following : • Change the cross filter direction between Fact_Returns and Dim_Product back to single (One-Way) • Hide the ProductKey field in the Fact_Returns table from report view (and any other foreign keys, if necessary) • Update the matrix to show ProductKey from the Dim_Product, rather than Fact_Returns • Recommendation: Save a separate backup copy of the .pbix file (i.e. "AdventureWorks_Report_Backup")