
Recommended
Recommended
More Related Content
Similar to Key Term TARIFFS- (800 words minimum) 1-5After you have s.docx
Similar to Key Term TARIFFS- (800 words minimum) 1-5After you have s.docx (12)
More from croysierkathey
More from croysierkathey (20)
Recently uploaded
Recently uploaded (20)
Key Term TARIFFS- (800 words minimum) 1-5After you have s.docx
- 1. Key Term: TARIFFS - (800 words minimum) 1-5 After you have successfully reserved the key term (TARIFFS) that interests you the most, research a minimum of 5 recent scholarly articles that relate to the concept on which you wish to focus your research. Articles must be found in reputable professional and/or scholarly journals and/or informational venues that deal with the content of the course (i.e., not blogs, Wikipedia, newspapers, etc.). After reading the articles, select the 1 article that you wish to discuss. It is highly recommended that you use Liberty University’s Jerry Falwell Library online resources. A librarian is available to assist you in all matters pertaining to conducting your research, including what constitutes a scholarly article. For more details on what constitutes a scholarly journal (and what does not), visit Jerry Falwell Library’s "Scholarly Journals – What Are They?" page. 1. Key Term: TARIFFS and Why You Are Interested in It (100 words minimum) After reading the textbook, specifically state why you are interested in conducting further research on this key term (e.g., academic curiosity, application to a current issue related to employment, or any other professional rationale). Include a substantive reason, not simply a phrase. 2. Explanation of the Key Term: TARIFFS (100 words minimum) Provide a clear and concise overview of the essentials relevant to understanding this key term.
- 2. 3. Major Article Summary(300 words minimum) Using your own words, provide a clear and concise summary of the article, including the major points and conclusions. 4. Discussion In your own words, discuss each of the following points: a. How the cited work relates to your above explanation AND how it relates specifically to the content of the assigned module/week. This part of your thread provides evidence that you have extended your understanding of this key term beyond the textbook readings. (150 words minimum) b. How the cited work relates to the other 4 works you researched. This part of your thread provides evidence that you have refined your research key term to a coherent and specialized aspect of the key term, rather than a random selection of works on the key term. The idea here is to prove that you have focused your research and that all works cited are related in some manner to each other rather than simply a collection of the first 5 results from your Internet search. (150 words minimum) 5. References A minimum of 5 recent scholarly articles (not textbooks, Wikipedia, or other popular reading magazines), in current APA format, must be included and must contain persistent links so others may have instant access. In the event that formatting is lost or corrupted when submitting the thread, attach the Microsoft Word document to your thread as evidence that your work was completed in the proper format. Access the following URL from the Jerry Falwell Library for instructions on creating persistent links: How to Create a Persistent Link.
- 3. "What I wanted to do was create an efficient market where regular people could compete with big business ... it was a little bit of an experiment." — Pierre Omidyar, eBay founder eBay Analytics: Innovation Inspired by Opportunity Abstract The eBay of 2010 is preparing itself for increasing global competition. This case emphasizes alignment between business strategy, innovation, analytics and IT investments. An analytics focus on streamlining innovation through experimentation is supported through a unique data warehousing architecture that virtualizes on-demand, innovation ‘sandboxes.’ Key personnel have been hired to support the strategy, and marketplace goals have been established to guide experimental designs. To support experimentation, eBay’s Teradata Enterprise Data Warehouse (EDW) enables self- service virtual data marts that are cost effective, they can be realized faster than traditional data marts, and they support streamlined transfer of new discoveries into production. eBay refers to the approach as ‘Analytics as a Service.’ In addition, a new area of analytics, called ‘deep analytics,’ is supported by a
- 4. dedicated Teradata appliance. Deep analytics at eBay focus on scrutinizing huge web log data volumes for doing special types of analysis. For eBay leaders like Vice President of Analytics Bob Page, the new thrust will require nurturing an organizational “culture of experimentation.” Page’s team faces challenges like determining appropriate incentives to encourage experimentation leading to innovation, establishing experimentation standards and governance processes and identifying approaches for evaluating ‘return on innovation investment.’ This case was prepared by Michael Goul, Professor and Chair, Department of Information Systems, W. P. Carey School of Business, Arizona State Univer sity. This case is free for use for educational purposes. Copyright 2011 by Michael Goul and the Arizona Board of Regents.
- 5. 2 eBay Analytics: Innovation Inspired by Opportunity Introduction eBay was founded only fifteen years ago by twenty-eight year old software developer Pierre Omidyar in his living room. Echo Bay was the name of Omidyar’s consulting firm; the name was shortened to eBay, and the company began to grow. Stanford MBA Jeffrey Skoll joined in 1996, and eBay went public in 1998. By then, both Omidyar and Skoll were billionaires. In 2009, the total worth of goods sold on eBay was near $60 billion - $2000 per second. By August 2010, eBay was faring well through the recession. Matt Jarzemsky of the Dow Jones Newswires reported that Moody’s had upgraded eBay; citing strong performance and liquidity: “Moody's Investors Service gave a one-notch upgrade to eBay Inc. (EBAY), citing the e-commerce giant's strong operating performance and promising prospects. The company has seen performance improve of late as it works through a three-year restructuring aimed at reviving its marketplace unit with an increasing focus on fixed-price sales, which now account for more listings than auctions. It reported last month its latest quarter profit climbed a higher-than-
- 6. expected 26% as revenue rose, though it tempered its 2010 guidance because of the stronger dollar. It noted the company has very low financial leverage and solid liquidity, with eBay's strong cash flow position enhanced by a $1.84 billion credit facility maturing in 2012. The ratings outlook is stable, reflecting its expectation the company will maintain its strong market positions in e- commerce. EBay's shares were down 0.4% at $22.66 in recent trading as the broader market slumped on disappointing U.S. jobless claims data.”1 eBay’s worldwide competition started heating up in 2010. One analyst suggested on July 6, 2010 that eBay actually needed to start an Amazon-style fulfillment center if it wants to remain competitive and shed its ‘web 1.0 image.’2 Another analyst had a broader focus and cast Rakutan as a major emerging competitor to both eBay and Amazon. Rakutan, Japan’s largest auction site (64 million registered members, sales of $3.2 billion in 2009 and some 50 million products listed by more than 33,000 sellers) acquired Buy.com for $250 million.3 Why did Rakutan buy a U.S. company? Buy.com had 14 million registered members, it has an operation in the UK, and the press release from Rakutan on the day of the purchase read, ‘Buy.com represents a unique opportunity to accelerate the notion of borderless ecommerce in both directions – from East to West and
- 7. from West to East.’ Another potential competitor is Taobao.com. Taobao announced a deal in May 10, 2010 with Softbank Corporation’s Yahoo Japan claiming that it is aiming to create the world’s largest market place.4 Taobao is by far the biggest online shopping site in China—with 87% of merchandise volume sold online as of the fourth quarter of 2009. $30.5 billion of goods were sold through Taobao in that year, about half the $57.2 billion in transactions on eBay's marketplaces in the same year. Taobao expects transactions to double this year. In discussing the Yahoo Japan collaboration, Softbank’s Masayoshi Son said, “After we join our strengths together we will definitely beat eBay. In the future, the Asia market will be very important. If you can't be No. 1 in Asia, you won't be No. 1 in the world." 3 eBay’s faced stiff competition before, but from the beginning, it has thrived by staying true to its mission of being a company that pioneers communities built on commerce, sustained by trust and inspired by opportunity. Employees of the eBay of 2010 are increasingly inspired by opportunities discovered through what has recently been referred to as ‘smart business experimentation.’5 Led by CEO John Donahoe, he recently reinforced the importance of experimentation for purposes of
- 8. innovation as follows: “We want to be an innovator. We want to make it easy to list, easy to sell, and easy to buy. Our new iPhone app is a perfect example. In the past, it has been cumbersome to post goods for sale. As a result, some goods that could have been resold ended up in landfill. With eBay's iPhone app, my mother can go into her closet, take photos of a coat she's ready to pass on, describe it and list it in less than a minute. The same will be true with mobile payments. We will make it easier for people to buy and sell wherever they are… We also support innovations that help the efficiency of our operations.”6 A New Addition to the Team How will eBay continue its leadership across multiple areas of commerce innovation? According to scholar Tom Davenport, the company’s evolved an organizational capability to test-and-learn. Davenport and many others have extolled eBay’s successes in developing this capability as embodied in the company’s Experimentation Platform: “Companies that want testing to be a reliable, effective element of their decision making need to create an infrastructure to make that happen. They need training
- 9. programs to hone competencies, software to structure and analyze the tests, a means of capturing learning, a process for deciding when to repeat tests, and a central organization to provide expert support for all the above.”7 In 2010, efforts to reinforce the central organization to provide the expert support mentioned by Davenport came in the form of new eBay hires. In late May, company spokesperson Johnna Hoff was interviewed by AuctionBytes.com and announced that technological innovation and hiring the right team had been keys to recent progress: "Our focus on the technology front has been strengthening eBay's foundation and taking steps to set the stage for future innovation. We have taken time to lay the groundwork, hiring a world-class tech team, building an experimentation platform, launching the Garden by eBay, and listening to customers. From that, we've driven early successes that eBay users have told us perform well: the ‘More like this’ feature; and Mobile are examples - and there is much more to come."8 Hoff’s mention of hiring a world-class tech team was right on target. The new V.P. of Analytics, Bob Page, had been the Senior Director of Analytics
- 10. at Yahoo! since October of 2004. He blogged an announcement of his arrival at eBay on March 20, 2010:9 4 Hello eBay! Thanks for the emails and tweets around my time off, it was short but sweet. While it would have been great to take more time to decompress, I knew what was ahead — and felt like a kid on Christmas Eve. I didn’t want to wait, because … I’ve joined eBay. eBay has many fabulous analytical tools already, both commercial and home- grown, for lots of different kinds of analysis. In addition, they are on a road to build out a whole new class of analytic capabilities based on Hadoop. They recently reorganized the data initiatives and groups to form a team that re- focuses the “many standalone tools” mindset to a “platform” for analytics. This holistic vision, and the “central data, distributed analysis” mindset aligns so
- 11. well with my thinking and interests that I had to make the jump. As much as I love what Yahoo! is doing with analytics, the opportunity at eBay was too compelling to pass up. I mean, come on .. it’s the world’s largest online marketplace! My discussions with the eBay leadership team told me two important things. First, they are ready to make significant investments in data capabilities to drive the next generation of eBay. Second, the new leadership over the last couple of years is bringing a change to the business, where the company will be much more technology- and innovation-driven than it has been in the past. Many of the leadership hires in the last 18 months are a testament to that. And I like to think I am another proof point. Having cool technology and a leadership team that understands the value of data is a great start. But the icing on the cake is the level of data and analytics talent within eBay. It is, in a word, staggering. I am truly humbled by the opportunity to work with a group of this caliber. Shortly after arriving at eBay, Page was a member of FutureWeb’s panel session on web analytics and offered what, to many, was a surprising appraisal of the world of data warehousing and business intelligence when he stated:
- 12. “Analytics are going to get worse before they get better. We have so much data and means to collect it, and we produce endless reports. What’s going to happen is decision makers are going to say, ‘I have a hypothesis. I’ve decided what I want to do with X, Y and Z,’ then they go find the data that backs up their position. Having folks that are ethical about the data and what it means will be important.”10 In a later interview, Page elaborated. In leading eBay analytics forward, he discussed how one step is to create the right platform, and another very important step is to build the right experimentation culture. Experimentation requires developing a hypothesis, designing an appropriate test of that hypothesis (one that has appropriate controls), executing the test, and then ensuring results that improve the bottom line performance are made a part of the business. An ‘equitable’ mindset on the part of experimenters is a key. If tests are contrived or are conducted to simply confirm preconceived or desired outcomes and opinions, the scientific nature of the inquiry goes out the door. Page states, 5 “When you generate hundreds of metrics – you aren’t doing
- 13. analysis, you are just justifying your argument – throwing data at this will just confuse matters more.”11 Developing a test-and-learn organizational capability means investing in platform to enable it - and at the same time, one must lay the foundation for a culture that extols scientifically sound experimentation. Regarding infrastructure, traditional investments in data warehouse architectures don’t often translate to solid test- and-learn platforms. Data warehouses were originally designed for reporting and OLAP, so extending them to a test-and-learn capability represents significant challenges. The nature of experimentation requires advanced analytics – and that is where rethinking the nature of data warehousing has created a new set of decisions that organizations have to make. Philip Russom’s TDWI Checklist Report: Data Requirements for Advanced Analytics, explains: “Organizations will face challenges as they move into advanced analytics. Many don’t understand that reporting and analytics are different practices, often with different data requirements. Many have designed a data warehouse to fulfill the requirements of reporting and online analytic processing (OLAP), and they will soon need to expand the warehouse (or complement it with analytic databases) to fulfill the data requirements of advanced analytics, whether query-based or predictive. One of the most critical design and architecture
- 14. decisions adopters of advanced analytics must make is whether to store analytic data in a data warehouse or in a stand-alone analytic database. There are three options: 1) Analytics processed within the EDW, 2) Analytic sandboxes and 3) Analytic databases outside the EDW.”12 In considering Russom’s options, a major issue is that the analytic tools based on data mining technologies are often optimized for data dumps in the form of flat files or denormalized tables, so generating a very large flat file is core to data preparation for many mining algorithms. Many claim that organizations with an existing, true EDW (enterprise data warehouse) are likely better able to make the extensions necessary to enable test-and-learn. In this context, an EDW is thought of as one that is all- encompassing; it is a repository for data that can be leveraged by many departments, it is capable of handling many different workloads concurrently, and it manages data that has been captured in different types of data structures and models. Many organizations have an EDW, others perceive EDW as a model to aspire to, and they are working towards it. This is because the contrast is often a proliferation of data marts (an option derogatorily referred to as ‘spreadmarts’) that are often slow because they require frequent independent processing for functions like transformation, cleansing, modeling, etc. Many
- 15. architectures composed of what is often referred to as ‘rogue data marts’ have to be brought under central management in order to maintain their accuracy and to minimize prohibitive administrative and overhead costs. However, conventional debates over EDW and data mart architectural approaches are being reconsidered given the push towards advanced analytics and test-and-learn capability development. Along with the move towards advanced analytics, the addition of data warehouse appliances to organizations’ infrastructure possibilities has served to further muddle the historic debate, and appliances extend the options for retrofitting EDWs for advanced analytics. As Russom indicates, adding analytics to an existing architecture can be done in several 6 ways. Analytics processed within an EDW are often stated as a preferred option, but because of the structure of data required by current analytical tool suites, the processing of the flat files required is inconsistent with most EDW structures. In addition, there could be significant performance drags to the EDW workload as advanced analytics usage is scaled. Often, flat files are often better off sent to some sort of a secondary repository, but the cost is that there are some latency and
- 16. potential accuracy issues. (It should be noted that many vendors are working on altering EDW capabilities to enable this preferred option through an approach called in-database analytics where the tool suites and the EDW are more tightly coupled - but these developments have not yet been widely deployed.) Another approach is referred to as ‘analytic sandboxes.’ Here, an analytic database is set up somewhere inside the EDW, and the analytic tool suite user can work within the sandbox - with the advantage that there is little drag to the overall workload of the EDW. Finally, a repository outside the EDW for analytics, or the creation of specialized analytics databases, is an option. At one extreme, this approach can deteriorate into the spreadmart situation, but then again, creating these repositories can be helpful if the analytics have high and unpredictable workloads. eBay has worked through these options as it has built-out a world-class test-and- learn infrastructure. eBay’s Experimentation Platform eBay’s Experimentation Platform has been developed in collaboration with Teradata Corporation. Oliver Ratzesberger, senior director of architecture and operations for eBay, led the original move from an Oracle-based system to a Teradata system in 2002. CIOZone’s Mel Duvall sized up the history of the switch as follows: “EBay overhauled its data warehouse and analytics capabilities
- 17. in 2002, moving from an Oracle-based system to a Teradata system. Ratzesberger said the move at the time was based on necessity—daily data loads were exceeding 24 hours and the system simply could not produce results in satisfactory time frames. While the Teradata upgrade helped overcome capacity limitations, it was still difficult for central IT to keep up with demands by business units for new data marts to perform analytics. About two years ago, the idea was conceived to create a self-help service, where individual business units could use a Web- portal to load their own data into the Teradata warehouse. Once loaded, they could then begin performing their own analysis using standard tools from such vendors as SAS, Microstrategy, Cognos and/or Excel. Business units can also bring in outside data from third parties using the Web portal. The end result is that instead of taking weeks for central IT to process a request, a business unit can upload their own data and quickly begin getting results. There literally are some business units who have an idea on Monday, and results by Wednesday. The idea of allowing business units to tap directly into the data warehouse in this manner did cause some uneasiness within the IT ranks. As safeguards, the virtual data marts are set up in sandboxes, what eBay calls PETs, short for prototype environments. Time limits of 90 days are set on the
- 18. use of the PETs, preventing storage space from being indefinitely tied up, and individual business units are limited to the number of PETs they can run. If a prototype is deemed to be a success and of continuing value, the business unit can request that it be brought into full production. Since the parameters of the data mart are already known, the prototypes can be brought into production in a fraction of the time than if they had started from scratch.”13 More recently, eBay and Teradata announced their extension of their joint engineering agreement in order to further improve eBay’s Experimentation Platform as per the following press release: “’eBay continues to operate at the forefront of data warehousing architecture and vision, and this collaboration with Teradata helps ensure eBay.com processes data quickly and efficiently with new breakthrough analytical capabilities. eBay is leveraging advanced analytics technologies at a massive scale in providing the best experience possible for our users,’ said James Barrese, vice president of technology at eBay. ‘The eBay team is well-known for its use of analytics for competitive advantage and for
- 19. thought leadership in the data warehousing space,’ said Scott Gnau, chief development officer, Teradata Corporation. ‘We are happy to extend our engineering collaboration with eBay to include next-generation analytics across a broad range of structured and semi-structured data."14 That collaboration has already resulted in an infrastructure that can quickly spin out what are referred to as ‘virtual data marts.’ These are akin to the analytic sandboxes that Russom included as an alternative to extending the EDW to accommodate analytic workloads. These virtual spaces combine views and aggregations on the EDW. Additional data can be added by mart users. The sandboxes are instantaneously created using self–service interfaces that are configured to manage a mart where some permissions, quotas, etc. have been already established, but where an end-user can request the data to be loaded and has control over certain other mart parameters. Figure One is an example interface to an eBay virtual data mart, and Figure Two shows the process: Figure One: Virtual Data Mart Self-Service Interface at eBay 7
- 20. Figure Two: The Process for Creating Virtual Data Marts The virtual data mart exists in a partition separate from the EDW, and in the Teradata EDW, it relies on the workload management software to deliver with assurance on many virtual data mart service level agreements at once. Teradata’s approach to supporting analytics facilitates the variety of architectural configurations Russom has identified as shown in Figure Three: Figure Three: Teradata Options for Extending EDWs for Analytics 8 Many have referred to eBay’s data mart approach by the phrase ‘analytics as a service’ (some abbreviate this as ‘AaaS’). The approach is also referred to as ‘agile analytics,’ but in that usage, it is important to clarify it’s the infrastructure, and the ability to quickly
- 21. 9 perform analytics that are reflected in the use of the term agile, not the development methodology per se. Oliver Ratzesberger of eBay blogged about the infrastructure on xlmpp.com as follows: “Think of it as providing utility computing for analytics to anyone within or even outside your organization. Analytics as a Service is not limited to a single database or software, but the ability to turn a general-purpose analytical platform into a shared utility for an enterprise. It's an advanced self- service model that allows groups to leverage virtual systems for their individual data processing needs, at a cost that undercuts any data mart or cascaded systems implementation. In addition the biggest advantage to the user groups of such services is that ALL other organizational data is automatically at their immediate disposition. The real beauty of this concept is that, the more virtual analytical systems you deploy, the better the overall scalability and the higher the cost savings. With dozens or hundreds of virtual systems, chances are that more and more of them leverage processing at different times and frequencies, one of the main selling points of virtualization in the first place.
- 22. All of this is only possible if you are able to implement a highly resilient infrastructure that delivers availability and can handle virtually any workload - known or unknown - optimized or not, even and especially 'bad' workload. The platform has to be able to tightly control dozens to hundreds of virtual partitions, with variable and workload dependent prioritization schemes, hard or soft limits, any form of mixed workload, batch and streaming data feeds. On any given day our systems process models and queries that have never been seen before. For us, Analytics is a Service is becoming more and more a utility computing platform that enables agile prototyping for the Business. Analytics as a Service - or PET - as we internally call them, have become THE win-win for the organization.15 The notion of virtual data marts, sandboxes and PETs has conjured up the historical debate about the virtues of relying on a federated data mart approach vs. a completely centralized enterprise data warehouse approach to provide an organization’s business intelligence capability. The debate became renown as staunch allies of the two different approaches had historically lined up steadfastly behind each option: Ralph Kimball and Bill Inmon. Inmon, the person credited with being the founder of data warehousing, in consistent fashion to his passion for EDW, recently lashed out
- 23. at data mart virtualization or what he referred to as ‘virtual data warehousing’: “Have you ever been to a fair with the game where a mechanical gopher pops out of a hole and it is your job to whack it when it appears? Once you whack the gopher, it is only a short amount of time before it reemerges from another hole. This is a good game for 4-year-olds, but it is very frustrating for adults. A virtual data warehouse is like this carnival game. I believe virtual data warehouses are inane. Just when you think this incredibly inane idea has died and just when someone has delivered it what should have been a deathly blow, out it pops again from another hole. The virtual data warehouse just won’t die, no matter how hard or how many times it gets whacked.16 This analysis led James Kobelius, an analyst with Forrester Research, to pen an article titled, “Inmon’s Virtiolic Slap at Virtual Data Warehousing Does Not Withstand Scrutiny.” He refers to an overall data federation approach and defines it as follows: “Data federation is any on-demand approach that queries information objects 10
- 24. from one or more sources; applies various integration functions to the results; maps the results to a source-agnostic semantic-abstraction model; and delivers the results to requesters. Nothing in the scoping of data federation necessarily requires the multi-source aggregation and joining that Inmon puts at the heart of ‘virtual DW.’ For starters, his definition of virtual data warehousing is oddly vague and questionably narrow: ‘a virtual data warehouse occurs when a query runs around to a lot of databases and does a distributed query.’ Essentially, Inmon defines ‘virtual DW’ as the ability to a) farm out a query to be serviced in parallel by two or more distributed databases, b) aggregate and join results from those databases, and c) deliver a unified result set to the requester. That’s an important query pattern, but not the only one that should be supported under (pick your quasi-synonym) data federation, data virtualization, or enterprise information integration (EII) architectures. My basic objection to Inmon’s line of discussion is that he treats data federation as mutually exclusive from the enterprise DW (EDW), when in fact they are highly complementary approaches, not just in theory but in real-world deployments. Yes, data federation can be deployed as an alternative to traditional EDWs, providing direct interactive access to online transactional processing (OLTP) data stores.
- 25. However, data federation can also coexist with, extend, virtualize, and enrich EDWs...”17 One thing is clear from Kobelius’ discussion is that the classic textbook debate regarding data marts vs. EDWs is now entering a new, much more complex chapter. With advanced analytics garnering significant interest from the business side of the house, eBay’s infrastructure is ahead of its time – and the architecture is likely going to be scrutinized not just from the technical elegance of the solution (although it is very sophisticated), but the proof is also in the massive scaling of the business experiments that can be conducted - and the ability of those experiments to drive business value. eBay’s ‘Extreme’ Extension eBay’s Experimentation Platform delivers on extending an EDW to efficiently and effectively support advanced analytics – and a lot of those analytics are being done at the same time by many decision makers throughout eBay’s many functional areas. Appendix One shows the architecture of eBay’s analytics core. Because virtual data marts are contained in the EDW, the cost of creating new data marts for each department/unit that might need to be doing analytics is drastically reduced. A new data mart’s total cost of ownership can easily exceed $500K. The biggest cost drivers are maintaining the separate databases, doing the weekly/daily/hourly data
- 26. transfers, dealing with data inconsistencies, managing data redundancy and increased complexity, and of course, dealing with what might be referred to as ‘time to market’ for new analytics needs. Over 85% of eBay’s analytics workload is new and unknown – this workload is not routine report generation or predictable OLAP query loads. eBay leaders often say, “The metrics you know are cheap; the ones you don’t know are expensive, but they’re also high in potential ROI”18 eBay’s virtual data marts can be offered at no cost to the business. In 2010, a new project started in eBay’s collaboration with Teradata and began with eBay's purchase of the Teradata Extreme Data Appliance. Starting at six petabytes in size, the Teradata appliance can analyze and store 30 terabytes of data each day. The project will focus on site analytics through web logs, a layer deeper than clickstream data [Reuters, May 6, 2010]. This newest collaboration represents an architectural addition to eBay’s Experimental Platform in the form of a separate analytics data mart. Analysts have conjectured that the appliance provides a needed complement to eBay’s EDW for high volume data that, by its very nature, is less valuable on a per-unit storage basis than is the data in the EDW. That data will also be subject to minimal concurrency issues as it is dedicated to a certain type of analysis. The value in this
- 27. additional data lies in the new behavior or operational insight that eBay might gain by analyzing it – this is often referred to as ‘deep analytics.’ Analytics sandboxes within the EDW, on the other hand, are focused on deriving enormous value from the integration of cross-functional business data sets accessed by enterprise-wide users. Figure Four shows the relationship between an EDW and a dedicated high volume data appliance on several important dimensions. Figure Four: EDW and Data Warehouse Appliance Complementarities Experimentation 101 eBay’s Experimentation Platform’s success depends on the innovations its services are instrumental in co-producing. There have been relatively few comprehensive guidelines published to help guide experimentation for online settings that embody the ideals of scientific inquiry. One exception is Kohavi, et al. who focus on web-based controlled experiments, the context relevant to eBay’s online business.19 Following are lessons from their research: 1. Analysis: Sloppy analysis cannot be overcome by good intentions.
- 28. 2. Mining Data: Appropriate benchmarks for experiments are important. Better methods/approaches discovered in rich analysis using machine learning and data mining approaches need to be compared to benchmarks, and they must show a statistically significant benefit. 11 3. Speed Matters: If you think a new treatment might be better than an existing practice, be sure to determine that the efficiency of the new treatment is acceptable in the context of a practical user experience – see to it that the 12 treatment doesn’t actually decrease performance times. 4. Testing Factor Interactions: Conduct single-factor experiments for gaining insights and when making incremental changes; try bold bets and different designs for a new feature – test them against each other, and perturb the winning version to improve it further; when factors are expected to interact, full or fractional factorial designs are appropriate, but limit the number of values per
- 29. factor and assign the same percentages to the treatments as to the controls. 5. Run Continuous A/A Tests: An A/A test is the null test in an experiment – it means to assign users to one of two groups, but expose them to exactly the same experiment. A/A tests can be used to collect data for assessing variability for power calculations - and to test the experimentation system. A null hypothesis should be rejected about 5% of the time when a 95% confidence interval is used. 6. Automate Ramp-Up and Abort: Gradually increase the percentage of users assigned to treatment(s). An experimental system that analyzes the experiment in near real-time can shut down a Treatment if it’s significantly underperforming relative to the Control. An auto-abort reduces the risk of exposing many users to errors; this enables the organization to make bolder bets and innovate faster. Of course, these apply to online vs. offline studies. 7. Determine the Minimum Sample Size: This is aided by the A/A test. A common mistake is to run underpowered experiments. 8. Assign 50% of Users to a Treatment: The authors recommend using 50% of users see the variant in an A/B test. This needs to be translated to the running time for the experiment.
- 30. 9. Beware of Day of the Week Effects: The day of the week may impact the running time of an A/B experiment. At times, it is wise to run an experiment longer in order to mitigate day of week impacts. 10. Agree on the Overall Evaluation Criterion (OEC) Up-Front: Agree on the evaluative criterion before the experiment is run. OEC’s may be derived from organizational objectives, and a single OEC may reflect a combination of multiple objectives. 11. Weigh the Feature Maintenance Costs: Running online experiments can provide results that can be used as input to company decisions, and that can have a dramatic impact on a company’s culture. In eBay’s web-based business, the amount of data about each click, rollover, search parameter or page view time becomes immense when multiplied by the thousands of visitors a site could have on a typical busy day. This data has tremendous value if actionable information can be unlocked to answer questions such as: change their mind?
- 31. preferred listing placements change consumer behavior over a 60-day period? - and long-term visitor activities affect the site’s sales figures? Answering these questions, and others like them, are indicative of the importance of analytics to the bottom line. At eBay, they are relevant to specific goals the company set for 2010. An employee revealed a picture of a sign in an eBay building stating 2010 marketplace priorities as shown in Figure Five.20 The Net Promoter Score shown in the picture refers to a measure of customer sentiment and word of mouth. This metric has been advanced as the “one number you need to grow” by scholars.21 It is defined as follows: “Net Promoter is a customer loyalty metric developed by (and a registered trademark of) Fred Reichheld, Bain & Company, and Satmetrix. The most important proposed benefits of this method derive from simplifying and communicating the objective of creating more "Promoters" and fewer "Detractors" -- a concept claimed to be far simpler for employees to understand and act on than more complicated, obscure or hard-to-
- 32. understand satisfaction metrics or indices. The Net Promoter Score is obtained by asking customers a single question on a 0 to 10 rating scale: ‘How likely is it that you would recommend our company to a friend or colleague?’ Based on their responses, customers are categorized into one of three groups: Promoters (9-10 rating), Passives (7-8 rating), and Detractors (0-6 rating). The percentage of Detractors is then subtracted from the percentage of Promoters to obtain a Net Promoter score. A score of 75% or above is considered quite high. Companies are encouraged to follow this question with an open-ended request for elaboration, soliciting the reasons for a customer's rating of that company or product. These reasons can then be provided to front-line employees and management teams for follow-up action.”22 Figure Five: Revealed Marketplace Goals? 13 Bought Item Velocity (most analysts believe this is a measure of how quickly things sell) and other goals and priorities are represented in this photo, and even if the priorities
- 33. aren’t genuine, they provide insights into eBay’s approach to competing on analytics. One analyst offered the following interpretations of the items on eBay’s leaked priority list:23 • “Market Share - I'm going to guess this is basically saying that eBay will grow with e-commerce. • ‘Retail-like’ trust levels by reducing BBEs and protecting buyers- BBEs are Bad Buyer Experiences, kind of like the Amazon ODR (Order Defect Rate). Inside of here you have all kinds of things that can go wrong like (SNAD - Significantly Not As Described, INR - Item Not Received, etc.) all of which result in a claim or low NPS score, or the dreaded 1/2 stars of death. • Enhance selection and value in CSA - CSA is the acronym for the Clothing Shoes and Accessories (now rebranded Fashion) category. • Deliver value across the site - Great deals across the site. • Scale B2C sellers and improve efficiency - B2C (business to consumer) sellers probably refers to the larger merchants that are coming into the system like Disney, etc. Scaling them means helping them grow
- 34. much larger. Deal of the day is one lever for this, perhaps there are more to come. • Defend C2C seller business - C2C are consumer to consumer sellers - a.k.a. 'small sellers' or 'casual sellers'. • Improve the eBay buyer experience - Self explanatory • Build our advertising business - I'm assuming this is something like AdCommerce and ads on the site and not eBay classifieds (not part of marketplaces). Experimentation in the Trenches EBay’s Research Lab publishes exemplary experiments and the innovations they support (http://labs.ebay.com/erlpublications.html). In the following, two such experiments are discussed along with their findings. Both experiments demonstrate how the test-and- learn process can impact how eBay interfaces might be improved. Experiment One [Duong, Sundaresan, Parikh and Shen (Univ of Michigan and eBay), “Modeling Seller Listing Strategies,” 2010]: Two important questions relevant to eBay priorities discussed above are: 1) What sellers’ strategies work best to yield high and profitable sales? and 2) Can we estimate
- 35. how changes in the eBay interfaces impact sellers’ strategies and thereby make changes catered to sellers’ needs? For this experiment, the data captured eBay sellers’ sales activities over a certain period of time to investigate sellers’ fixed-price product listing strategies. A dataset was constructed as exemplified in Table One: Table One: Example Dataset 14 http://labs.ebay.com/erlpublications.html 15 Each tuple contains descriptive features of an item listed for sale in the iPod nano category. Data for a listing includes the seller identification, the product identification, the listing’s start and end dates, the listing’s price, the title and the average shipping cost. Experimenters first did product clustering to capture and summarize a seller’s strategy for selling different products. From this, they determined that eBay sellers do consistently rely on certain strategies to decide how to list their inventory on eBay. Experimenters
- 36. then built a model to accurately predict sellers’ strategies. From this model, and by using actual sales figures, the model was calibrated to empirically demonstrate top-ranked seller’s strategies across three different product categories. The experiment highlighted the model’s capability for capturing sellers’ strategies as shown by contrasting it with a semi-random baseline model. Prediction power was enhanced by incorporating past listings in the analysis. The overall evaluation criterion was a combination of sale- through rate and average revenue per listing. Experiment Two [Adapted from "Rated Aspect Summarization of Short Comments. Y. Lu and C. Zhai of University of Illinois Urbana-Champagne, N. Sundaresan of eBay. WWW 2009, Madrid, Spain, April 2009. 131-140.]: Buyers leave feedback comments on eBay describing a transaction. They rate the transaction as positive, neutral or negative. Usually, there are a large number of comments about a target – maybe hundreds of thousands – and that number keeps growing as more and more people keep contributing online. The key question for this experiment was: How can we help a customer more easily digest such a large number of comments? The experimenters hypothesized that what is called a ‘rated aspect summary’ would help customers. A rated aspect summary provides a decomposed view of the overall ratings for the major aspects so that a customer can gain different perspectives
- 37. towards the target entity. One rationale for the rated aspect summary is that not all customers have the same needs and desires from a transaction. For example, a potential buyer may be willing to compromise on shipping time but not on product quality. In this instance, it isn’t sufficient to just know the overall ratings of a seller; the buyer would be better off knowing the ratings of that seller on a specific aspect – quality. A dataset was created by collecting feedback comments for 28 eBay sellers with high feedback scores. For processing the text of comments, the OpenNLP toolkit ( http://opennlp.sourceforge.net/ ) was used to identify phrases in the form of a pair of ‘head term’ and ‘modifier used’ categorization. In their dataset, sellers with high feedback scores received a large number of comments, 57,055 on average. Buyers tend to use only a few phrases in each comment – after parsing the comments, there were about 1.5 phrases per comment. That preprocessing reduced the data by about 40%, eliminating terms like the superlative “AAA+++” which does not provide much detailed information on aspects. The next step in their methodology evaluated alternate aspect clustering algorithms. They counted as a ‘match’ for a particular algorithm those instances where the algorithm’s ‘frequent term’ matched one of the terms in a human identified cluster. They then determined the top k clusters – those with the largest size – such that aspect coverage at the top k clusters was defined as the number of aspect matches within the top k clusters divided by k. They then used
- 38. clustering accuracy for determining those final sets of clusters. They found that an algorithm called Structured http://opennlp.sourceforge.net/ Probabalistic Latent Analysis achieved the best performance (was most consistent with human generated clusters). Table Two shows a sample result of a rated aspect summarization. Table Two: Sample Result of Rated Aspect Summarization This experiment was among the first to formally define the problem of rated aspect summarization, and it evaluated different general methods for addressing the problem. Results show that while aspect clustering is a subjective task for humans, some algorithms perform well in matching human counterpart performance. A follow-on experiment will be needed to determine if rated aspect summarization provides eBay buyers with better information when they consider tradeoffs between aspects like delivery times and product quality in customer feedback summaries. Experiments and ROII
- 39. 16 Bob Page reflected on his short time with eBay, and he realized his blog of March 20th, 2010 that announced his arrival at eBay was right on. He had been right about the people, leadership commitment and eBay’s adherence to the holistic vision that aligned with his own thinking. That common vision of ‘central data, distributed analysis’ was reinforced by the Experimentation Platform and its recent deep dive analytics extensions. With over 5000 analysts, the scale was staggering. He knew that getting a full picture of ROI required a new way of thinking. He had been picturing some graphs – and some kind of an innovation effectiveness curve that he had seen in a business magazine. He remembered a quote in the article, “Profitable innovation cannot be bought. Simply spending more usually leads to a waste of resources on increasingly marginal projects.”24 It had him thinking. On the vertical axis of the graph he recalled was ‘Return on Innovation Investment’ (ROII), and the horizontal axis was labeled ‘Innovation Investment’ ($). There was also a horizontal line reflecting the cost of capital. There were two arcs – sort of a before and after snapshot. A major managerial focus was on how to shift the curve in the proper directions. He took out his iPad, loaded his favorite drawing app, and he put quickly together the graphs shown in Figure Six.
- 40. Figure Six: Innovation Effectiveness Curves 17 In graph A, he reflected the decrease in innovation $ invested based on a contrast of what the old Oracle system would have required in upgrades to handle today’s loads versus eBay’s investment in the Teradata system and its virtual data marts (AaaS). In fact, it had been estimated that a new data mart can be brought online for between $500K and $1 million, and that AaaS saved eBay from needing to support 100 different data marts (Ratzesberger, Oliver, 2008 talk at Teradata Partners Conference). The Teradata system thereby saved millions. In graph B, he contemplated that even if the costs of fixing the Oracle system for advanced analytics and in acquiring the Teradata system had been the same, the ability to more quickly get innovations discovered and into production represented a payoff for the Teradata approach. Graph C was more complex, and he would think more about it later. The issue reflected exactly what his leadership wanted him to look into. They posed the question: How can we account for per experiment ROII lift to assess any new policies, standards, controls and incentives we might put into place
- 41. to encourage company-wide innovation through experimentation? He had a feeling for what the corollary question was: How can we innovate faster, more and at lower platform cost? He smiled and knew that answering these two questions may themselves require a set of well-designed experiments in order to make headway. 18 References 1 8 Jarzemsky, M., “Moody’s Upgrades EBay, Cites Strong Performance, Liquidity,” Dow Jones Newswires, /19/2010, http://online.wsj.com/article/BT-CO-20100819- 709042.html 2 Ju, Stephen in Savitz, E., “eBay Should Start and Amazon- Style Fulfillment Center,” News from arron’s Silicon Valley Bureau, 5/6/2010, B http://blogs.barrons.com/techtraderdaily/2010/07/06/ebay- should-get-start-amazon-style-fulfillment-unit-rbc-says/ 3 Dawson, Chris, “ Rakutan – Serious Competition for eBay and Amazon,” TameBay, 5/21/1010, ttp://tamebay.com/2010/05/rakutan-serious-competition-for-
- 42. ebay-amazon.htmlh 4 Chao, L. “Taobao, Yahoo Japan Look for sBay-Style Heft, 5/10/2010, Wall Street Journal, ttp://online.wsj.com/article/SB100014240527487036747045752 35333773371988.htmlh 5 Davenport, T. “How to Design Smart Business Experiments, Harvard Business Review, February, 2009, ttp://custom.hbsp.harvard.edu/b01/en/implicit/p.jhtml?login=SA SM033009S&pid=R0902Eh 6 King, H. “The View from the C-Suite: eBay CEO John Donahoe,” GreenBiz.com, 5/17/ 2010, ttp://www.greenbiz.com/blog/2010/05/17/view-c-suite-ebay- ceo-john-donahoe?page=fullh 7 Davenport, T. op cit., 2010. 8 Steiner, I. “Is Technological Innovation the Key to eBay’s Turnaround?” Auction Bytes.com, 5/26/2010, ttp://www.auctionbytes.com/cab/cab/abn/y10/m05/i26/s01h 9 Page, B., “Hello eBay,” BOBPAGE.NET, 4/20/2010, http://bobpage.net/2010/03/20/hello-ebay/ 10 “Panel Session: The Future of Web Analytics,” FutureWeb, 4/29/2010, http://www.elon.edu/e- web/predictions/futureweb2010/future_web_analytics.xhtml
- 43. 1 1 Interview with Bob Page, eBay, 8/16/2010. 12 Russom, P. TDWI Checklist Report: Data Requirements for Advanced Analytics,” 9/2009, ttp://www.teradata.org/t/analyst-reports/TDWI-checklist-report- data-requirements-for-advanced-h analytics/?type=AR 13 Duvall, M. “eBay Looks to Pioneer Analytics as a service,” CIOZone, retrieved 8/19/2010, ttp://www.ciozone.com/index.php/Business-Intelligence/EBay- Looks-To-Pioneer-Analytics-As-A-h Service.html 14 “eBay and Teradata Collaborate to Develop Deep Data Analytic Solution s,” PRNewswire, 5/6/2010, ttp://www.prnewswire.com/news-releases/ebayr-and-teradata- collaborate-to-develop-deep-data-analytic-h solutions-92978514.html 15 Ratzesberger, O., “Analytics as a Service,” 4/21/2008,
- 44. retrived from http://www.xlmpp.com/ on /31/2010. 8 16 Inmon, B. “The Elusive Virtual Data Warehouse,” BeyeNetwork, 4/19/2010, http://www.b-eye- network.com/view/9956 http://online.wsj.com/article/BT-CO-20100819-709042.html http://blogs.barrons.com/techtraderdaily/2010/07/06/ebay- should-get-start-amazon-style-fulfillment-unit-rbc-says/ http://blogs.barrons.com/techtraderdaily/2010/07/06/ebay- should-get-start-amazon-style-fulfillment-unit-rbc-says/ http://tamebay.com/2010/05/rakutan-serious-competition-for- ebay-amazon.html http://online.wsj.com/article/SB10001424052748703674704575 235333773371988.html http://custom.hbsp.harvard.edu/b01/en/implicit/p.jhtml?login=S ASM033009S&pid=R0902E http://www.greenbiz.com/blog/2010/05/17/view-c-suite-ebay- ceo-john-donahoe?page=full http://www.auctionbytes.com/cab/cab/abn/y10/m05/i26/s01 http://bobpage.net/2010/03/20/hello-ebay/ http://www.elon.edu/e- web/predictions/futureweb2010/future_web_analytics.xhtml
- 45. http://www.elon.edu/e- web/predictions/futureweb2010/future_web_analytics.xhtml http://www.teradata.org/t/analyst-reports/TDWI-checklist- report-data-requirements-for-advanced-analytics/?type=AR http://www.ciozone.com/index.php/Business-Intelligence/EBay- Looks-To-Pioneer-Analytics-As-A-Service.html http://www.prnewswire.com/news-releases/ebayr-and-teradata- collaborate-to-develop-deep-data-analytic-solutions- 92978514.html http://www.xlmpp.com/ http://www.b-eye-network.com/view/9956 http://www.b-eye-network.com/view/9956 19 17 Kobielus, J, “Inmon’s Vitriolic Slap at ‘Virtual Data Warehousing’ Does Not Withstand Scrutiny,” nformation Management, 4/3/2010, I http://www.information- management.com/blogs/inmon_kobielus_virtual_data_warehousi ng_challenge-10015212-1.html
- 46. 1 U 8 Ratzesberger, O. “Agile Enterprise Analytics,” 2010 SMDB 2010 Workshop Keynote Address, Duke niversity, 2/2010, http://www.cs.duke.edu/smdb10/_files/toc_data/SMDB/keynote/ keynote.pdf 1 M 9 Kohavi, R., R. Longbotham, D. Sommerfield, R. M. Henne, “Controlled Experiments on the Web,” Data ining and Knowledge Discovery, 2/2009, http://portal.acm.org/citation.cfm?id=1485091 20 ttp://yfrog.com/0943ckjh retrieved 9/1/2010. Reichheld, F. F. “The One Number You Need to Grow,” Harvard Business Review, Product #5534, ecember, 2003, Accessed 12/2010 at ttp://www.netzkobold.com/uploads/pdfs/the_one_number_you_n
- 47. eed_to_grow_reichheld.pdf 21 D h 22 http://en.wikipedia.org/wiki/Net_Promoter , Accessed 9/2/2010. 23 Wingo, S., “Decoding and Analyzing eBay’s Stated 2010 Marketplace Priorities, 5/25/2010, ttp://www.istockanalyst.com/article/viewarticle/articleid/41525 58h 24 Kandybin, A. and M. Kihn, “Raising Your Return on Innovation Investment, s+b, 8/2005, http://www.strategy-business.com/media/file/rr00007.pdf
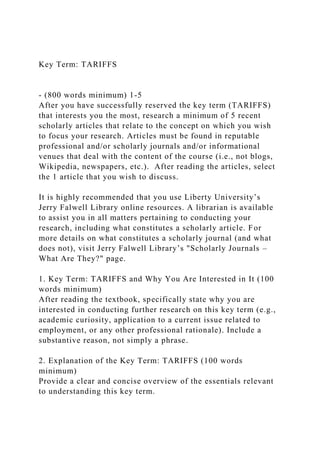
- 50. 558 http://www.strategy-business.com/media/file/rr00007.pdf 20 Appendix One: eBay’s Experimental Platform Architecture eBay Analytics Core Relational Data XML, name/value, raw Teradata Teradata 2.2PB 6.6PB Primary Secondary Phoenix, AZ Sacramento, CA
- 51. Linux Linux Solaris 2.2PB2.5PB MPP MPP MPP/HPC/GridMPP/HPC/Grid Sun Fire 4xxx Relational Data Local Interconnect MicroStrategy Wide Area Interconnect 1000 miles Solaris Business
- 52. Objec ts Unica SOA/DAL Ab Initio Informatica UC4 SOA Data Access Data Integration Crystal SAS SQL Sun Fire 4xxx Local Interconnect Golden Gate BES MAX MAX BUSI 604 100 Integrated Discussion Boards 1-4 Rubric
- 53. Criteria Levels of Achievement Content 70% Advanced 92-100% Proficient 84-91% Developing 1-83% Not present Part 1-- Key Term/Concept Reservation Part 2 -- Main Thread 37 to 40 points Major Points are supported by all of the following: Your thread must be placed in the Discussion Board Forum text box and adhere precisely to the following headings: · KEY TERM and WHY YOU ARE INTERESTED IN IT · EXPLANATION OF THE KEY TERM · MAJOR ARTICLE SUMMARY · DISCUSSION · REFERENCES
- 54. 34 to 36 points Major Points are supported by most of the following: Your thread must be placed in the Discussion Board Forum text box and adhere precisely to the following headings and format: · KEY TERM and WHY YOU ARE INTERESTED IN IT · EXPLANATION OF THE KEY TERM · MAJOR ARTICLE SUMMARY · DISCUSSION · REFERENCES 1-33 points Major Points are supported by some of the following: Your thread must be placed in the Discussion Board Forum text box and adhere precisely to the following headings and format: · KEY TERM and WHY YOU ARE INTERESTED IN IT · EXPLANATION OF THE KEY TERM · MAJOR ARTICLE SUMMARY · DISCUSSION · REFERENCES 0 points No work submitted. Or
- 55. Duplicate concept reservations will not earn credit under any circumstance—this includes work submitted in a previous course Part 3 – Replies 28 to 30 points A minimum of 3 substantive and comprehensive replies to other student postings are submitted, in at least one of the following ways: · compare/contrast the findings of others with your research; · compare how the findings of others relates/adds to the concepts learned in the required readings; and/or · share additional empirical knowledge regarding global business -- or international experiences you may have had -- relative to the postings of others. 25 to 27 points A minimum of 2 substantive and comprehensive replies to other student postings are submitted, in at least one of the following ways: · compare/contrast the findings of others with your research; · compare how the findings of others relates/adds to the concepts learned in the required readings; and/or · share additional empirical knowledge regarding global business -- or international experiences you may have had -- relative to the postings of others.
- 56. 1-24 points A minimum of 1 substantive and comprehensive reply to other student postings are submitted, in at least one of the following ways: · compare/contrast the findings of others with your research; · compare how the findings of others relates/adds to the concepts learned in the required readings; and/or · share additional empirical knowledge regarding global business -- or international experiences you may have had -- relative to the postings of others. 0 points No work submitted. Or Duplicate concept reservations will not earn credit under any circumstance—this includes work submitted in a previous course Structure 30% Advanced 92-100% Proficient 84-91% Developing 1-83% Not present Posted in Text Box 5 points
- 57. All 3 parts of the Forum are posted in the text box. 4 points 2 parts of the Forum are posted in the text box. 1 to 3 points 1 part of the Forum is posted in the text box. 0 points No parts of the Forum are posted in the text box. Or Duplicate concept reservations will not earn credit under any circumstance—this includes work submitted in a previous course Grammar/Spelling 5 points Proper spelling and grammar are used. 4 points Between 1–2 spelling and grammar errors are present. 1 to 3 points Between 3–4 spelling and grammar errors are present. 0 points More than 4 spelling and grammar errors are present. Word Count 9 to 10 points At least 800 words are submitted for Part 2; 450 words are submitted for Part 3. 8 points
- 58. 799 to 750 words are submitted for Part 2; 449 to 400 words are submitted for Part 3. 1 to 7 points 749 to 100 words are submitted for Part 2; 399 to 100 words are submitted for Part 3. 0 points Less than 100 words are submitted for Part 2; less than 100 words are submitted for Part 3. Part 2 References are in APA format 9 to 10 points All references are in APA format. 8 points Most references are in APA format. 1 to 7 points Some references are in APA format. 0 points No references are in APA format. Important Notes: All parts of the DB are posted in the text box -- not as an attachment -- before or on the due date. In the event formatting is lost in the text box, you may also attach your Word file to the text box as evidence of proper formatting. BUSI 604 Discussion Board Forum 1–4 Instructions
- 59. Important Assignment Deadlines: · Part 1 due by 11:59 p.m. (ET) on Thursday of the first of the assigned modules/weeks. · Part 2 due by 11:59 p.m. (ET) on Monday of the second of the assigned modules/weeks. · Part 3 due by 11:59 p.m. (ET) on Sunday of the second of the assigned modules/weeks. · Note: For Module Week 8, Part 3 is due by Friday, 11:59pm EST, since that is the last day of class. No work is accepted after the course ends. Part 1 (no word count) As you read the chapters assigned to each module/week, you will find some concepts more interesting and applicable to your personal or work situation than others. Review the key terms listed in the assigned chapters; then, submit a preliminary thread indicating the key term that you wish to reserve for your thread for that module/week. Check the discussion board area prior to submitting your reservation to ensure no one else has chosen that key term. In the event the key term you wish to explore is already reserved by someone else, simply move on to another key term in your readings. Duplicate key terms will not earn credit under any circumstance—this includes work submitted in a previous
- 60. course. Do not ask the instructor to accept a duplicate key term, as this is not fair to those who followed these explicit directions. Include the exact key term you selected in your thread’s subject line. Submit Part 1 to the Discussion Board Forum by 11:59 p.m. (ET) on Thursday of the first of the assigned modules/weeks. Part 2 (800 words minimum) After you have successfully reserved the key term that interests you the most, research a minimum of 5 recent scholarly articles that relate to the concept on which you wish to focus your research. Articles must be found in reputable professional and/or scholarly journals and/or informational venues that deal with the content of the course (i.e., not blogs, Wikipedia, newspapers, etc.). After reading the articles, select the 1 article that you wish to discuss. It is highly recommended that you use Liberty University’s Jerry Falwell Library online resources. A librarian is available to assist you in all matters pertaining to conducting your research, including what constitutes a scholarly article. For more details on what constitutes a scholarly journal (and what
- 61. does not), visit Jerry Falwell Library’s "Scholarly Journals – What Are They?" page. Your thread must be placed in the Discussion Board Forum textbox (not as an attachment) and adhere precisely to the following headings and format: 1. Key Termand Why You Are Interested in It (100 words minimum) After reading the textbook, specifically state why you are interested in conducting further research on this key term (e.g., academic curiosity, application to a current issue related to employment, or any other professional rationale). Include a substantive reason, not simply a phrase. 2. Explanation of the Key Term(100 words minimum) Provide a clear and concise overview of the essentials relevant to understanding this key term. 3. Major Article Summary(300 words minimum) Using your own words, provide a clear and concise summary of the article, including the major points and conclusions. 4. Discussion
- 62. In your own words, discuss each of the following points: a. How the cited work relates to your above explanation AND how it relates specifically to the content of the assigned module/week. This part of your thread provides evidence that you have extended your understanding of this key term beyond the textbook readings. (150 words minimum) b. How the cited work relates to the other 4 works you researched. This part of your thread provides evidence that you have refined your research key term to a coherent and specialized aspect of the key term, rather than a random selection of works on the key term. The idea here is to prove that you have focused your research and that all works cited are related in some manner to each other rather than simply a collection of the first 5 results from your Internet search. (150 words minimum) 5. References A minimum of 5 recent scholarly articles (not textbooks, Wikipedia, or other popular reading magazines), in current APA format, must be included and must contain persistent links so others may have instant access. In the event that formatting is lost or corrupted when submitting the thread, attach the Microsoft Word document to your thread as evidence that your work was completed in the proper format. Access the following URL from the Jerry Falwell Library for instructions on creating
- 63. persistent links: How to Create a Persistent Link. Submit Part 2 to the Discussion Board Forum by 11:59 p.m. (ET) on Monday of the second of the assigned modules/weeks. Part 3 (150 words minimum, per reply) Additionally, you will reply to a minimum of 3 other classmates’ threads. Thus, you will have submit substantive written responses to a minimum of 3 other classmates’ threads. Submit Part 3 to the Discussion Board Forum by 11:59 p.m. (ET) on Sunday of the second of the assigned modules/weeks. · Note: For Module Week 8, Part 3 is due by Friday, 11:59pm EST, since that is the last day of class. No work is accepted after the course ends.