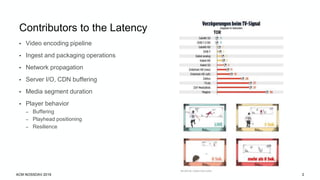
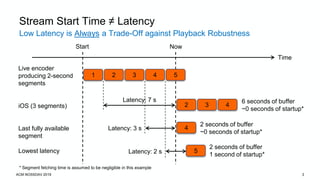
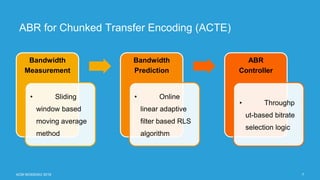
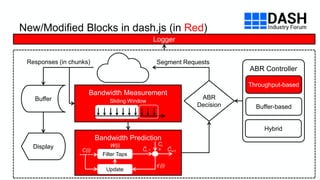
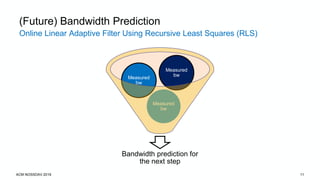
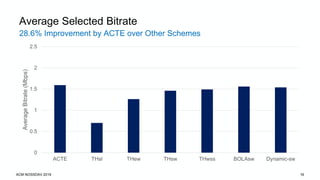
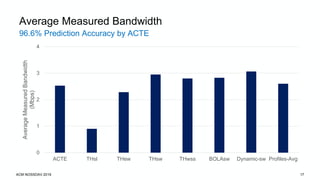
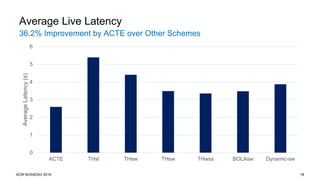
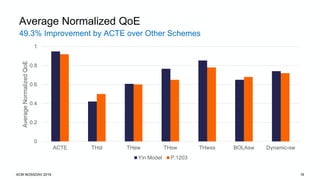
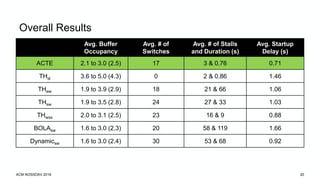
ACM NOSSDAV – June 2019
Bandwidth Prediction in Low-Latency Chunked Streaming
Abdelhak Bentaleb, Christian Timmerer, Ali C. Begen, and Roger Zimmermann
• Video encoding pipeline
• Ingest and packaging operations
• Network propagation
• Server I/O, CDN buffering
• Media segment duration
• Player behavior
– Buffering
– Playhead positioning
– Resilience
Contributors to the Latency
2ACM NOSSDAV 2019
3
Low Latency is Always a Trade-Off against Playback Robustness
Stream Start Time ≠ Latency
Time
Live encoder
producing 2-second
segments
iOS (3 segments)
Last fully available
segment
Lowest latency
1 2 3 4
Start Now
2 3 4
4
5
Latency: 7 s
Latency: 3 s
Latency: 2 s
6 seconds of buffer
~0 seconds of startup*
2 seconds of buffer
~0 seconds of startup*
2 seconds of buffer
1 second of startup*
* Segment fetching time is assumed to be negligible in this example
5
ACM NOSSDAV 2019
CMAF Chunks are One or More Frames
Refresher on CMAF
RAP …
RAP
…
RAP
…
RAP
…
Fragment Fragment Fragment Fragment
Segment Segment
Track File
…
…
…
Encoding
Packaging
Encryption
CMAF
Header
Seamless switching can only happen
at fragment boundaries
4ACM NOSSDAV 2019
Live Twitch Data* (Nov. 2018)
Bandwidth Measurement is Tricky
0
1
2
3
4
5
0 100 200 300 400 500 600
Bitrate(Mbps)
Time (s)
tc Bandwdith Measured Bandwidth Selected Bitrate
* Encoded at {0.18, 0.73, 1.83, 2.5, 3.1, 8.8} Mbps with three resolutions of {540p, 720p, 1080p}, and packaged with CMAF
ACM NOSSDAV 2019 5
No upshifting despite
the available bandwidth
ABR for Chunked Transfer Encoding (ACTE)
Bandwidth
Measurement
• Sliding
window based
moving average
method
Bandwidth
Prediction
• Online
linear adaptive
filter based RLS
algorithm
ABR
Controller
• Throughp
ut-based bitrate
selection logic
ACM NOSSDAV 2019 7
ACM NOSSDAV 2019 8
New/Modified Blocks in dash.js (in Red)
ABR Controller
Throughput-based
Buffer-based
Hybrid
ABR
Decision
Bandwidth Measurement
Bandwidth Prediction
Buffer
Display
Segment RequestsResponses (in chunks)
Logger
Sliding Window
Filter Taps
Update
C(i)
W(i)
𝜖(i)
Ĉi+1
Ci
+Ĉi -
Identifying the “Good” Chunks
ACM NOSSDAV 2019 9
Bandwidth Measurement
• Compute the download rate for the chunks where the transmission is network limited
– If there is a negligible idle period after a chunk download, use that chunk, otherwise disregard it
Media
timeline
Chunk4
Size:Q4
Chunk5
Size:Q5
Chunk6
Size:Q6
Chunk7
Size:Q7
b4e4e5 b5e6 b6
e7 b7
……
Chunk download
beginning time (unknown)
Chunk download
end time
Chunk download end time is
known from HTTP Fetch API
Chunk size is determined
from the received data
Identifying the “Good” Chunks without the bn Values
ACM NOSSDAV 2019 10
Bandwidth Measurement
• Reasonable assumption: Idle periods cannot happen within a chunk, happen only
between the chunks
– Since the server pushes the chunks at full network speed
• For each chunk, compute its download rate, which equals its size divided by this
chunk’s end time minus previous chunk’s end time
– If this download rate is close (+/- 20%) to the average segment download rate, there must be
significant idle time between these two chunks
• Transmission is source limited
• Disregard the current chunk
– Else, the idle time is negligible
• Transmission is network limited
• The current chunk’s download rate is a good approximation of the available bandwidth
• Use a sliding window based moving average method over the last three successful
chunk downloads
Online Linear Adaptive Filter Using Recursive Least Squares (RLS)
ACM NOSSDAV 2019 11
(Future) Bandwidth Prediction
Bandwidth prediction for
the next step
Measured
bw
Measured
bw
Measured
bw
Throughput-Based Bitrate Selection Logic
ACM NOSSDAV 2019 12
ABR Controller
• Find the best bitrate to pick to
– Minimize the estimated error
– Maximize QoE
• While respecting
– Target latency
– Network capacity
– Buffer occupancy level
Experimental Setup
ACM NOSSDAV 2019 13
Setup for Performance Evaluation
• Two machines, one running the modified dash.js player, one acting as a bandwidth
shaping proxy
– tc-NetEm to shape the network capacity according to DASH-IF’s bandwidth variation profiles
– iPerf to generate random TCP-based cross traffic ranging from 0.5 to 2 Mbps
• Origin and edge servers from Cloudflare with CMAF packaging and delivery enabled
• Content and Player Settings
– Tears of Steel: https://mango.blender.org/download/
– Segments of six seconds, chunks of 0.5 second
– Video bitrate levels of {0.7, 1.3 and 2.0} Mbps
– Min and max (target latency) buffer thresholds of 0.5 and 3.2 seconds, respectively
Schemes Implemented
ACM NOSSDAV 2019 14
Setup for Performance Evaluation
Bandwidth
Measurement
ABR Schemes
Throughput-based Buffer-based Hybrid
SLBW THsl - -
EWMA THew - -
SWMA THsw BOLAsw Dynamicsw
WSSL THwss - -
SLBW: Segment-based last bandwidth
EWMA: Chunk-based exponentially weighted moving average
SWMA: Chunk-based sliding window moving average
WSSL: Will’s simple slide-load
15
Performance Metrics
• Live latency
– dash.js’ live latency function (not including the encoding time)
• QoE models:
– Yin QoE
– ITU-T Rec. P.1203 QoE (Mode 0): bitrate, stall duration, frame rate, and resolution.
• Bandwidth prediction accuracy
– Root Mean Square Error (RMSE) to compute the differences between the measured and
predicted bandwidth values
ACM NOSSDAV 2019
Average Bitrate Bitrate Switches Stall Duration Startup Delay
28.6% Improvement by ACTE over Other Schemes
ACM NOSSDAV 2019 16
Average Selected Bitrate
0
0.5
1
1.5
2
2.5
ACTE THsl THew THsw THwss BOLAsw Dynamic-sw
AverageBitrate(Mbps)
96.6% Prediction Accuracy by ACTE
ACM NOSSDAV 2019 17
Average Measured Bandwidth
0
1
2
3
4
ACTE THsl THew THsw THwss BOLAsw Dynamic-sw Profiles-Avg
AverageMeasuredBandwidth
(Mbps)
36.2% Improvement by ACTE over Other Schemes
ACM NOSSDAV 2019 18
Average Live Latency
0
1
2
3
4
5
6
ACTE THsl THew THsw THwss BOLAsw Dynamic-sw
AverageLatency(s)
49.3% Improvement by ACTE over Other Schemes
ACM NOSSDAV 2019 19
Average Normalized QoE
0
0.2
0.4
0.6
0.8
1
ACTE THsl THew THsw THwss BOLAsw Dynamic-sw
AverageNormalizedQoE
Yin Model P.1203
ACM NOSSDAV 2019 20
Overall Results
Avg. Buffer
Occupancy
Avg. # of
Switches
Avg. # of Stalls
and Duration (s)
Avg. Startup
Delay (s)
ACTE 2.1 to 3.0 (2.5) 17 3 & 0.76 0.71
THsl 3.6 to 5.0 (4.3) 0 2 & 0.86 1.46
THew 1.9 to 3.9 (2.9) 18 21 & 66 1.06
THsw 1.9 to 3.5 (2.8) 24 27 & 33 1.03
THwss 2.0 to 3.1 (2.5) 23 16 & 9 0.88
BOLAsw 1.6 to 3.0 (2.3) 20 58 & 119 1.66
Dynamicsw 1.6 to 3.0 (2.4) 30 53 & 68 0.92
ACM NOSSDAV 2019 21
ACTE Outperforms the Existing ABR Schemes
• Consecutive numbers represent the results
– Summary of the average results. Percentage improvements of ACTE’s over the other scheme
Questions?
Thanks

Bandwidth Prediction in Low-Latency Chunked Streaming

  • 1.
    ACM NOSSDAV –June 2019 Bandwidth Prediction in Low-Latency Chunked Streaming Abdelhak Bentaleb, Christian Timmerer, Ali C. Begen, and Roger Zimmermann
  • 2.
    • Video encodingpipeline • Ingest and packaging operations • Network propagation • Server I/O, CDN buffering • Media segment duration • Player behavior – Buffering – Playhead positioning – Resilience Contributors to the Latency 2ACM NOSSDAV 2019
  • 3.
    3 Low Latency isAlways a Trade-Off against Playback Robustness Stream Start Time ≠ Latency Time Live encoder producing 2-second segments iOS (3 segments) Last fully available segment Lowest latency 1 2 3 4 Start Now 2 3 4 4 5 Latency: 7 s Latency: 3 s Latency: 2 s 6 seconds of buffer ~0 seconds of startup* 2 seconds of buffer ~0 seconds of startup* 2 seconds of buffer 1 second of startup* * Segment fetching time is assumed to be negligible in this example 5 ACM NOSSDAV 2019
  • 4.
    CMAF Chunks areOne or More Frames Refresher on CMAF RAP … RAP … RAP … RAP … Fragment Fragment Fragment Fragment Segment Segment Track File … … … Encoding Packaging Encryption CMAF Header Seamless switching can only happen at fragment boundaries 4ACM NOSSDAV 2019
  • 5.
    Live Twitch Data*(Nov. 2018) Bandwidth Measurement is Tricky 0 1 2 3 4 5 0 100 200 300 400 500 600 Bitrate(Mbps) Time (s) tc Bandwdith Measured Bandwidth Selected Bitrate * Encoded at {0.18, 0.73, 1.83, 2.5, 3.1, 8.8} Mbps with three resolutions of {540p, 720p, 1080p}, and packaged with CMAF ACM NOSSDAV 2019 5 No upshifting despite the available bandwidth
  • 7.
    ABR for ChunkedTransfer Encoding (ACTE) Bandwidth Measurement • Sliding window based moving average method Bandwidth Prediction • Online linear adaptive filter based RLS algorithm ABR Controller • Throughp ut-based bitrate selection logic ACM NOSSDAV 2019 7
  • 8.
    ACM NOSSDAV 20198 New/Modified Blocks in dash.js (in Red) ABR Controller Throughput-based Buffer-based Hybrid ABR Decision Bandwidth Measurement Bandwidth Prediction Buffer Display Segment RequestsResponses (in chunks) Logger Sliding Window Filter Taps Update C(i) W(i) 𝜖(i) Ĉi+1 Ci +Ĉi -
  • 9.
    Identifying the “Good”Chunks ACM NOSSDAV 2019 9 Bandwidth Measurement • Compute the download rate for the chunks where the transmission is network limited – If there is a negligible idle period after a chunk download, use that chunk, otherwise disregard it Media timeline Chunk4 Size:Q4 Chunk5 Size:Q5 Chunk6 Size:Q6 Chunk7 Size:Q7 b4e4e5 b5e6 b6 e7 b7 …… Chunk download beginning time (unknown) Chunk download end time Chunk download end time is known from HTTP Fetch API Chunk size is determined from the received data
  • 10.
    Identifying the “Good”Chunks without the bn Values ACM NOSSDAV 2019 10 Bandwidth Measurement • Reasonable assumption: Idle periods cannot happen within a chunk, happen only between the chunks – Since the server pushes the chunks at full network speed • For each chunk, compute its download rate, which equals its size divided by this chunk’s end time minus previous chunk’s end time – If this download rate is close (+/- 20%) to the average segment download rate, there must be significant idle time between these two chunks • Transmission is source limited • Disregard the current chunk – Else, the idle time is negligible • Transmission is network limited • The current chunk’s download rate is a good approximation of the available bandwidth • Use a sliding window based moving average method over the last three successful chunk downloads
  • 11.
    Online Linear AdaptiveFilter Using Recursive Least Squares (RLS) ACM NOSSDAV 2019 11 (Future) Bandwidth Prediction Bandwidth prediction for the next step Measured bw Measured bw Measured bw
  • 12.
    Throughput-Based Bitrate SelectionLogic ACM NOSSDAV 2019 12 ABR Controller • Find the best bitrate to pick to – Minimize the estimated error – Maximize QoE • While respecting – Target latency – Network capacity – Buffer occupancy level
  • 13.
    Experimental Setup ACM NOSSDAV2019 13 Setup for Performance Evaluation • Two machines, one running the modified dash.js player, one acting as a bandwidth shaping proxy – tc-NetEm to shape the network capacity according to DASH-IF’s bandwidth variation profiles – iPerf to generate random TCP-based cross traffic ranging from 0.5 to 2 Mbps • Origin and edge servers from Cloudflare with CMAF packaging and delivery enabled • Content and Player Settings – Tears of Steel: https://mango.blender.org/download/ – Segments of six seconds, chunks of 0.5 second – Video bitrate levels of {0.7, 1.3 and 2.0} Mbps – Min and max (target latency) buffer thresholds of 0.5 and 3.2 seconds, respectively
  • 14.
    Schemes Implemented ACM NOSSDAV2019 14 Setup for Performance Evaluation Bandwidth Measurement ABR Schemes Throughput-based Buffer-based Hybrid SLBW THsl - - EWMA THew - - SWMA THsw BOLAsw Dynamicsw WSSL THwss - - SLBW: Segment-based last bandwidth EWMA: Chunk-based exponentially weighted moving average SWMA: Chunk-based sliding window moving average WSSL: Will’s simple slide-load
  • 15.
    15 Performance Metrics • Livelatency – dash.js’ live latency function (not including the encoding time) • QoE models: – Yin QoE – ITU-T Rec. P.1203 QoE (Mode 0): bitrate, stall duration, frame rate, and resolution. • Bandwidth prediction accuracy – Root Mean Square Error (RMSE) to compute the differences between the measured and predicted bandwidth values ACM NOSSDAV 2019 Average Bitrate Bitrate Switches Stall Duration Startup Delay
  • 16.
    28.6% Improvement byACTE over Other Schemes ACM NOSSDAV 2019 16 Average Selected Bitrate 0 0.5 1 1.5 2 2.5 ACTE THsl THew THsw THwss BOLAsw Dynamic-sw AverageBitrate(Mbps)
  • 17.
    96.6% Prediction Accuracyby ACTE ACM NOSSDAV 2019 17 Average Measured Bandwidth 0 1 2 3 4 ACTE THsl THew THsw THwss BOLAsw Dynamic-sw Profiles-Avg AverageMeasuredBandwidth (Mbps)
  • 18.
    36.2% Improvement byACTE over Other Schemes ACM NOSSDAV 2019 18 Average Live Latency 0 1 2 3 4 5 6 ACTE THsl THew THsw THwss BOLAsw Dynamic-sw AverageLatency(s)
  • 19.
    49.3% Improvement byACTE over Other Schemes ACM NOSSDAV 2019 19 Average Normalized QoE 0 0.2 0.4 0.6 0.8 1 ACTE THsl THew THsw THwss BOLAsw Dynamic-sw AverageNormalizedQoE Yin Model P.1203
  • 20.
    ACM NOSSDAV 201920 Overall Results Avg. Buffer Occupancy Avg. # of Switches Avg. # of Stalls and Duration (s) Avg. Startup Delay (s) ACTE 2.1 to 3.0 (2.5) 17 3 & 0.76 0.71 THsl 3.6 to 5.0 (4.3) 0 2 & 0.86 1.46 THew 1.9 to 3.9 (2.9) 18 21 & 66 1.06 THsw 1.9 to 3.5 (2.8) 24 27 & 33 1.03 THwss 2.0 to 3.1 (2.5) 23 16 & 9 0.88 BOLAsw 1.6 to 3.0 (2.3) 20 58 & 119 1.66 Dynamicsw 1.6 to 3.0 (2.4) 30 53 & 68 0.92
  • 21.
    ACM NOSSDAV 201921 ACTE Outperforms the Existing ABR Schemes • Consecutive numbers represent the results – Summary of the average results. Percentage improvements of ACTE’s over the other scheme
  • 22.