Download to read offline
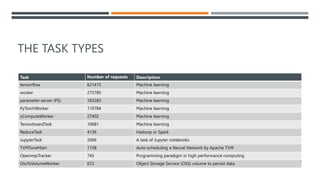
![MACHINE LEARNING BASED RESOURCE UTILIZATION
PREDICTION IN THE COMPUTING CONTINUUM
Christian Bauer, Narges Mehran, Dr. Radu Prodan and Dr. Dragi Kimovski
1
[1] - HTTPS://CAMAD2023.IEEE-CAMAD.ORG/](https://image.slidesharecdn.com/camad-presentation-231215124413-8cb96165/85/Machine-Learning-Based-Resource-Utilization-Prediction-in-the-Computing-Continuum-1-320.jpg)

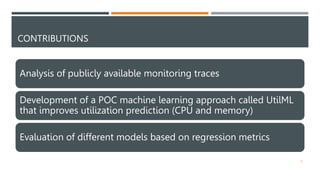
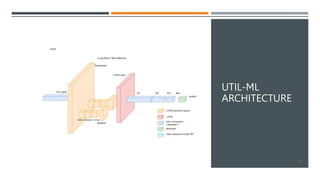
![COMPUTING
CONTINUUM
CONSISTS OF A COMBINATION OF CLOUD,
FOG AND EDGE LAYERS
8
[2] - HOSSEIN ASHTARI. EDGE COMPUTING VS. FOG COMPUTING: 10 KEY COMPARISONS.
HTTPS://WWW.SPICEWORKS.COM/TECH/CLOUD/ARTICLES/EDGE-VS-FOG-COMPUTING, 2022. [ONLINE; ACCESSED 01-NOV.-2023]](https://image.slidesharecdn.com/camad-presentation-231215124413-8cb96165/85/Machine-Learning-Based-Resource-Utilization-Prediction-in-the-Computing-Continuum-8-320.jpg)


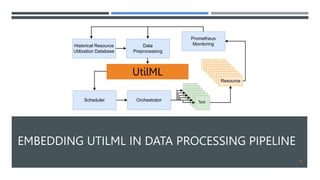

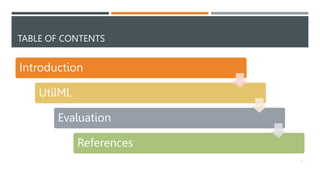
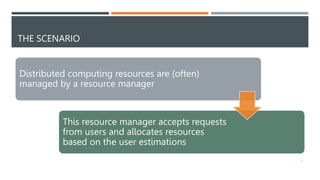
![EVALUATION RESULTS – CPU [%]
Actual CPU UtilML-LSTM Baseline-LSTM User
mean 516.073 454.205 392.630 632.809
std 881.832 579.213 705.771 496.245
min 1.023 2.395 3.030 5
25% 103.632 129.884 97.586 400
50% 208.749 249.392 118.014 600
75% 528.076 662.490 281.472 600
max 7790.371 5634.635 5793.996 6400
18](https://image.slidesharecdn.com/camad-presentation-231215124413-8cb96165/85/Machine-Learning-Based-Resource-Utilization-Prediction-in-the-Computing-Continuum-18-320.jpg)
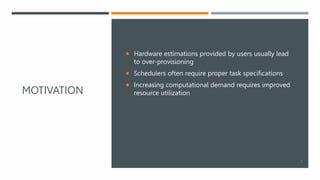
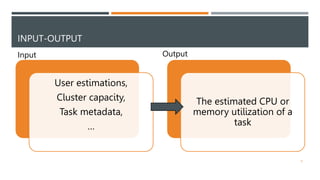
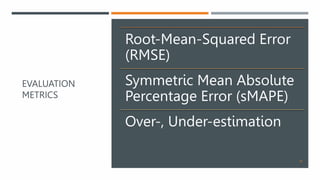
![EVALUATION RESULTS – MEMORY [GB]
Actual Memory UtilML-LSTM Baseline-LSTM User
mean 17.203 29.134 29.904 26.895
std 74.761 63.342 39.634 15.259
min 0.003 0.156 1.951 2
25% 2.160 4.537 22.178 14.648
50% 7.699 14.679 24.620 29.297
75% 15.976 27.924 24.620 29.297
max 1992.484 698.983 550.056 146.484
20](https://image.slidesharecdn.com/camad-presentation-231215124413-8cb96165/85/Machine-Learning-Based-Resource-Utilization-Prediction-in-the-Computing-Continuum-20-320.jpg)
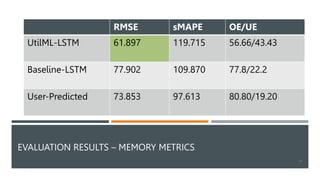
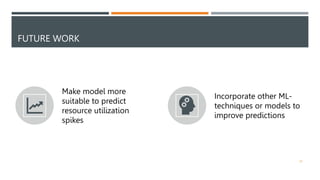


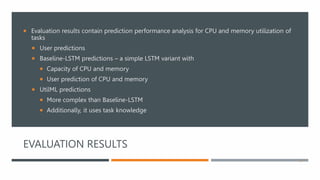
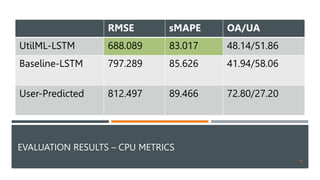
The document discusses a machine learning approach called UtilML aimed at improving resource utilization predictions in distributed computing environments. It highlights the issues of over-provisioning due to inaccurate hardware estimations and evaluates various models to enhance prediction accuracy for CPU and memory usage. The findings suggest that UtilML outperforms traditional user predictions and simpler LSTM models, with potential for further improvements to address resource utilization spikes.