Download to read offline
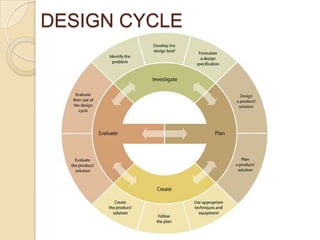
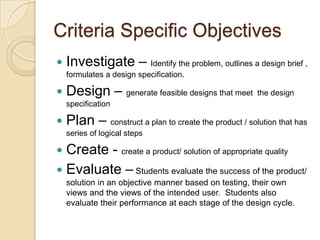
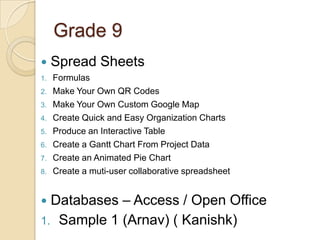
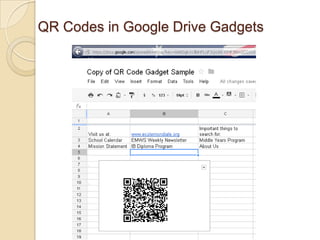
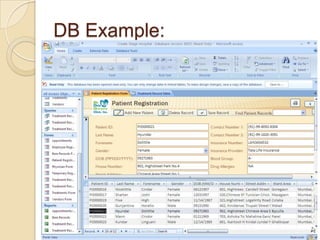

This document outlines the Grade 9 Information Technology curriculum for the 2012-2013 school year. It covers the design cycle criteria and specific objectives, which include investigating problems, designing feasible solutions, planning production steps, creating products, and evaluating outcomes. The curriculum also lists topics for spreadsheets like formulas, QR codes, maps, charts, and collaborative projects. It mentions databases and sample projects involving queries in Access and Open Office.


