1. From the Little Green Databook 2006, The World Bank
Cambodia
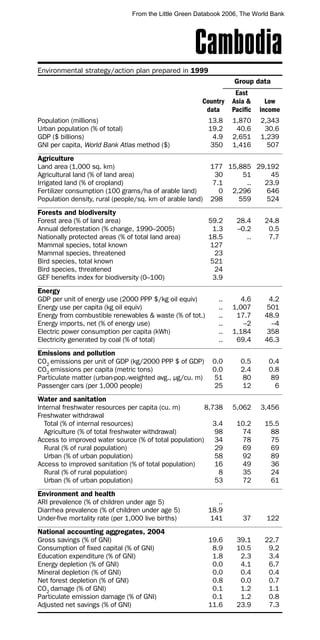
Environmental strategy/action plan prepared in 1999
Group data
East
Country Asia & Low
data Pacific income
Population (millions) 13.8 1,870 2,343
Urban population (% of total) 19.2 40.6 30.6
GDP ($ billions) 4.9 2,651 1,239
GNI per capita, World Bank Atlas method ($) 350 1,416 507
Agriculture
Land area (1,000 sq. km) 177 15,885 29,192
Agricultural land (% of land area) 30 51 45
Irrigated land (% of cropland) 7.1 .. 23.9
Fertilizer consumption (100 grams/ha of arable land) 0 2,296 646
Population density, rural (people/sq. km of arable land) 298 559 524
Forests and biodiversity
Forest area (% of land area) 59.2 28.4 24.8
Annual deforestation (% change, 1990–2005) 1.3 –0.2 0.5
Nationally protected areas (% of total land area) 18.5 .. 7.7
Mammal species, total known 127
Mammal species, threatened 23
Bird species, total known 521
Bird species, threatened 24
GEF benefits index for biodiversity (0–100) 3.9
Energy
GDP per unit of energy use (2000 PPP $/kg oil equiv) .. 4.6 4.2
Energy use per capita (kg oil equiv) .. 1,007 501
Energy from combustible renewables & waste (% of tot.) .. 17.7 48.9
Energy imports, net (% of energy use) .. –2 –4
Electric power consumption per capita (kWh) .. 1,184 358
Electricity generated by coal (% of total) .. 69.4 46.3
Emissions and pollution
CO2 emissions per unit of GDP (kg/2000 PPP $ of GDP) 0.0 0.5 0.4
CO2 emissions per capita (metric tons) 0.0 2.4 0.8
Particulate matter (urban-pop.-weighted avg., µg/cu. m) 51 80 89
Passenger cars (per 1,000 people) 25 12 6
Water and sanitation
Internal freshwater resources per capita (cu. m) 8,738 5,062 3,456
Freshwater withdrawal
Total (% of internal resources) 3.4 10.2 15.5
Agriculture (% of total freshwater withdrawal) 98 74 88
Access to improved water source (% of total population) 34 78 75
Rural (% of rural population) 29 69 69
Urban (% of urban population) 58 92 89
Access to improved sanitation (% of total population) 16 49 36
Rural (% of rural population) 8 35 24
Urban (% of urban population) 53 72 61
Environment and health
ARI prevalence (% of children under age 5) ..
Diarrhea prevalence (% of children under age 5) 18.9
Under-five mortality rate (per 1,000 live births) 141 37 122
National accounting aggregates, 2004
Gross savings (% of GNI) 19.6 39.1 22.7
Consumption of fixed capital (% of GNI) 8.9 10.5 9.2
Education expenditure (% of GNI) 1.8 2.3 3.4
Energy depletion (% of GNI) 0.0 4.1 6.7
Mineral depletion (% of GNI) 0.0 0.4 0.4
Net forest depletion (% of GNI) 0.8 0.0 0.7
CO2 damage (% of GNI) 0.1 1.2 1.1
Particulate emission damage (% of GNI) 0.1 1.2 0.8
Adjusted net savings (% of GNI) 11.6 23.9 7.3
55