SlideShare a Scribd company logo
1 of 17
Index
Individual Dataset
- Fig. 1a: Descriptives of four chosen variables
- Fig. 2a: HistogramshowingFeelings/Likeof David Cameron
- Fig. 3a: Histogramshowingtrust of David Cameron
- Fig. 4a: Crosstabulation of thoseidentifyingwith a social classby ratingof David Cameron as ‘untrustworthy’
- Fig. 5a: Crosstabulation of thoseidentifyingwith a social classby ratingof David Cameron as ‘trustworthy’
- Fig. 6a: Crosstabulation of thoseidentifyingwith a social classby ratingof David Cameron as ‘average’
- Fig. 7a: Measures of association between social classand ‘trust’of David Cameron
- Fig. 8a: Comparingthe means between male and female satisfaction with Conservativeeducation policy
- Fig. 9a: Independent Samples T-Test for maleversus female satisfaction with Conservativeeducation policy
- Fig. 10a:Comparing the means between maleand female satisfaction with Conservativehealth policy
- Fig. 11a:Independent Samples T-Test for male versus female satisfaction with Conservativehealth policy
- Fig. 12a:Comparing mean agreement that Conservatives managed the economy most poorly over time
- Fig. 13a:Paired Samples T-Test comparingmean agreement that Conservatives managed the economy most poorly over
time
- Fig. 14a:Levene’s Test of Homogeneity of Variances between interest in politicsand feelings/likeof David Cameron
- Fig. 15a:Tests of Normality of distribution between interest in politicsand feelings/likeof David Cameron
- Fig. 16a:ANOVA between interest in politics and feelings/likeof David Cameron
- Fig. 17a:MultipleComparisons between interest in politicsand feelings/likeof David Cameron
- Fig. 18a:Means plot comparinginterest in politicsand feelings/likeof David Cameron
- Fig. 19a:Contrast Coefficients for Labour, Liberal Democrat, and other identifiers
- Fig. 20a:Descriptives for mean feelings/likeof David Cameron between Labour, Liberal Democrat, and other identifiers
- Fig. 21a:Contrast Tests between Labour and Liberal Democrat identifier feelings/likeof David Cameron
- Fig. 22a:Model Summary for regression between Age and Feelings/Like of David Cameron
- Fig. 23a:ANOVA between Age and Feelings/Likeof David Cameron
- Fig. 24a:Coefficients between Age and Feelings/Like of David Cameron
- Fig. 25a:Scatterplot showingrelationship between Age and Feelings/Like of David Cameron
- Fig. 26a:Residuals Statisticsfor regression between Age and Feelings/Likeof David Cameron
- Fig. 27a:Scatterplot to test for homeoscedasticity usingstandardized predicted valueand standardized residual
- Fig. 28a:Scatterplot to test for homeoscedasticity usingstandardized residuals and feelings/likeof David Cameron
Aggregate Dataset
- Fig. 1b: Descriptives of four chosen variables
- Fig. 2b: Scatter plotshowingcorrelation between unemployment and % vote received
- Fig. 3b: Partial correlation between unemployment and % vote received
- Fig. 4b: Model Summary for regression between multiplepredictors and Conservative% vote share
- Fig. 5b: ANOVA between multiplepredictors and Conservative% vote share
- Fig. 6b: Coefficients of multiplepredictors and Conservativevote share
- Fig. 7b: Residuals Statisticsfor regression between multiplepredictors and Conservative% vote share
- Fig. 8b: Normal P-P Plotof Regression Standardized Residual
- Fig. 9b: Collinearity Diagnosticsfor regression between multiplepredictors and Conservative% vote share
- Fig. 10b: Scatterplot to test for homeoscedasticity usingstandardized predicted values and standardized residual
- Fig. 11b: Partial regression plotto test for heteroscedasticity
Individual Dataset
Fig. 1a: Descriptives of four chosen variables
Age Trust-David Cameron Feelings/Like David Cameron R Belong Social Class
N Valid 514 502 494 514
Missing 0 12 20 0
Mean 52.82 5.3287 5.0081 2.2529
Median 52.00 5.0000 5.0000 2.0000
Mode 52 5.00 5.00 3.00
Std. Deviation 17.872 2.55274 2.53973 .92519
Skewness .064 -.429 -.267 -.656
Std. Error of Skewness .108 .109 .110 .108
Kurtosis -.885 -.423 -.642 1.456
Std. Error of Kurtosis .215 .218 .219 .215
Fig. 5a: Crosstabulation of those identifying with a social class by rating of David Cameron as 'trustworthy'
Trustworthy
Total.00 1.00
Fig 4a: Crosstabulation of those identifying with a social class by rating of David Cameron as 'untrustworthy'
Untrustworthy
Total.00 1.00
R Belong
Social Class
Refused Count 1 0 1
Expected Count .7 .3 1.0
% within R Belong Social Class
100.0% 0.0% 100.0%
% within Untrustworthy 0.3% 0.0% 0.2%
Don't Know Count 5 1 6
Expected Count 4.1 1.9 6.0
% within R Belong Social Class 83.3% 16.7% 100.0%
% within Untrustworthy 1.4% 0.6% 1.2%
Yes middle class Count 76 29 105
Expected Count 71.9 33.1 105.0
% within R Belong Social Class 72.4% 27.6% 100.0%
% within Untrustworthy 21.6% 17.9% 20.4%
Yes working class Count 90 70 160
Expected Count 109.6 50.4 160.0
% within R Belong Social Class 56.3% 43.8% 100.0%
% within Untrustworthy 25.6% 43.2% 31.1%
No Count 174 58 232
Expected Count 158.9 73.1 232.0
% within R Belong Social Class 75.0% 25.0% 100.0%
% within Untrustworthy 49.4% 35.8% 45.1%
Lower middle
class
Count 4 1 5
Expected Count 3.4 1.6 5.0
% within R Belong Social Class 80.0% 20.0% 100.0%
% within Untrustworthy 1.1% 0.6% 1.0%
Other Count 2 3 5
Expected Count 3.4 1.6 5.0
% within R Belong Social Class 40.0% 60.0% 100.0%
% within Untrustworthy 0.6% 1.9% 1.0%
Total Count 352 162 514
Expected Count 352.0 162.0 514.0
% within R Belong Social Class 68.5% 31.5% 100.0%
% within Untrustworthy
100.0% 100.0% 100.0%
R Belong Social
Class
Refused Count 0 1 1
Expected Count .5 .5 1.0
% within R Belong Social Class
0.0% 100.0% 100.0%
% within Trustworthy 0.0% 0.4% 0.2%
Don't Know Count 4 2 6
Expected Count 3.1 2.9 6.0
% within R Belong Social Class
66.7% 33.3% 100.0%
% within Trustworthy 1.5% 0.8% 1.2%
Yes middle class Count 41 64 105
Expected Count 54.3 50.7 105.0
% within R Belong Social Class
39.0% 61.0% 100.0%
% within Trustworthy 15.4% 25.8% 20.4%
Yes working class Count 103 57 160
Expected Count 82.8 77.2 160.0
% within R Belong Social Class
64.4% 35.6% 100.0%
% within Trustworthy 38.7% 23.0% 31.1%
No Count 112 120 232
Expected Count 120.1 111.9 232.0
% within R Belong Social Class
48.3% 51.7% 100.0%
% within Trustworthy 42.1% 48.4% 45.1%
Lower middle class Count 2 3 5
Expected Count 2.6 2.4 5.0
% within R Belong Social Class
40.0% 60.0% 100.0%
% within Trustworthy 0.8% 1.2% 1.0%
Other Count 4 1 5
Expected Count 2.6 2.4 5.0
% within R Belong Social Class
80.0% 20.0% 100.0%
% within Trustworthy 1.5% 0.4% 1.0%
Total Count 266 248 514
Expected Count 266.0 248.0 514.0
% within R Belong Social Class 51.8% 48.2% 100.0%
% within Trustworthy 100.0% 100.0% 100.0%
Fig. 6a: Crosstabulation of those identifying with a social class by rating of David Cameron as 'average'
Average Total
.00 1.00
R Belong Social
Class
Refused Count 1 0 1
Expected Count .8 .2 1.0
% within R Belong Social Class 100.0% 0.0% 100.0%
% within Average 0.2% 0.0% 0.2%
Don't Know Count 4 2 6
Expected Count 4.9 1.1 6.0
% within R Belong Social Class 66.7% 33.3% 100.0%
% within Average 0.9% 2.2% 1.2%
Yes middle class Count 94 11 105
Expected Count 86.2 18.8 105.0
% within R Belong Social Class 89.5% 10.5% 100.0%
% within Average 22.3% 12.0% 20.4%
Yes working class Count 132 28 160
Expected Count 131.4 28.6 160.0
% within R Belong Social Class 82.5% 17.5% 100.0%
% within Average 31.3% 30.4% 31.1%
No Count 183 49 232
Expected Count 190.5 41.5 232.0
% within R Belong Social Class 78.9% 21.1% 100.0%
% within Average 43.4% 53.3% 45.1%
Lower middle class Count 4 1 5
Expected Count 4.1 .9 5.0
% within R Belong Social Class 80.0% 20.0% 100.0%
% within Average 0.9% 1.1% 1.0%
Other Count 4 1 5
Expected Count 4.1 .9 5.0
% within R Belong Social Class 80.0% 20.0% 100.0%
% within Average 0.9% 1.1% 1.0%
Total Count 422 92 514
Expected Count 422.0 92.0 514.0
% within R Belong Social Class 82.1% 17.9% 100.0%
% within Average 100.0% 100.0% 100.0%
Fig. 7a: Measures of association between social class and 'trust' of David Cameron
Value Approx. Sig.
Nominal byNominal Phi .404 .031
Cramer's V .165 .031
N of Valid Cases 502
Fig. 8a: Comparing the means between male and female satisfaction with Conservative
education policy
Gender N Mean Std. Deviation Std. Error Mean
% Satisfaction with
Conservative Education
Policy (Scores)
Male 238 19.6181 7.93351 .51425
Female
276 19.3321 8.13242 .48951
Fig. 9a: Independent Samples T-Test for male versus female satisfaction with Conservative education policy
Levene's Test
for Equality of
Variances t-test for Equality of Means
F Sig. t df
Sig. (2-
tailed)
Mean
Difference
Std. Error
Difference
95% Confidence
Interval of the
Difference
Lower Upper
% Satisfaction with
Conservative
Education Policy
(Scores)
Equal
variances
assumed
.029 .866 .402 512 .688 .28602 .71129 -1.11139 1.68342
Equal
variances not
assumed
.403 504.269 .687 .28602 .70999 -1.10888 1.68091
Fig. 10a: Comparing the means between male and female satisfaction with Conservative health
policy
Gender N Mean Std. Deviation Std. Error Mean
% Satisfaction with
Conservative Health Policy
(Scores)
Male 238 59.4315 4.45875 .28902
Female
276 59.1093 4.97404 .29940
Fig. 11a: Independent Samples T-Test for male versus female satisfaction with Conservative health policy
Levene's Test
for Equality of
Variances t-test for Equality of Means
F Sig. t df
Sig. (2-
tailed)
Mean
Difference
Std. Error
Difference
95% Confidence
Interval of the
Difference
Lower Upper
% Satisfaction with
Conservative Health
Policy (Scores)
Equal
variances
assumed
.718 .397 .768 512 .443 .32218 .41951 -.50199 1.14636
Equal
variances not
assumed
.774 511.221 .439 .32218 .41614 -.49537 1.13974
Fig. 12a: Comparing mean agreement that Conservatives managed the economy most poorly
over time
Mean N Std. Deviation Std. Error Mean
Pair 1 % Rating Conservative
Worse Job on the Economy
Time 1
29.966 514 19.9942 .8819
% Rating Conservative
Worse Job on the Economy
Time 2
19.428 514 14.4217 .6361
Fig. 13a: Paired Samples T-Test comparing mean agreement that Conservatives managed the economy most poorly over
time
Paired Differences
t df
Sig. (2-
tailed)Mean
Std.
Deviation
Std.
Error
Mean
95% Confidence
Interval of the
Difference
Lower Upper
Pair
1
% Rating Conservative Worse Job on the
EconomyTime 1 - % Rating Conservative
Worse Job on the Economy Time 2
10.5378 31.4509 1.3872 7.8125 13.2632 7.596 513 .000
Fig. 14a: Levene's Test of Homogeneity of
Variances between interest in politics and
feelings/like of David Cameron
Feelings/Like David Cameron
Levene Statistic df1 df2 Sig.
1.613 4 489 .170
Fig. 15a: Tests of Normality of distribution between interest in politics and feelings/like of David Cameron
Interestin Politics
Kolmogorov-Smirnova
Shapiro-Wilk
Statistic df Sig. Statistic df Sig.
Feelings/Like David Cameron A great deal .111 63 .051 .950 63 .012
Quite a lot .148 187 .000 .964 187 .000
Some .144 153 .000 .962 153 .000
Not very much .122 73 .009 .967 73 .050
None at all .310 18 .000 .725 18 .000
a. Lilliefors Significance Correction
Fig. 16a: ANOVA between interest in politics and feelings/like of David Cameron
Feelings/Like David Cameron
Sum of Squares df Mean Square F Sig.
Between Groups 221.321 4 55.330 9.145 .000
Within Groups 2958.647 489 6.050
Total 3179.968 493
Fig. 18a: Means plot comparing interest in politics and feelings/like of David Cameron
Fig. 17a: Multiple Comparisons between interest in politics and feelings/like of David Cameron
DependentVariable: Feelings/Like David Cameron
Scheffe
(I) Interestin Politics (J) Interest in Politics
Mean Difference
(I-J) Std. Error Sig.
95% Confidence Interval
Lower Bound Upper Bound
A great deal Quite a lot -.21178 .35832 .986 -1.3197 .8962
Some .52381 .36822 .731 -.6147 1.6623
Not very much .64405 .42299 .678 -.6638 1.9520
None at all 3.19048*
.65740 .000 1.1578 5.2232
Quite a lot A great deal .21178 .35832 .986 -.8962 1.3197
Some .73559 .26814 .112 -.0935 1.5647
Not very much .85583 .33947 .176 -.1938 1.9055
None at all 3.40226*
.60703 .000 1.5253 5.2792
Some A great deal -.52381 .36822 .731 -1.6623 .6147
Quite a lot -.73559 .26814 .112 -1.5647 .0935
Not very much .12024 .34990 .998 -.9616 1.2021
None at all 2.66667*
.61293 .001 .7715 4.5619
Not very much A great deal -.64405 .42299 .678 -1.9520 .6638
Quite a lot -.85583 .33947 .176 -1.9055 .1938
Some -.12024 .34990 .998 -1.2021 .9616
None at all 2.54642*
.64731 .004 .5449 4.5479
None at all A great deal -3.19048*
.65740 .000 -5.2232 -1.1578
Quite a lot -3.40226*
.60703 .000 -5.2792 -1.5253
Some -2.66667*
.61293 .001 -4.5619 -.7715
Not very much -2.54642*
.64731 .004 -4.5479 -.5449
*. The mean difference is significantatthe 0.05 level.
Fig. 19a: Contrast Coefficients for Labour,
Liberal Democrat, and other identifiers
Contrast
PartyID
-1.00 .00 1.00
1 -1 0 1
Fig. 20a: Descriptives for mean feelings/like of David Cameron between Labour, Liberal Democrat, and other identifiers
Feelings/Like David Cameron
N Mean Std. Deviation Std. Error
95% Confidence Interval for Mean
Minimum MaximumLower Bound Upper Bound
-1.00 155 3.5806 2.27884 .18304 3.2190 3.9422 .00 8.00
.00 268 5.8134 2.46068 .15031 5.5175 6.1094 .00 10.00
1.00 71 5.0845 1.97662 .23458 4.6166 5.5524 .00 9.00
Total 494 5.0081 2.53973 .11427 4.7836 5.2326 .00 10.00
Fig. 21a: Contrast Tests between Labour and Liberal Democrat identifier feelings/like of David Cameron
Fig. 22a: Model Summary for regression between Age and Feelings/Like of David Cameronb
Model R R Square Adjusted R Square Std. Error of the Estimate Durbin-Watson
1 .128a
.016 .014 2.52144 1.891
a. Predictors:(Constant),Age
b. DependentVariable:Feelings/Like David Cameron
Contrast
Value of
Contrast
Std.
Error t df
Sig. (2-
tailed)
Feelings/Like David
Cameron
Assume equal variances 1 1.5039 .33542 4.484 491 .000
Does notassume equal
variances
1
1.5039 .29754 5.054 155.060 .000
Fig. 23a: ANOVA between Age and Feelings/Like of David Camerona
Model Sum of Squares df Mean Square F Sig.
1 Regression 51.998 1 51.998 8.179 .004b
Residual 3127.970 492 6.358
Total 3179.968 493
a. DependentVariable:Feelings/Like David Cameron
b. Predictors:(Constant),Age
Fig. 24a: Coefficients between Age and Feelings/Like of David Camerona
Model
Unstandardized Coefficients Standardized Coefficients
t Sig.
CollinearityStatistics
B Std. Error Beta Tolerance VIF
1 (Constant) 4.049 .354 11.432 .000
Age .018 .006 .128 2.860 .004 1.000 1.000
a. DependentVariable:Feelings/Like David Cameron
Fig. 26a: Residuals Statistics for regression between Age and Feelings/Like of David Camerona
Minimum Maximum Mean Std. Deviation N
Predicted Value 4.3755 5.8100 5.0081 .32476 494
Std. Predicted Value -1.948 2.469 .000 1.000 494
Standard Error of Predicted Value .113 .302 .156 .039 494
Adjusted Predicted Value 4.3786 5.7926 5.0084 .32509 494
Residual -5.68288 5.38843 .00000 2.51888 494
Std. Residual -2.254 2.137 .000 .999 494
Stud. Residual -2.266 2.142 .000 1.001 494
Deleted Residual -5.74481 5.41577 -.00033 2.52905 494
Stud. Deleted Residual -2.276 2.150 .000 1.002 494
Mahal. Distance .000 6.097 .998 1.046 494
Cook's Distance .000 .028 .002 .003 494
Centered Leverage Value .000 .012 .002 .002 494
a. DependentVariable:Feelings/Like David Cameron
Fig. 25a: Scatterplot showing relationship between Age and Feelings/Like of David Cameron
Fig. 27a: Scatterplot to test for homeoscedasticity using standardized predicted value and standardized residual
Fig. 28a: Scatterplot to test for homeoscedasticity using standardized residuals and feelings/like of David Cameron
Aggregate Dataset
Fig. 4b: Model Summary for regression between multiple predictors and Conservative % vote shareb
Model R R Square Adjusted R Square Std. Error of the Estimate Durbin-Watson
1 .741a .549 .547 9.77973 1.575
a. Predictors:(Constant),% Higher Managers + % Professionals Class,% Home ownership,% Retired
b. DependentVariable:Conservative % 2015 election
Fig. 1b: Descriptives of four chosen variables
% Retired Conservative % 2015 election % Home ownership % Unemployment
N Valid 630 630 630 630
Missing 0 0 0 0
Mean 13.7987 35.7251 68.1473 3.3992
Median 13.9697 37.5180 70.5652 3.2112
Std. Deviation 2.78766 14.53243 11.07807 1.28230
Skewness -.026 -.277 -1.341 .854
Std. Error of Skewness .097 .097 .097 .097
Kurtosis .825 -1.022 2.256 .597
Std. Error of Kurtosis .194 .194 .194 .194
Fig. 5b: ANOVA between multiple predictors and Conservative % vote sharea
Model Sum of Squares df Mean Square F Sig.
1 Regression 72966.838 3 24322.279 254.303 .000b
Residual 59872.563 626 95.643
Total 132839.400 629
a. DependentVariable:Conservative % 2015 election
b. Predictors:(Constant),% Higher Managers + % Professionals Class,% Home ownership,% Retired
Fig. 3b: Partial correlation between unemployment and % vote received
Control Variables
%
Unemployment
Conservative %
2015 election
% Conservatives spent
on their campaign
during the general
election
-none-a
% Unemployment Correlation 1.000 -.717 -.294
Significance (2-tailed) . .000 .000
df 0 628 628
Conservative % 2015
election
Correlation -.717 1.000 .470
Significance (2-tailed) .000 . .000
df 628 0 628
% Conservatives spent
on their campaign during
the general election
Correlation -.294 .470 1.000
Significance (2-tailed) .000 .000 .
df 628 628 0
% Conservatives spent
on their campaign during
the general election
% Unemployment Correlation 1.000 -.686
Significance (2-tailed) . .000
df 0 627
Conservative % 2015
election
Correlation -.686 1.000
Significance (2-tailed) .000 .
df 627 0
a. Cells contain zero-order (Pearson) correlations.
Fig. 6b: Coefficients of multiple predictors and Conservative vote sharea
Model
Unstandardized
Coefficients
Standardized
Coefficients
t Sig.
Correlations
Collinearity
Statistics
B Std. Error Beta
Zero-
order Partial Part Tolerance VIF
1 (Constant)
-35.719 2.833
-
12.607
.000
% Retired 1.116 .203 .214 5.508 .000 .262 .215 .148 .477 2.098
% Home ownership .580 .047 .442 12.417 .000 .601 .445 .333 .567 1.764
% Higher Managers + %
Professionals Class
2.021 .128 .505 15.772 .000 .450 .533 .423 .702 1.426
a. DependentVariable:Conservative % 2015 election
Fig. 7b: Residuals Statistics for regression between multiple predictors and Conservative % vote sharea
Minimum Maximum Mean Std. Deviation N
Predicted Value 1.2168 60.2750 35.7251 10.77054 630
Std. Predicted Value -3.204 2.279 .000 1.000 630
Standard Error of Predicted Value .392 2.030 .735 .259 630
Adjusted Predicted Value 1.0070 60.2704 35.7233 10.78120 630
Residual -41.06156 23.20147 .00000 9.75638 630
Std. Residual -4.199 2.372 .000 .998 630
Stud. Residual -4.215 2.375 .000 1.001 630
Deleted Residual -41.37898 23.25517 .00178 9.81701 630
Stud. Deleted Residual -4.273 2.384 .000 1.003 630
Mahal. Distance .011 26.108 2.995 3.425 630
Cook's Distance .000 .041 .002 .003 630
Centered Leverage Value .000 .042 .005 .005 630
a. DependentVariable:Conservative % 2015 election
Fig. 9b: Collinearity Diagnostics for regression between multiple predictors and Conservative % vote sharea
Model Dimension Eigenvalue
Condition
Index
Variance Proportions
(Constant)
%
Retired
% Home
ownership
% Higher Managers + % Professionals
Class
1 1 3.820 1.000 .00 .00 .00 .01
2 .157 4.934 .00 .03 .00 .54
3 .014 16.706 .99 .16 .15 .15
4 .010 19.931 .00 .81 .84 .31
a. DependentVariable:Conservative % 2015 election
QRM Index

More Related Content

Similar to QRM Index

Determination and Analysis of Sample size
Determination and Analysis of Sample sizeDetermination and Analysis of Sample size
Determination and Analysis of Sample sizeSudipto Krishna Dutta
 
Question 1 of 201.0 PointsA sample of 20 observations has a st.docx
Question 1 of 201.0 PointsA sample of 20 observations has a st.docxQuestion 1 of 201.0 PointsA sample of 20 observations has a st.docx
Question 1 of 201.0 PointsA sample of 20 observations has a st.docxhildredzr1di
 
Introduction to Statistics Part A - Outputs 1. A sa.docx
Introduction to Statistics Part A - Outputs 1. A sa.docxIntroduction to Statistics Part A - Outputs 1. A sa.docx
Introduction to Statistics Part A - Outputs 1. A sa.docxmariuse18nolet
 
Predictive Analysis ( Sample Report)
Predictive  Analysis ( Sample  Report)Predictive  Analysis ( Sample  Report)
Predictive Analysis ( Sample Report)John deLoach
 
Descriptive Statistics
Descriptive StatisticsDescriptive Statistics
Descriptive StatisticsKate Organ
 
A study of graduate & post graduate students regarding their career plans
A study of graduate & post graduate students regarding their career plansA study of graduate & post graduate students regarding their career plans
A study of graduate & post graduate students regarding their career plansVaibhav Vaidya
 
Exam 1 (covers Chapters 1-7)Math 140Show all work! Na.docx
Exam 1 (covers Chapters 1-7)Math 140Show all work!     Na.docxExam 1 (covers Chapters 1-7)Math 140Show all work!     Na.docx
Exam 1 (covers Chapters 1-7)Math 140Show all work! Na.docxSANSKAR20
 
STAT225 Introduction to Statistics in the Behavioral Sciences.docx
STAT225 Introduction to Statistics in the Behavioral Sciences.docxSTAT225 Introduction to Statistics in the Behavioral Sciences.docx
STAT225 Introduction to Statistics in the Behavioral Sciences.docxdessiechisomjj4
 
The analysis of the data has been done using excel statistical sof.docx
The analysis of the data has been done using excel statistical sof.docxThe analysis of the data has been done using excel statistical sof.docx
The analysis of the data has been done using excel statistical sof.docxmattinsonjanel
 
PRSA Connecticut, January 2015
PRSA Connecticut, January 2015PRSA Connecticut, January 2015
PRSA Connecticut, January 2015Paine Publishing
 
Looking for patterns in the data
Looking for patterns in the dataLooking for patterns in the data
Looking for patterns in the dataRay Poynter
 
Math Final Project Statistics
Math Final Project StatisticsMath Final Project Statistics
Math Final Project Statistics_NabilaHanim
 
Math final project
Math final projectMath final project
Math final projectlimziahuei
 
Magellan Strategies 2012 Internal Survey Research Summary Memorandum 120612
Magellan Strategies 2012 Internal Survey Research Summary Memorandum 120612Magellan Strategies 2012 Internal Survey Research Summary Memorandum 120612
Magellan Strategies 2012 Internal Survey Research Summary Memorandum 120612Magellan Strategies
 
CDC Data Analytics Project
CDC Data Analytics ProjectCDC Data Analytics Project
CDC Data Analytics Projectkim_andrew
 

Similar to QRM Index (20)

Determination and Analysis of Sample size
Determination and Analysis of Sample sizeDetermination and Analysis of Sample size
Determination and Analysis of Sample size
 
Question 1 of 201.0 PointsA sample of 20 observations has a st.docx
Question 1 of 201.0 PointsA sample of 20 observations has a st.docxQuestion 1 of 201.0 PointsA sample of 20 observations has a st.docx
Question 1 of 201.0 PointsA sample of 20 observations has a st.docx
 
Introduction to Statistics Part A - Outputs 1. A sa.docx
Introduction to Statistics Part A - Outputs 1. A sa.docxIntroduction to Statistics Part A - Outputs 1. A sa.docx
Introduction to Statistics Part A - Outputs 1. A sa.docx
 
Predictive Analysis ( Sample Report)
Predictive  Analysis ( Sample  Report)Predictive  Analysis ( Sample  Report)
Predictive Analysis ( Sample Report)
 
QRM Assignment
QRM AssignmentQRM Assignment
QRM Assignment
 
Descriptive Statistics
Descriptive StatisticsDescriptive Statistics
Descriptive Statistics
 
A study of graduate & post graduate students regarding their career plans
A study of graduate & post graduate students regarding their career plansA study of graduate & post graduate students regarding their career plans
A study of graduate & post graduate students regarding their career plans
 
Exam 1 (covers Chapters 1-7)Math 140Show all work! Na.docx
Exam 1 (covers Chapters 1-7)Math 140Show all work!     Na.docxExam 1 (covers Chapters 1-7)Math 140Show all work!     Na.docx
Exam 1 (covers Chapters 1-7)Math 140Show all work! Na.docx
 
Final report mkt
Final report mktFinal report mkt
Final report mkt
 
STAT225 Introduction to Statistics in the Behavioral Sciences.docx
STAT225 Introduction to Statistics in the Behavioral Sciences.docxSTAT225 Introduction to Statistics in the Behavioral Sciences.docx
STAT225 Introduction to Statistics in the Behavioral Sciences.docx
 
The analysis of the data has been done using excel statistical sof.docx
The analysis of the data has been done using excel statistical sof.docxThe analysis of the data has been done using excel statistical sof.docx
The analysis of the data has been done using excel statistical sof.docx
 
PRSA Connecticut, January 2015
PRSA Connecticut, January 2015PRSA Connecticut, January 2015
PRSA Connecticut, January 2015
 
Looking for patterns in the data
Looking for patterns in the dataLooking for patterns in the data
Looking for patterns in the data
 
Math Final Project Statistics
Math Final Project StatisticsMath Final Project Statistics
Math Final Project Statistics
 
Math final project
Math final projectMath final project
Math final project
 
Magellan Strategies 2012 Internal Survey Research Summary Memorandum 120612
Magellan Strategies 2012 Internal Survey Research Summary Memorandum 120612Magellan Strategies 2012 Internal Survey Research Summary Memorandum 120612
Magellan Strategies 2012 Internal Survey Research Summary Memorandum 120612
 
CDC Data Analytics Project
CDC Data Analytics ProjectCDC Data Analytics Project
CDC Data Analytics Project
 
Dfid new
Dfid newDfid new
Dfid new
 
Cross Tabs
Cross TabsCross Tabs
Cross Tabs
 
Big Data Research Methods – Contemporary Analysis
Big Data Research Methods – Contemporary AnalysisBig Data Research Methods – Contemporary Analysis
Big Data Research Methods – Contemporary Analysis
 

QRM Index

  • 1. Index Individual Dataset - Fig. 1a: Descriptives of four chosen variables - Fig. 2a: HistogramshowingFeelings/Likeof David Cameron - Fig. 3a: Histogramshowingtrust of David Cameron - Fig. 4a: Crosstabulation of thoseidentifyingwith a social classby ratingof David Cameron as ‘untrustworthy’ - Fig. 5a: Crosstabulation of thoseidentifyingwith a social classby ratingof David Cameron as ‘trustworthy’ - Fig. 6a: Crosstabulation of thoseidentifyingwith a social classby ratingof David Cameron as ‘average’ - Fig. 7a: Measures of association between social classand ‘trust’of David Cameron - Fig. 8a: Comparingthe means between male and female satisfaction with Conservativeeducation policy - Fig. 9a: Independent Samples T-Test for maleversus female satisfaction with Conservativeeducation policy - Fig. 10a:Comparing the means between maleand female satisfaction with Conservativehealth policy - Fig. 11a:Independent Samples T-Test for male versus female satisfaction with Conservativehealth policy - Fig. 12a:Comparing mean agreement that Conservatives managed the economy most poorly over time - Fig. 13a:Paired Samples T-Test comparingmean agreement that Conservatives managed the economy most poorly over time - Fig. 14a:Levene’s Test of Homogeneity of Variances between interest in politicsand feelings/likeof David Cameron - Fig. 15a:Tests of Normality of distribution between interest in politicsand feelings/likeof David Cameron - Fig. 16a:ANOVA between interest in politics and feelings/likeof David Cameron - Fig. 17a:MultipleComparisons between interest in politicsand feelings/likeof David Cameron - Fig. 18a:Means plot comparinginterest in politicsand feelings/likeof David Cameron - Fig. 19a:Contrast Coefficients for Labour, Liberal Democrat, and other identifiers - Fig. 20a:Descriptives for mean feelings/likeof David Cameron between Labour, Liberal Democrat, and other identifiers - Fig. 21a:Contrast Tests between Labour and Liberal Democrat identifier feelings/likeof David Cameron - Fig. 22a:Model Summary for regression between Age and Feelings/Like of David Cameron - Fig. 23a:ANOVA between Age and Feelings/Likeof David Cameron - Fig. 24a:Coefficients between Age and Feelings/Like of David Cameron - Fig. 25a:Scatterplot showingrelationship between Age and Feelings/Like of David Cameron - Fig. 26a:Residuals Statisticsfor regression between Age and Feelings/Likeof David Cameron - Fig. 27a:Scatterplot to test for homeoscedasticity usingstandardized predicted valueand standardized residual - Fig. 28a:Scatterplot to test for homeoscedasticity usingstandardized residuals and feelings/likeof David Cameron Aggregate Dataset - Fig. 1b: Descriptives of four chosen variables - Fig. 2b: Scatter plotshowingcorrelation between unemployment and % vote received - Fig. 3b: Partial correlation between unemployment and % vote received - Fig. 4b: Model Summary for regression between multiplepredictors and Conservative% vote share - Fig. 5b: ANOVA between multiplepredictors and Conservative% vote share - Fig. 6b: Coefficients of multiplepredictors and Conservativevote share - Fig. 7b: Residuals Statisticsfor regression between multiplepredictors and Conservative% vote share - Fig. 8b: Normal P-P Plotof Regression Standardized Residual - Fig. 9b: Collinearity Diagnosticsfor regression between multiplepredictors and Conservative% vote share - Fig. 10b: Scatterplot to test for homeoscedasticity usingstandardized predicted values and standardized residual - Fig. 11b: Partial regression plotto test for heteroscedasticity
  • 2. Individual Dataset Fig. 1a: Descriptives of four chosen variables Age Trust-David Cameron Feelings/Like David Cameron R Belong Social Class N Valid 514 502 494 514 Missing 0 12 20 0 Mean 52.82 5.3287 5.0081 2.2529 Median 52.00 5.0000 5.0000 2.0000 Mode 52 5.00 5.00 3.00 Std. Deviation 17.872 2.55274 2.53973 .92519 Skewness .064 -.429 -.267 -.656 Std. Error of Skewness .108 .109 .110 .108 Kurtosis -.885 -.423 -.642 1.456 Std. Error of Kurtosis .215 .218 .219 .215
  • 3. Fig. 5a: Crosstabulation of those identifying with a social class by rating of David Cameron as 'trustworthy' Trustworthy Total.00 1.00 Fig 4a: Crosstabulation of those identifying with a social class by rating of David Cameron as 'untrustworthy' Untrustworthy Total.00 1.00 R Belong Social Class Refused Count 1 0 1 Expected Count .7 .3 1.0 % within R Belong Social Class 100.0% 0.0% 100.0% % within Untrustworthy 0.3% 0.0% 0.2% Don't Know Count 5 1 6 Expected Count 4.1 1.9 6.0 % within R Belong Social Class 83.3% 16.7% 100.0% % within Untrustworthy 1.4% 0.6% 1.2% Yes middle class Count 76 29 105 Expected Count 71.9 33.1 105.0 % within R Belong Social Class 72.4% 27.6% 100.0% % within Untrustworthy 21.6% 17.9% 20.4% Yes working class Count 90 70 160 Expected Count 109.6 50.4 160.0 % within R Belong Social Class 56.3% 43.8% 100.0% % within Untrustworthy 25.6% 43.2% 31.1% No Count 174 58 232 Expected Count 158.9 73.1 232.0 % within R Belong Social Class 75.0% 25.0% 100.0% % within Untrustworthy 49.4% 35.8% 45.1% Lower middle class Count 4 1 5 Expected Count 3.4 1.6 5.0 % within R Belong Social Class 80.0% 20.0% 100.0% % within Untrustworthy 1.1% 0.6% 1.0% Other Count 2 3 5 Expected Count 3.4 1.6 5.0 % within R Belong Social Class 40.0% 60.0% 100.0% % within Untrustworthy 0.6% 1.9% 1.0% Total Count 352 162 514 Expected Count 352.0 162.0 514.0 % within R Belong Social Class 68.5% 31.5% 100.0% % within Untrustworthy 100.0% 100.0% 100.0%
  • 4. R Belong Social Class Refused Count 0 1 1 Expected Count .5 .5 1.0 % within R Belong Social Class 0.0% 100.0% 100.0% % within Trustworthy 0.0% 0.4% 0.2% Don't Know Count 4 2 6 Expected Count 3.1 2.9 6.0 % within R Belong Social Class 66.7% 33.3% 100.0% % within Trustworthy 1.5% 0.8% 1.2% Yes middle class Count 41 64 105 Expected Count 54.3 50.7 105.0 % within R Belong Social Class 39.0% 61.0% 100.0% % within Trustworthy 15.4% 25.8% 20.4% Yes working class Count 103 57 160 Expected Count 82.8 77.2 160.0 % within R Belong Social Class 64.4% 35.6% 100.0% % within Trustworthy 38.7% 23.0% 31.1% No Count 112 120 232 Expected Count 120.1 111.9 232.0 % within R Belong Social Class 48.3% 51.7% 100.0% % within Trustworthy 42.1% 48.4% 45.1% Lower middle class Count 2 3 5 Expected Count 2.6 2.4 5.0 % within R Belong Social Class 40.0% 60.0% 100.0% % within Trustworthy 0.8% 1.2% 1.0% Other Count 4 1 5 Expected Count 2.6 2.4 5.0 % within R Belong Social Class 80.0% 20.0% 100.0% % within Trustworthy 1.5% 0.4% 1.0% Total Count 266 248 514 Expected Count 266.0 248.0 514.0 % within R Belong Social Class 51.8% 48.2% 100.0% % within Trustworthy 100.0% 100.0% 100.0% Fig. 6a: Crosstabulation of those identifying with a social class by rating of David Cameron as 'average' Average Total
  • 5. .00 1.00 R Belong Social Class Refused Count 1 0 1 Expected Count .8 .2 1.0 % within R Belong Social Class 100.0% 0.0% 100.0% % within Average 0.2% 0.0% 0.2% Don't Know Count 4 2 6 Expected Count 4.9 1.1 6.0 % within R Belong Social Class 66.7% 33.3% 100.0% % within Average 0.9% 2.2% 1.2% Yes middle class Count 94 11 105 Expected Count 86.2 18.8 105.0 % within R Belong Social Class 89.5% 10.5% 100.0% % within Average 22.3% 12.0% 20.4% Yes working class Count 132 28 160 Expected Count 131.4 28.6 160.0 % within R Belong Social Class 82.5% 17.5% 100.0% % within Average 31.3% 30.4% 31.1% No Count 183 49 232 Expected Count 190.5 41.5 232.0 % within R Belong Social Class 78.9% 21.1% 100.0% % within Average 43.4% 53.3% 45.1% Lower middle class Count 4 1 5 Expected Count 4.1 .9 5.0 % within R Belong Social Class 80.0% 20.0% 100.0% % within Average 0.9% 1.1% 1.0% Other Count 4 1 5 Expected Count 4.1 .9 5.0 % within R Belong Social Class 80.0% 20.0% 100.0% % within Average 0.9% 1.1% 1.0% Total Count 422 92 514 Expected Count 422.0 92.0 514.0 % within R Belong Social Class 82.1% 17.9% 100.0% % within Average 100.0% 100.0% 100.0%
  • 6. Fig. 7a: Measures of association between social class and 'trust' of David Cameron Value Approx. Sig. Nominal byNominal Phi .404 .031 Cramer's V .165 .031 N of Valid Cases 502 Fig. 8a: Comparing the means between male and female satisfaction with Conservative education policy Gender N Mean Std. Deviation Std. Error Mean % Satisfaction with Conservative Education Policy (Scores) Male 238 19.6181 7.93351 .51425 Female 276 19.3321 8.13242 .48951 Fig. 9a: Independent Samples T-Test for male versus female satisfaction with Conservative education policy Levene's Test for Equality of Variances t-test for Equality of Means F Sig. t df Sig. (2- tailed) Mean Difference Std. Error Difference 95% Confidence Interval of the Difference Lower Upper % Satisfaction with Conservative Education Policy (Scores) Equal variances assumed .029 .866 .402 512 .688 .28602 .71129 -1.11139 1.68342 Equal variances not assumed .403 504.269 .687 .28602 .70999 -1.10888 1.68091
  • 7. Fig. 10a: Comparing the means between male and female satisfaction with Conservative health policy Gender N Mean Std. Deviation Std. Error Mean % Satisfaction with Conservative Health Policy (Scores) Male 238 59.4315 4.45875 .28902 Female 276 59.1093 4.97404 .29940 Fig. 11a: Independent Samples T-Test for male versus female satisfaction with Conservative health policy Levene's Test for Equality of Variances t-test for Equality of Means F Sig. t df Sig. (2- tailed) Mean Difference Std. Error Difference 95% Confidence Interval of the Difference Lower Upper % Satisfaction with Conservative Health Policy (Scores) Equal variances assumed .718 .397 .768 512 .443 .32218 .41951 -.50199 1.14636 Equal variances not assumed .774 511.221 .439 .32218 .41614 -.49537 1.13974 Fig. 12a: Comparing mean agreement that Conservatives managed the economy most poorly over time Mean N Std. Deviation Std. Error Mean Pair 1 % Rating Conservative Worse Job on the Economy Time 1 29.966 514 19.9942 .8819 % Rating Conservative Worse Job on the Economy Time 2 19.428 514 14.4217 .6361
  • 8. Fig. 13a: Paired Samples T-Test comparing mean agreement that Conservatives managed the economy most poorly over time Paired Differences t df Sig. (2- tailed)Mean Std. Deviation Std. Error Mean 95% Confidence Interval of the Difference Lower Upper Pair 1 % Rating Conservative Worse Job on the EconomyTime 1 - % Rating Conservative Worse Job on the Economy Time 2 10.5378 31.4509 1.3872 7.8125 13.2632 7.596 513 .000 Fig. 14a: Levene's Test of Homogeneity of Variances between interest in politics and feelings/like of David Cameron Feelings/Like David Cameron Levene Statistic df1 df2 Sig. 1.613 4 489 .170 Fig. 15a: Tests of Normality of distribution between interest in politics and feelings/like of David Cameron Interestin Politics Kolmogorov-Smirnova Shapiro-Wilk Statistic df Sig. Statistic df Sig. Feelings/Like David Cameron A great deal .111 63 .051 .950 63 .012 Quite a lot .148 187 .000 .964 187 .000 Some .144 153 .000 .962 153 .000 Not very much .122 73 .009 .967 73 .050 None at all .310 18 .000 .725 18 .000 a. Lilliefors Significance Correction Fig. 16a: ANOVA between interest in politics and feelings/like of David Cameron Feelings/Like David Cameron Sum of Squares df Mean Square F Sig. Between Groups 221.321 4 55.330 9.145 .000 Within Groups 2958.647 489 6.050 Total 3179.968 493
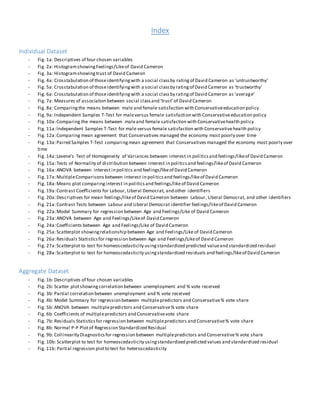
  • 9. Fig. 18a: Means plot comparing interest in politics and feelings/like of David Cameron Fig. 17a: Multiple Comparisons between interest in politics and feelings/like of David Cameron DependentVariable: Feelings/Like David Cameron Scheffe (I) Interestin Politics (J) Interest in Politics Mean Difference (I-J) Std. Error Sig. 95% Confidence Interval Lower Bound Upper Bound A great deal Quite a lot -.21178 .35832 .986 -1.3197 .8962 Some .52381 .36822 .731 -.6147 1.6623 Not very much .64405 .42299 .678 -.6638 1.9520 None at all 3.19048* .65740 .000 1.1578 5.2232 Quite a lot A great deal .21178 .35832 .986 -.8962 1.3197 Some .73559 .26814 .112 -.0935 1.5647 Not very much .85583 .33947 .176 -.1938 1.9055 None at all 3.40226* .60703 .000 1.5253 5.2792 Some A great deal -.52381 .36822 .731 -1.6623 .6147 Quite a lot -.73559 .26814 .112 -1.5647 .0935 Not very much .12024 .34990 .998 -.9616 1.2021 None at all 2.66667* .61293 .001 .7715 4.5619 Not very much A great deal -.64405 .42299 .678 -1.9520 .6638 Quite a lot -.85583 .33947 .176 -1.9055 .1938 Some -.12024 .34990 .998 -1.2021 .9616 None at all 2.54642* .64731 .004 .5449 4.5479 None at all A great deal -3.19048* .65740 .000 -5.2232 -1.1578 Quite a lot -3.40226* .60703 .000 -5.2792 -1.5253 Some -2.66667* .61293 .001 -4.5619 -.7715 Not very much -2.54642* .64731 .004 -4.5479 -.5449 *. The mean difference is significantatthe 0.05 level.
  • 10. Fig. 19a: Contrast Coefficients for Labour, Liberal Democrat, and other identifiers Contrast PartyID -1.00 .00 1.00 1 -1 0 1 Fig. 20a: Descriptives for mean feelings/like of David Cameron between Labour, Liberal Democrat, and other identifiers Feelings/Like David Cameron N Mean Std. Deviation Std. Error 95% Confidence Interval for Mean Minimum MaximumLower Bound Upper Bound -1.00 155 3.5806 2.27884 .18304 3.2190 3.9422 .00 8.00 .00 268 5.8134 2.46068 .15031 5.5175 6.1094 .00 10.00 1.00 71 5.0845 1.97662 .23458 4.6166 5.5524 .00 9.00 Total 494 5.0081 2.53973 .11427 4.7836 5.2326 .00 10.00 Fig. 21a: Contrast Tests between Labour and Liberal Democrat identifier feelings/like of David Cameron
  • 11. Fig. 22a: Model Summary for regression between Age and Feelings/Like of David Cameronb Model R R Square Adjusted R Square Std. Error of the Estimate Durbin-Watson 1 .128a .016 .014 2.52144 1.891 a. Predictors:(Constant),Age b. DependentVariable:Feelings/Like David Cameron Contrast Value of Contrast Std. Error t df Sig. (2- tailed) Feelings/Like David Cameron Assume equal variances 1 1.5039 .33542 4.484 491 .000 Does notassume equal variances 1 1.5039 .29754 5.054 155.060 .000 Fig. 23a: ANOVA between Age and Feelings/Like of David Camerona Model Sum of Squares df Mean Square F Sig. 1 Regression 51.998 1 51.998 8.179 .004b Residual 3127.970 492 6.358 Total 3179.968 493 a. DependentVariable:Feelings/Like David Cameron b. Predictors:(Constant),Age Fig. 24a: Coefficients between Age and Feelings/Like of David Camerona Model Unstandardized Coefficients Standardized Coefficients t Sig. CollinearityStatistics B Std. Error Beta Tolerance VIF 1 (Constant) 4.049 .354 11.432 .000 Age .018 .006 .128 2.860 .004 1.000 1.000 a. DependentVariable:Feelings/Like David Cameron
  • 12. Fig. 26a: Residuals Statistics for regression between Age and Feelings/Like of David Camerona Minimum Maximum Mean Std. Deviation N Predicted Value 4.3755 5.8100 5.0081 .32476 494 Std. Predicted Value -1.948 2.469 .000 1.000 494 Standard Error of Predicted Value .113 .302 .156 .039 494 Adjusted Predicted Value 4.3786 5.7926 5.0084 .32509 494 Residual -5.68288 5.38843 .00000 2.51888 494 Std. Residual -2.254 2.137 .000 .999 494 Stud. Residual -2.266 2.142 .000 1.001 494 Deleted Residual -5.74481 5.41577 -.00033 2.52905 494 Stud. Deleted Residual -2.276 2.150 .000 1.002 494 Mahal. Distance .000 6.097 .998 1.046 494 Cook's Distance .000 .028 .002 .003 494 Centered Leverage Value .000 .012 .002 .002 494 a. DependentVariable:Feelings/Like David Cameron Fig. 25a: Scatterplot showing relationship between Age and Feelings/Like of David Cameron
  • 13. Fig. 27a: Scatterplot to test for homeoscedasticity using standardized predicted value and standardized residual Fig. 28a: Scatterplot to test for homeoscedasticity using standardized residuals and feelings/like of David Cameron
  • 14. Aggregate Dataset Fig. 4b: Model Summary for regression between multiple predictors and Conservative % vote shareb Model R R Square Adjusted R Square Std. Error of the Estimate Durbin-Watson 1 .741a .549 .547 9.77973 1.575 a. Predictors:(Constant),% Higher Managers + % Professionals Class,% Home ownership,% Retired b. DependentVariable:Conservative % 2015 election Fig. 1b: Descriptives of four chosen variables % Retired Conservative % 2015 election % Home ownership % Unemployment N Valid 630 630 630 630 Missing 0 0 0 0 Mean 13.7987 35.7251 68.1473 3.3992 Median 13.9697 37.5180 70.5652 3.2112 Std. Deviation 2.78766 14.53243 11.07807 1.28230 Skewness -.026 -.277 -1.341 .854 Std. Error of Skewness .097 .097 .097 .097 Kurtosis .825 -1.022 2.256 .597 Std. Error of Kurtosis .194 .194 .194 .194 Fig. 5b: ANOVA between multiple predictors and Conservative % vote sharea Model Sum of Squares df Mean Square F Sig. 1 Regression 72966.838 3 24322.279 254.303 .000b Residual 59872.563 626 95.643 Total 132839.400 629 a. DependentVariable:Conservative % 2015 election b. Predictors:(Constant),% Higher Managers + % Professionals Class,% Home ownership,% Retired
  • 15. Fig. 3b: Partial correlation between unemployment and % vote received Control Variables % Unemployment Conservative % 2015 election % Conservatives spent on their campaign during the general election -none-a % Unemployment Correlation 1.000 -.717 -.294 Significance (2-tailed) . .000 .000 df 0 628 628 Conservative % 2015 election Correlation -.717 1.000 .470 Significance (2-tailed) .000 . .000 df 628 0 628 % Conservatives spent on their campaign during the general election Correlation -.294 .470 1.000 Significance (2-tailed) .000 .000 . df 628 628 0 % Conservatives spent on their campaign during the general election % Unemployment Correlation 1.000 -.686 Significance (2-tailed) . .000 df 0 627 Conservative % 2015 election Correlation -.686 1.000 Significance (2-tailed) .000 . df 627 0 a. Cells contain zero-order (Pearson) correlations. Fig. 6b: Coefficients of multiple predictors and Conservative vote sharea Model Unstandardized Coefficients Standardized Coefficients t Sig. Correlations Collinearity Statistics B Std. Error Beta Zero- order Partial Part Tolerance VIF 1 (Constant) -35.719 2.833 - 12.607 .000 % Retired 1.116 .203 .214 5.508 .000 .262 .215 .148 .477 2.098 % Home ownership .580 .047 .442 12.417 .000 .601 .445 .333 .567 1.764 % Higher Managers + % Professionals Class 2.021 .128 .505 15.772 .000 .450 .533 .423 .702 1.426 a. DependentVariable:Conservative % 2015 election
  • 16. Fig. 7b: Residuals Statistics for regression between multiple predictors and Conservative % vote sharea Minimum Maximum Mean Std. Deviation N Predicted Value 1.2168 60.2750 35.7251 10.77054 630 Std. Predicted Value -3.204 2.279 .000 1.000 630 Standard Error of Predicted Value .392 2.030 .735 .259 630 Adjusted Predicted Value 1.0070 60.2704 35.7233 10.78120 630 Residual -41.06156 23.20147 .00000 9.75638 630 Std. Residual -4.199 2.372 .000 .998 630 Stud. Residual -4.215 2.375 .000 1.001 630 Deleted Residual -41.37898 23.25517 .00178 9.81701 630 Stud. Deleted Residual -4.273 2.384 .000 1.003 630 Mahal. Distance .011 26.108 2.995 3.425 630 Cook's Distance .000 .041 .002 .003 630 Centered Leverage Value .000 .042 .005 .005 630 a. DependentVariable:Conservative % 2015 election Fig. 9b: Collinearity Diagnostics for regression between multiple predictors and Conservative % vote sharea Model Dimension Eigenvalue Condition Index Variance Proportions (Constant) % Retired % Home ownership % Higher Managers + % Professionals Class 1 1 3.820 1.000 .00 .00 .00 .01 2 .157 4.934 .00 .03 .00 .54 3 .014 16.706 .99 .16 .15 .15 4 .010 19.931 .00 .81 .84 .31 a. DependentVariable:Conservative % 2015 election