
Downloaded 14 times

The document outlines an implementation plan for assessing and mitigating the carbon footprint of dairy cattle in China, targeting the reduction of greenhouse gas emissions from the dairy sector. It details objectives and activities that include developing a greenhouse gas footprint model, creating a comprehensive database, and identifying viable mitigation measures. Key elements involve defining system boundaries, allocation methods, and calculation approaches necessary for accurately assessing carbon emissions across the dairy production chain.
Introduction to CCAFS's project on assessing and mitigating carbon footprint in Chinese dairy.
Overview of the presentation structure including background, objectives, activities, and implementation plan.
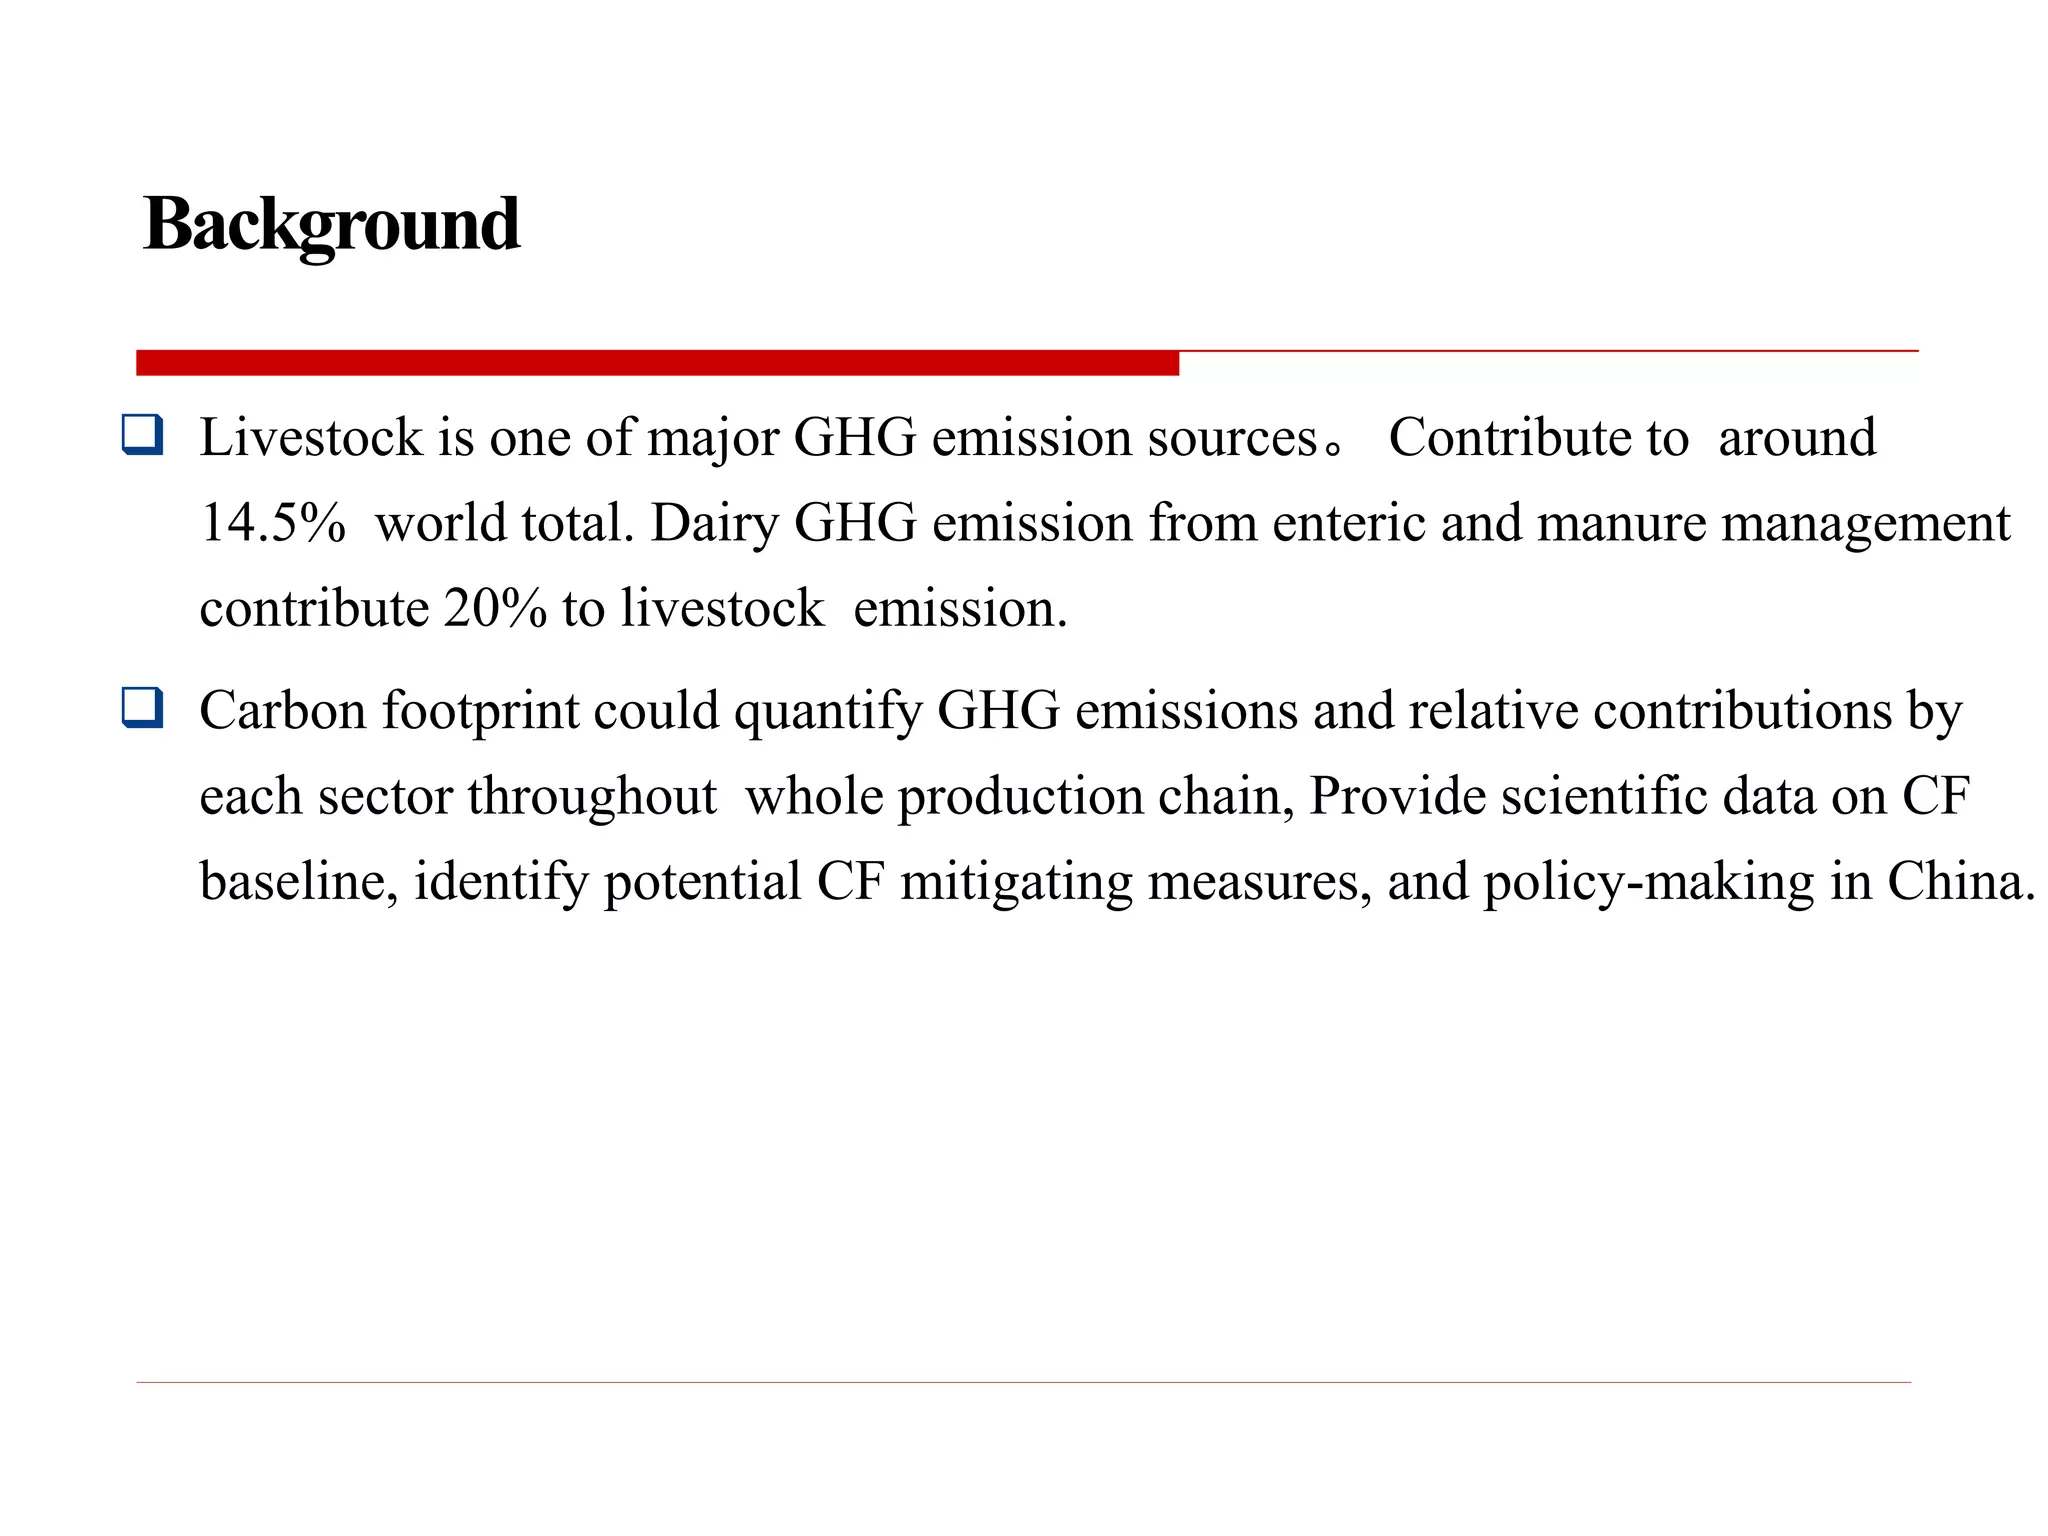
Discussion on livestock's GHG emissions contributing to 14.5% globally and the dairy sector's specific impact.
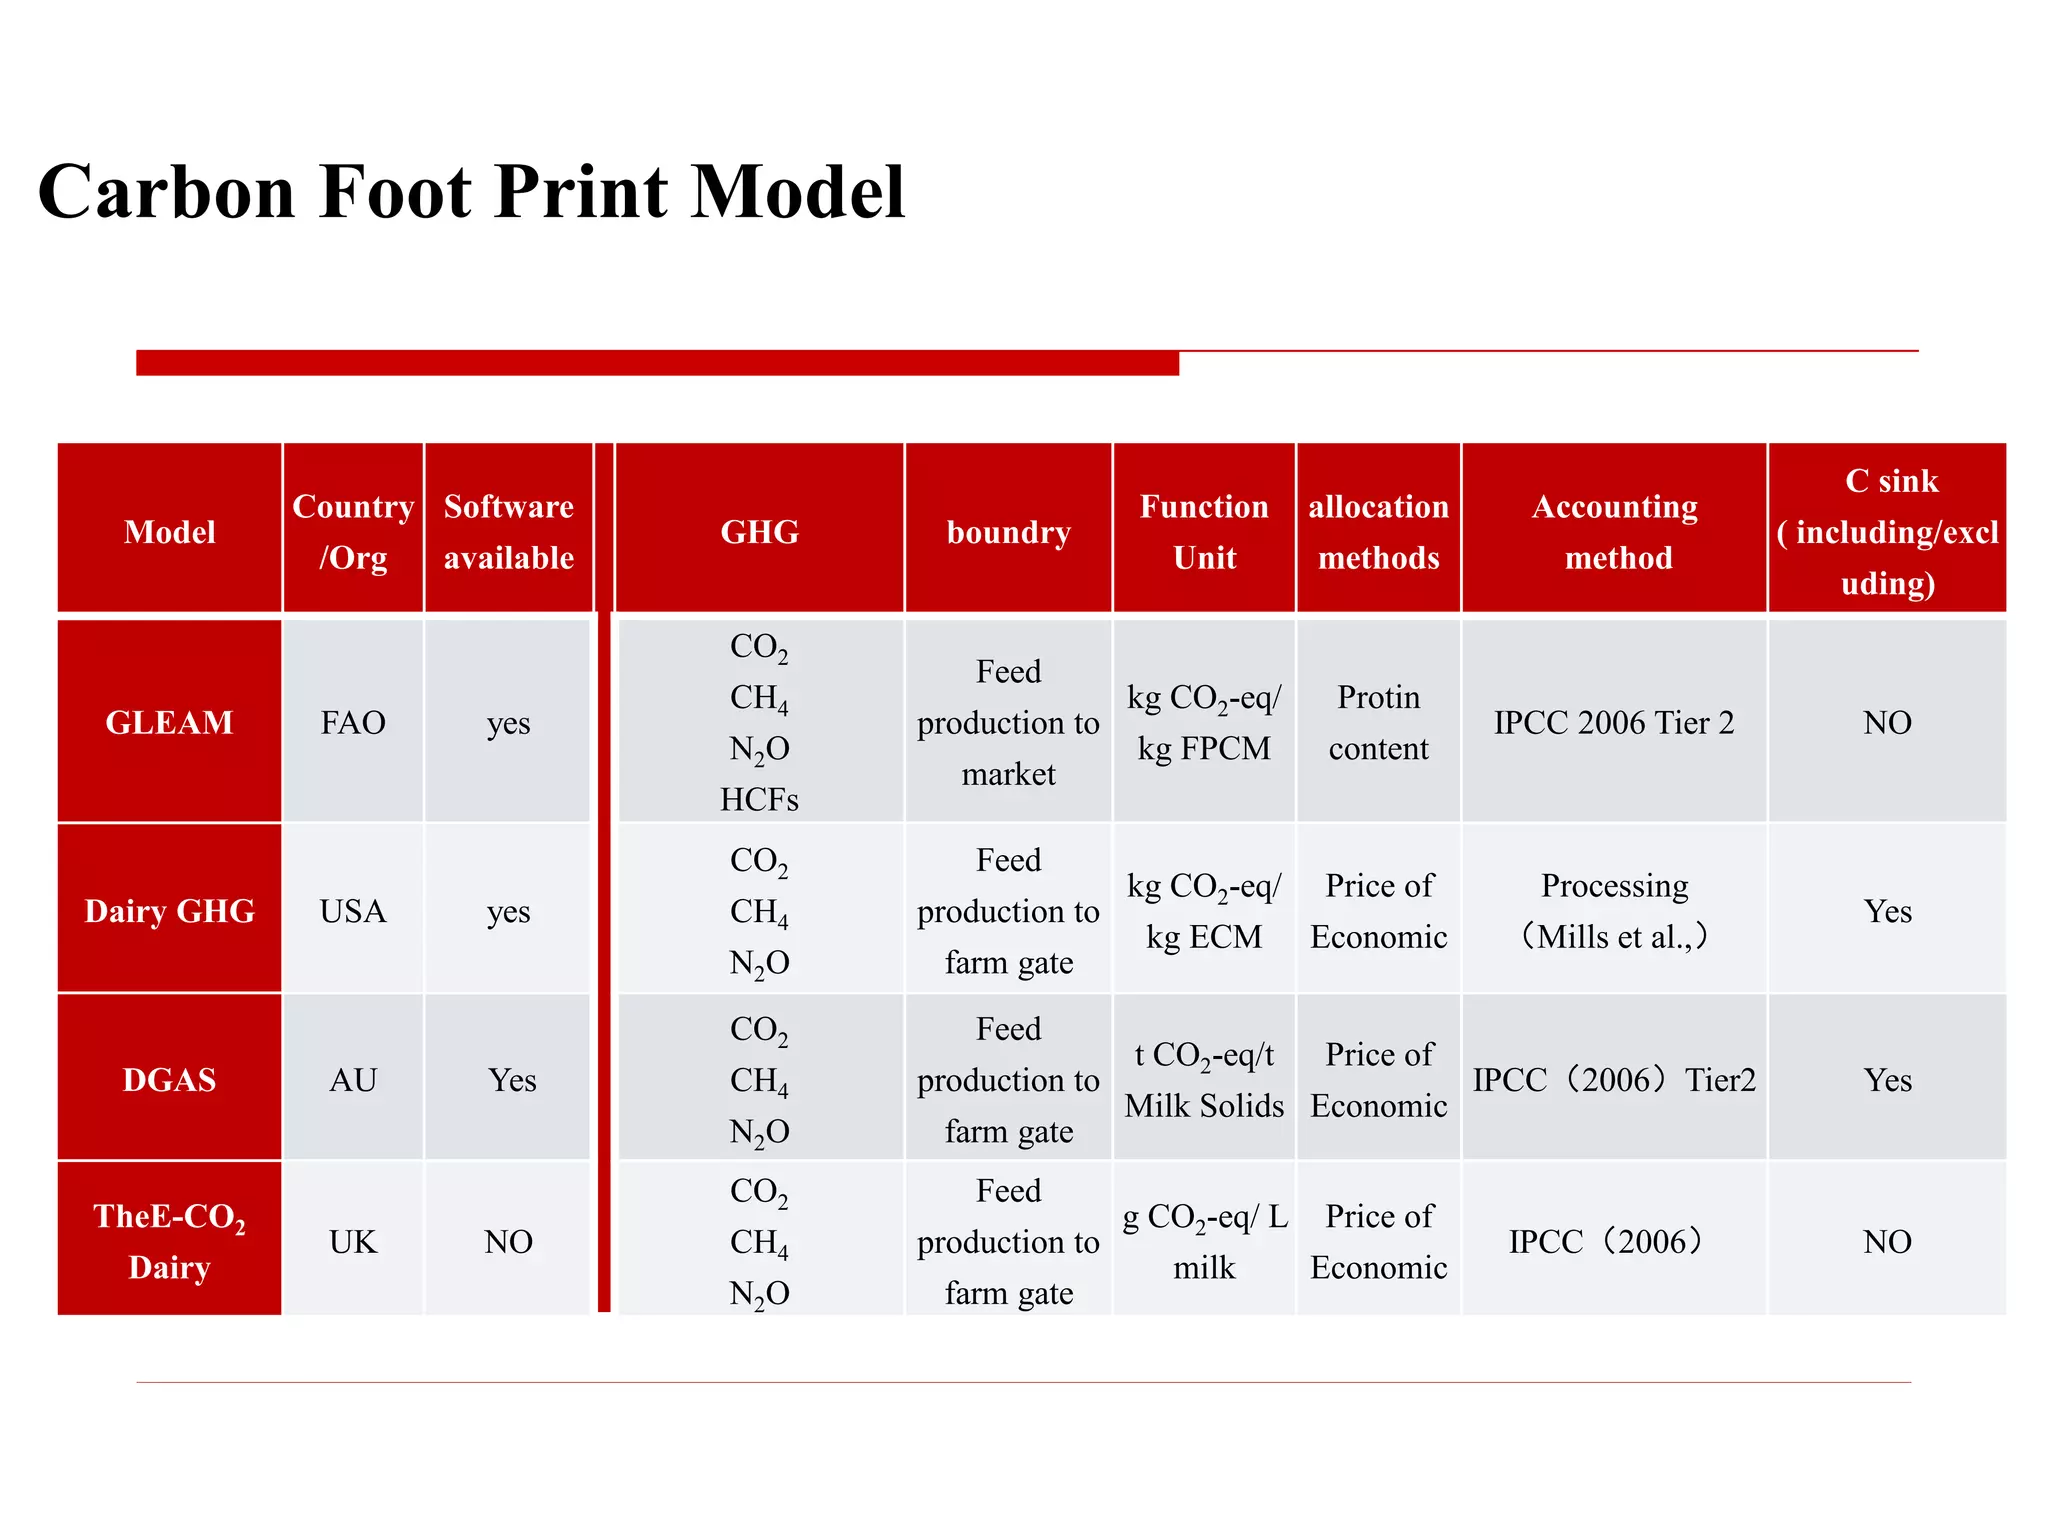
Summary of various models and software for assessing GHG boundaries and accounting methods in dairy.
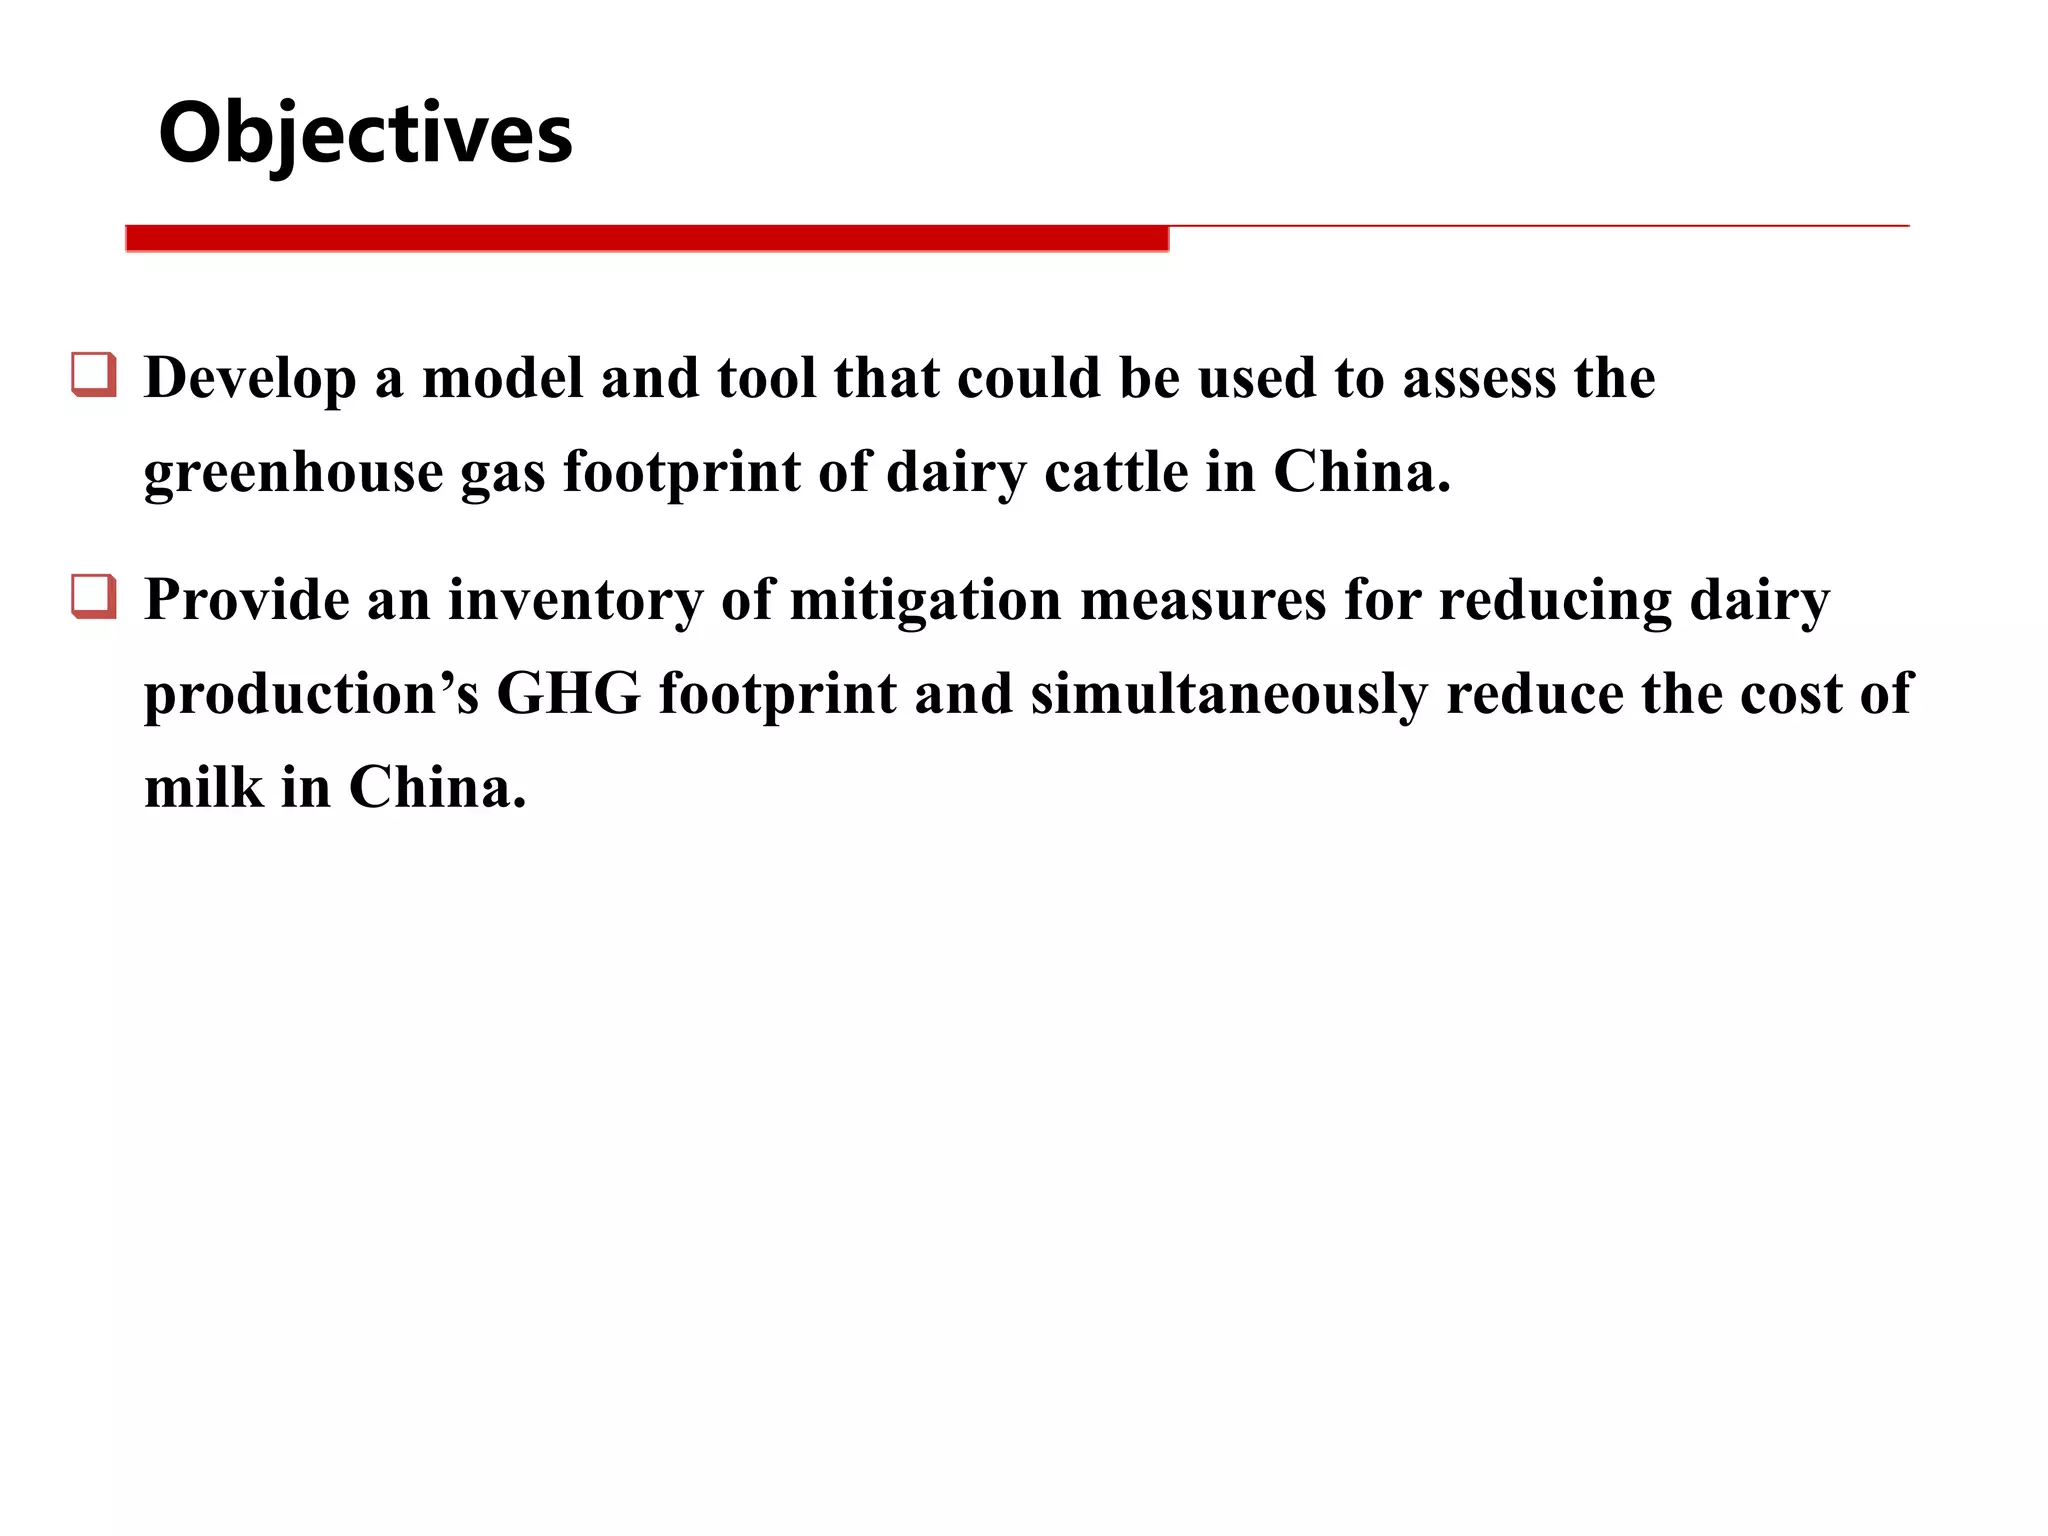
Goals include developing a GHG assessment model and inventory of mitigation measures for the dairy sector.
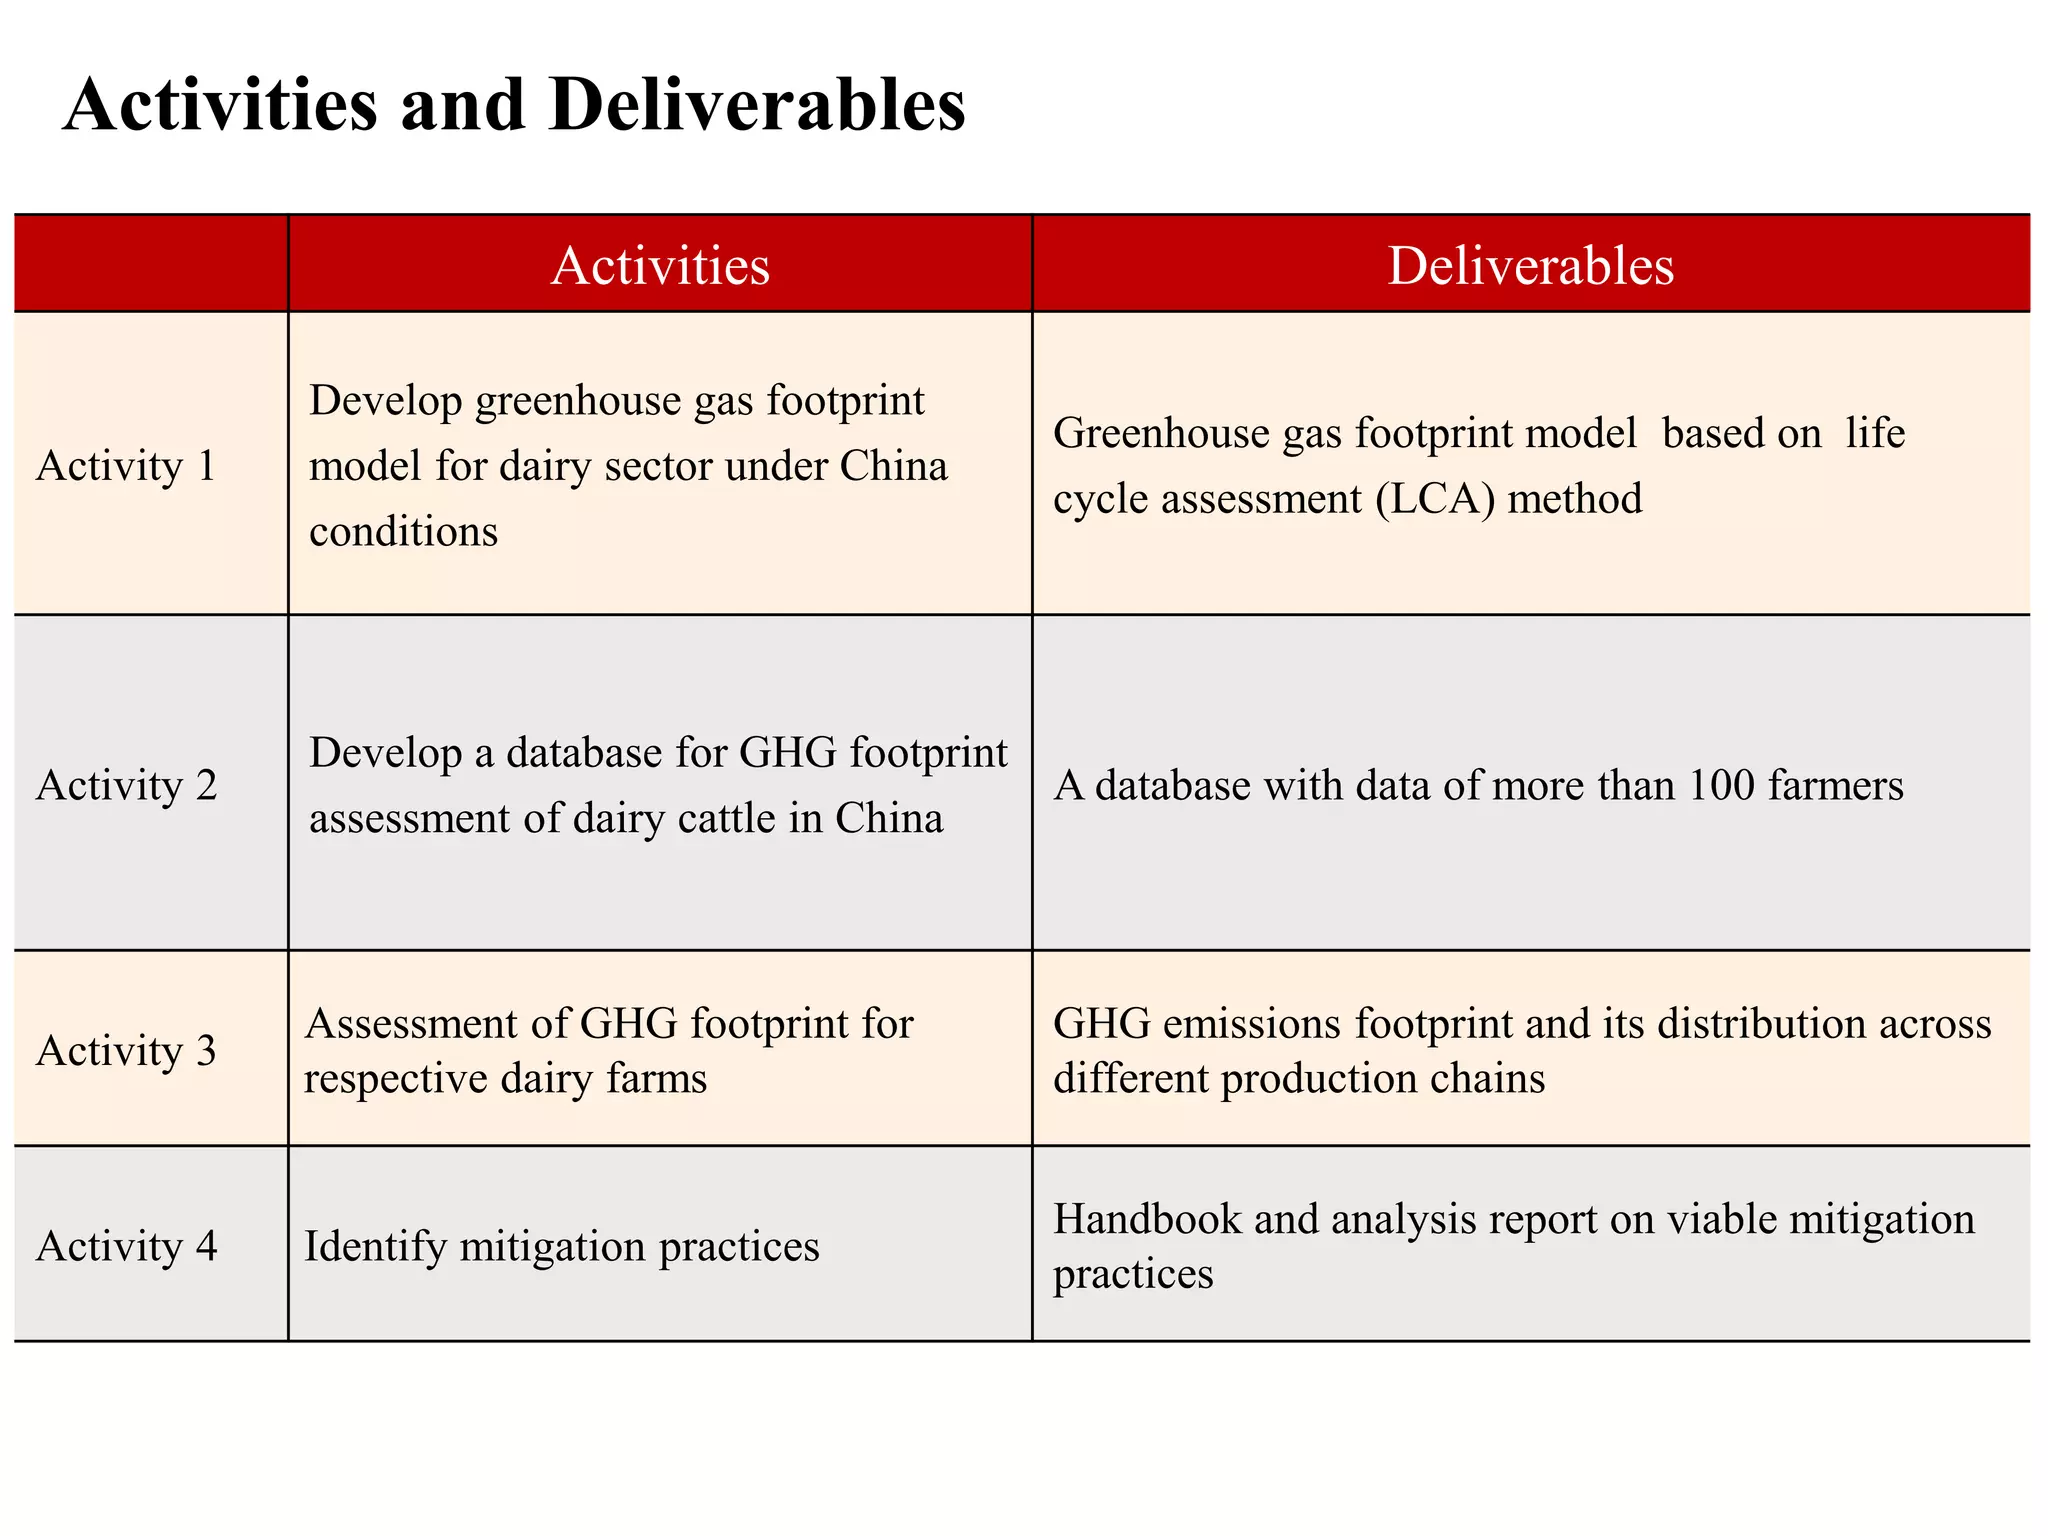
Detailed activities aimed at creating a GHG footprint model and associated database for dairy farms.
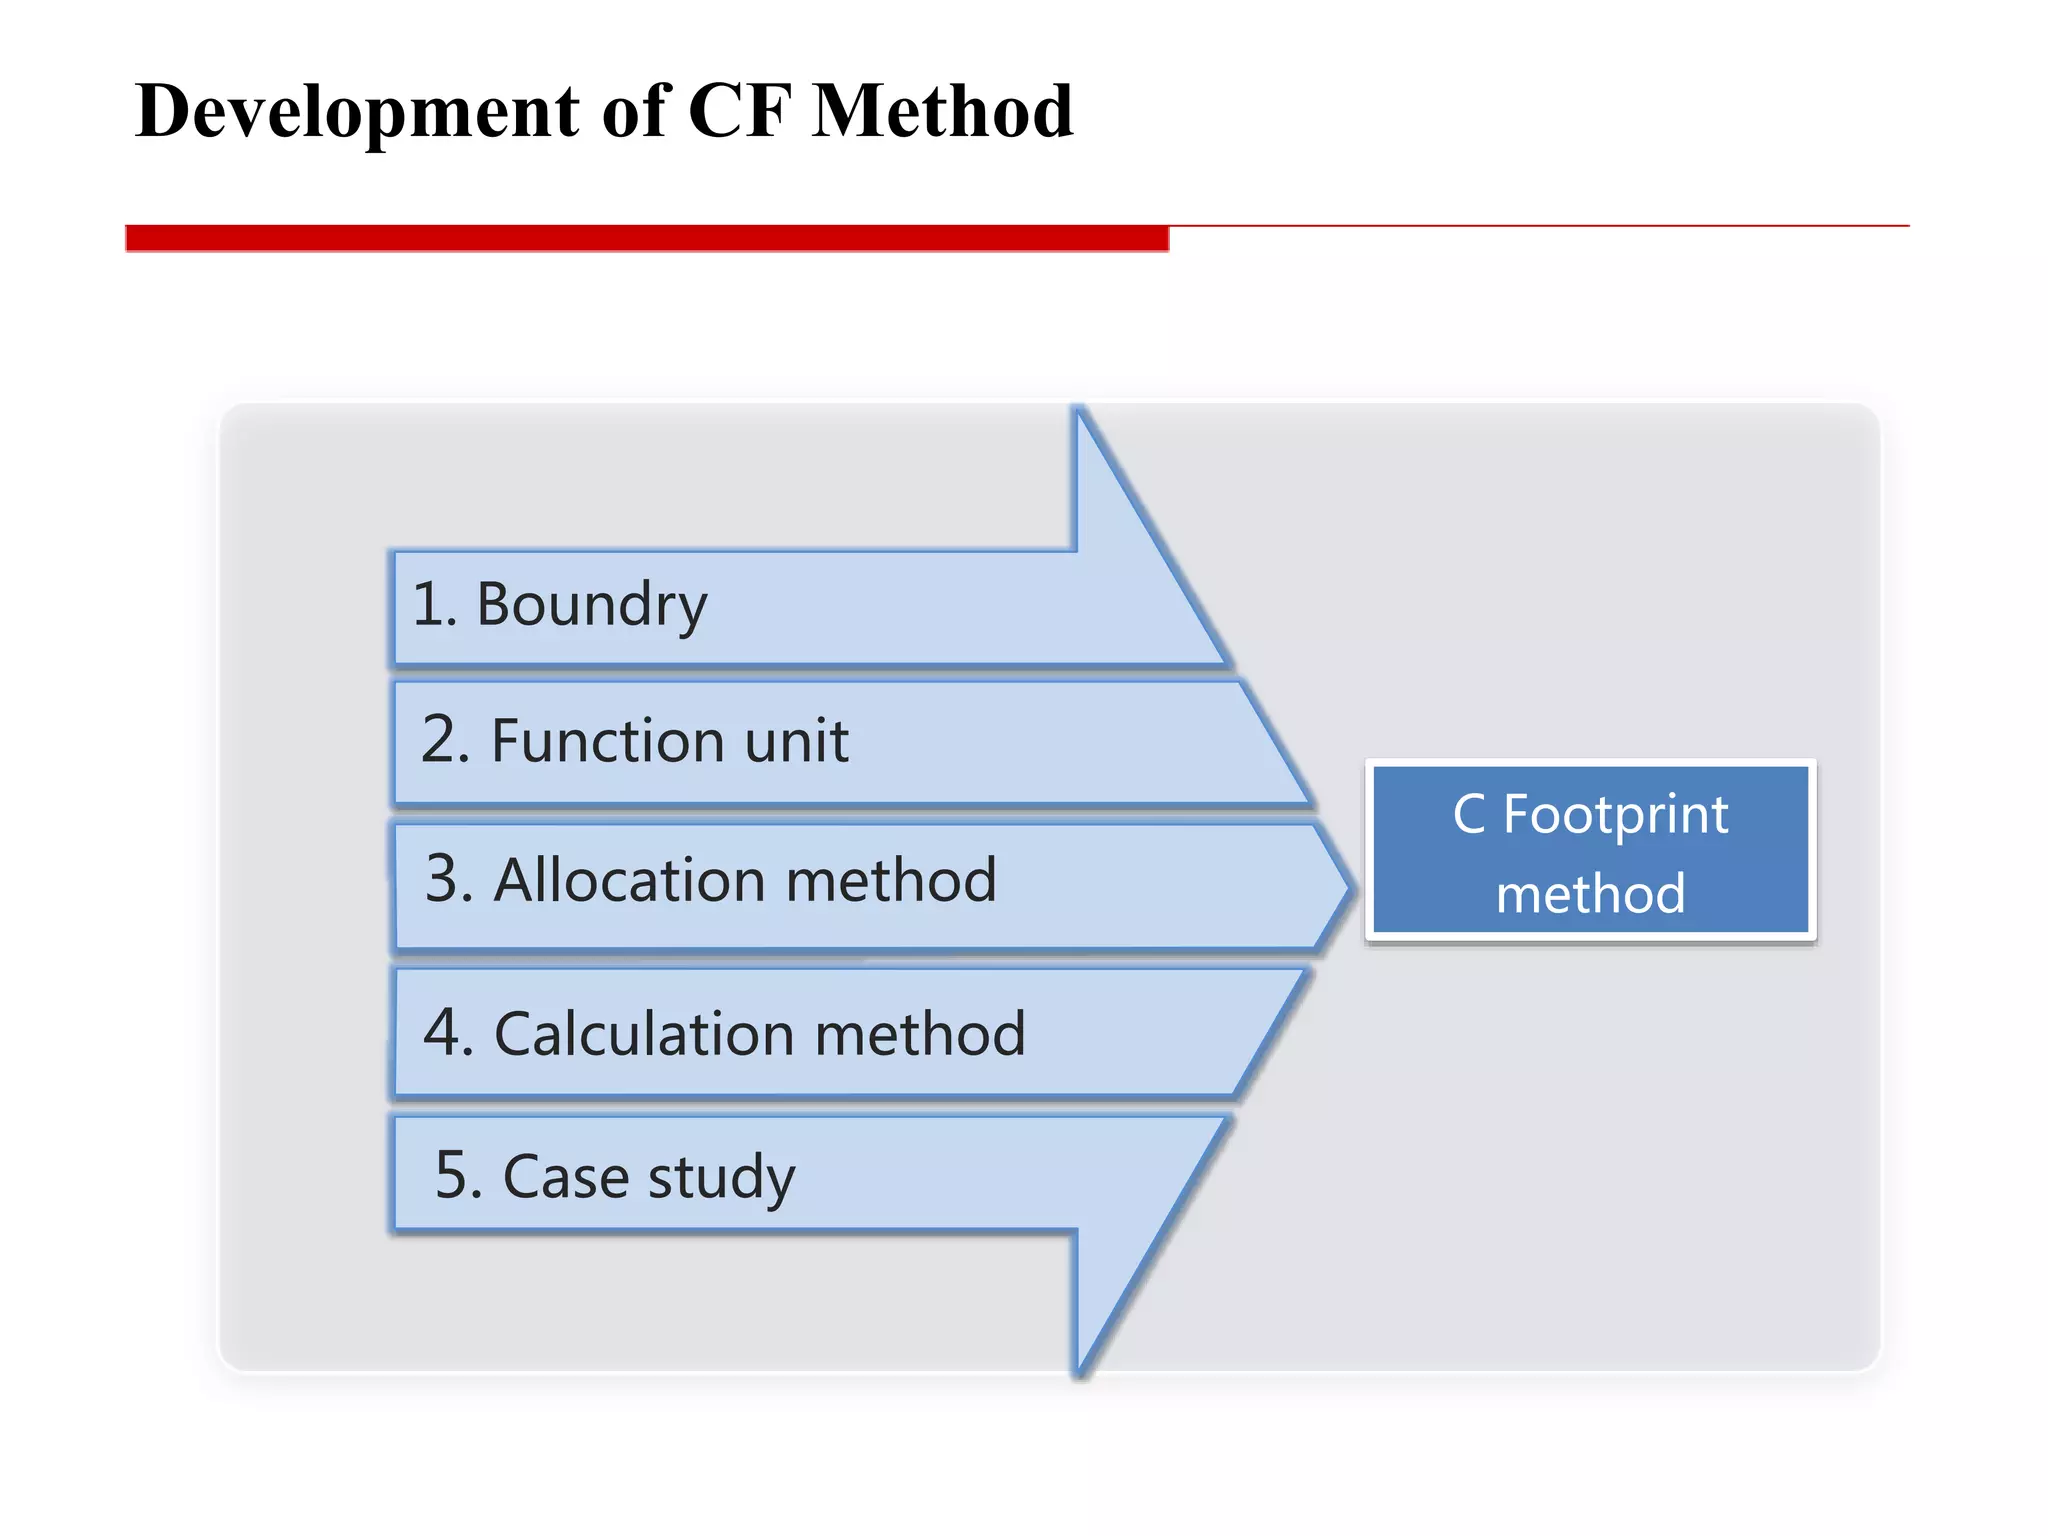
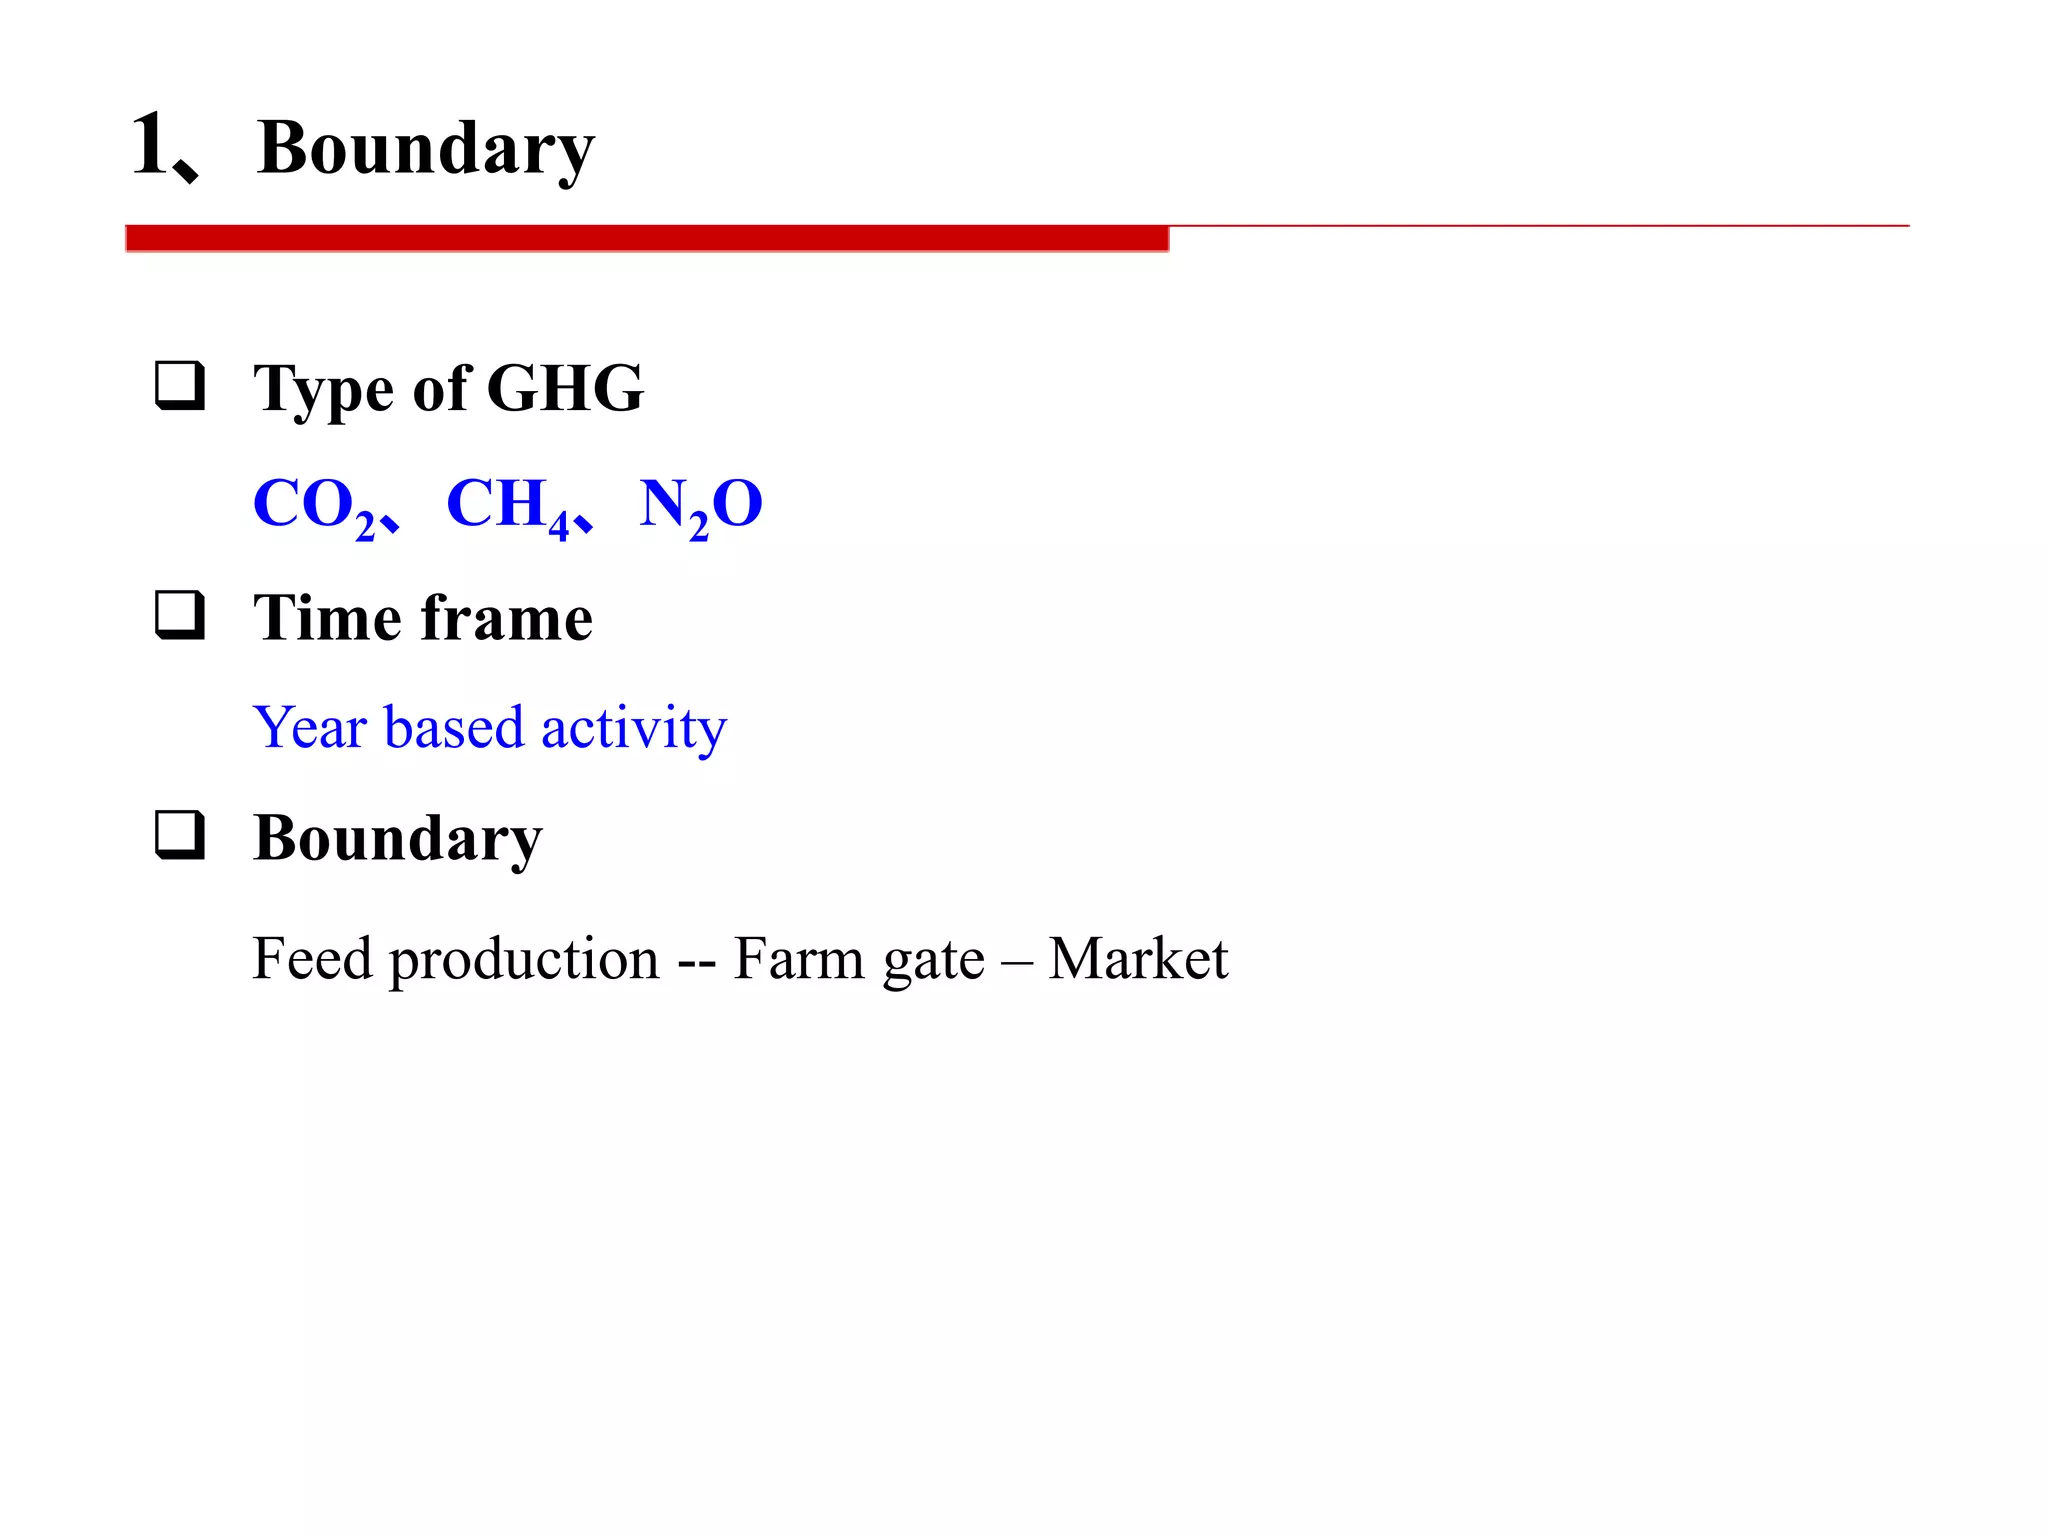
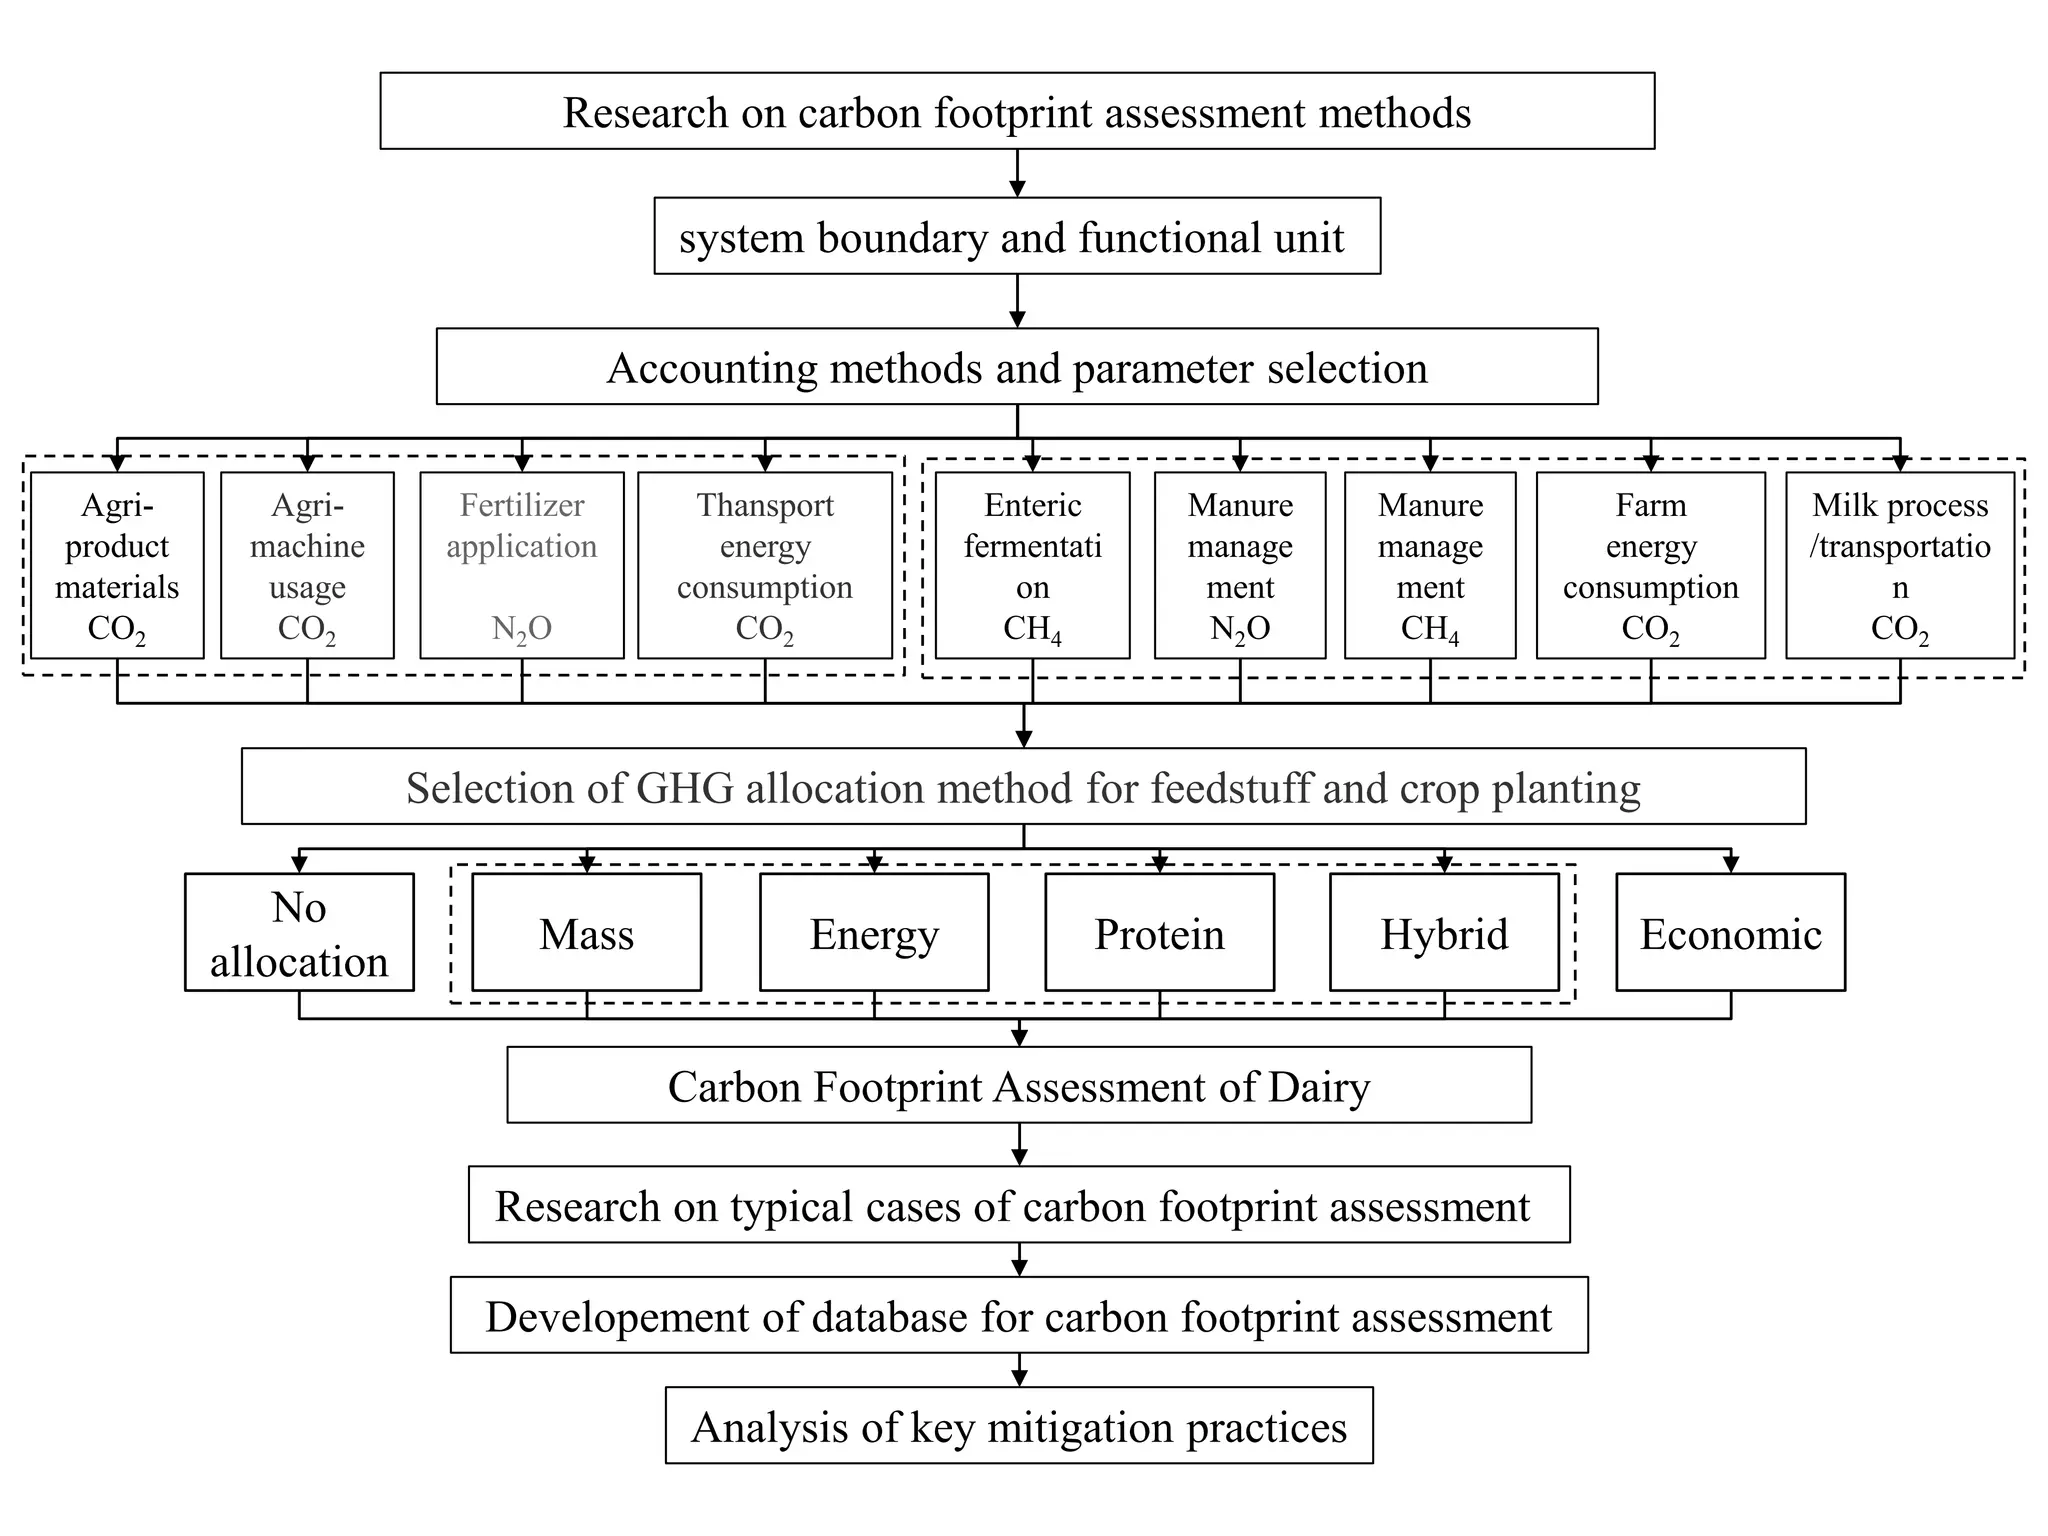
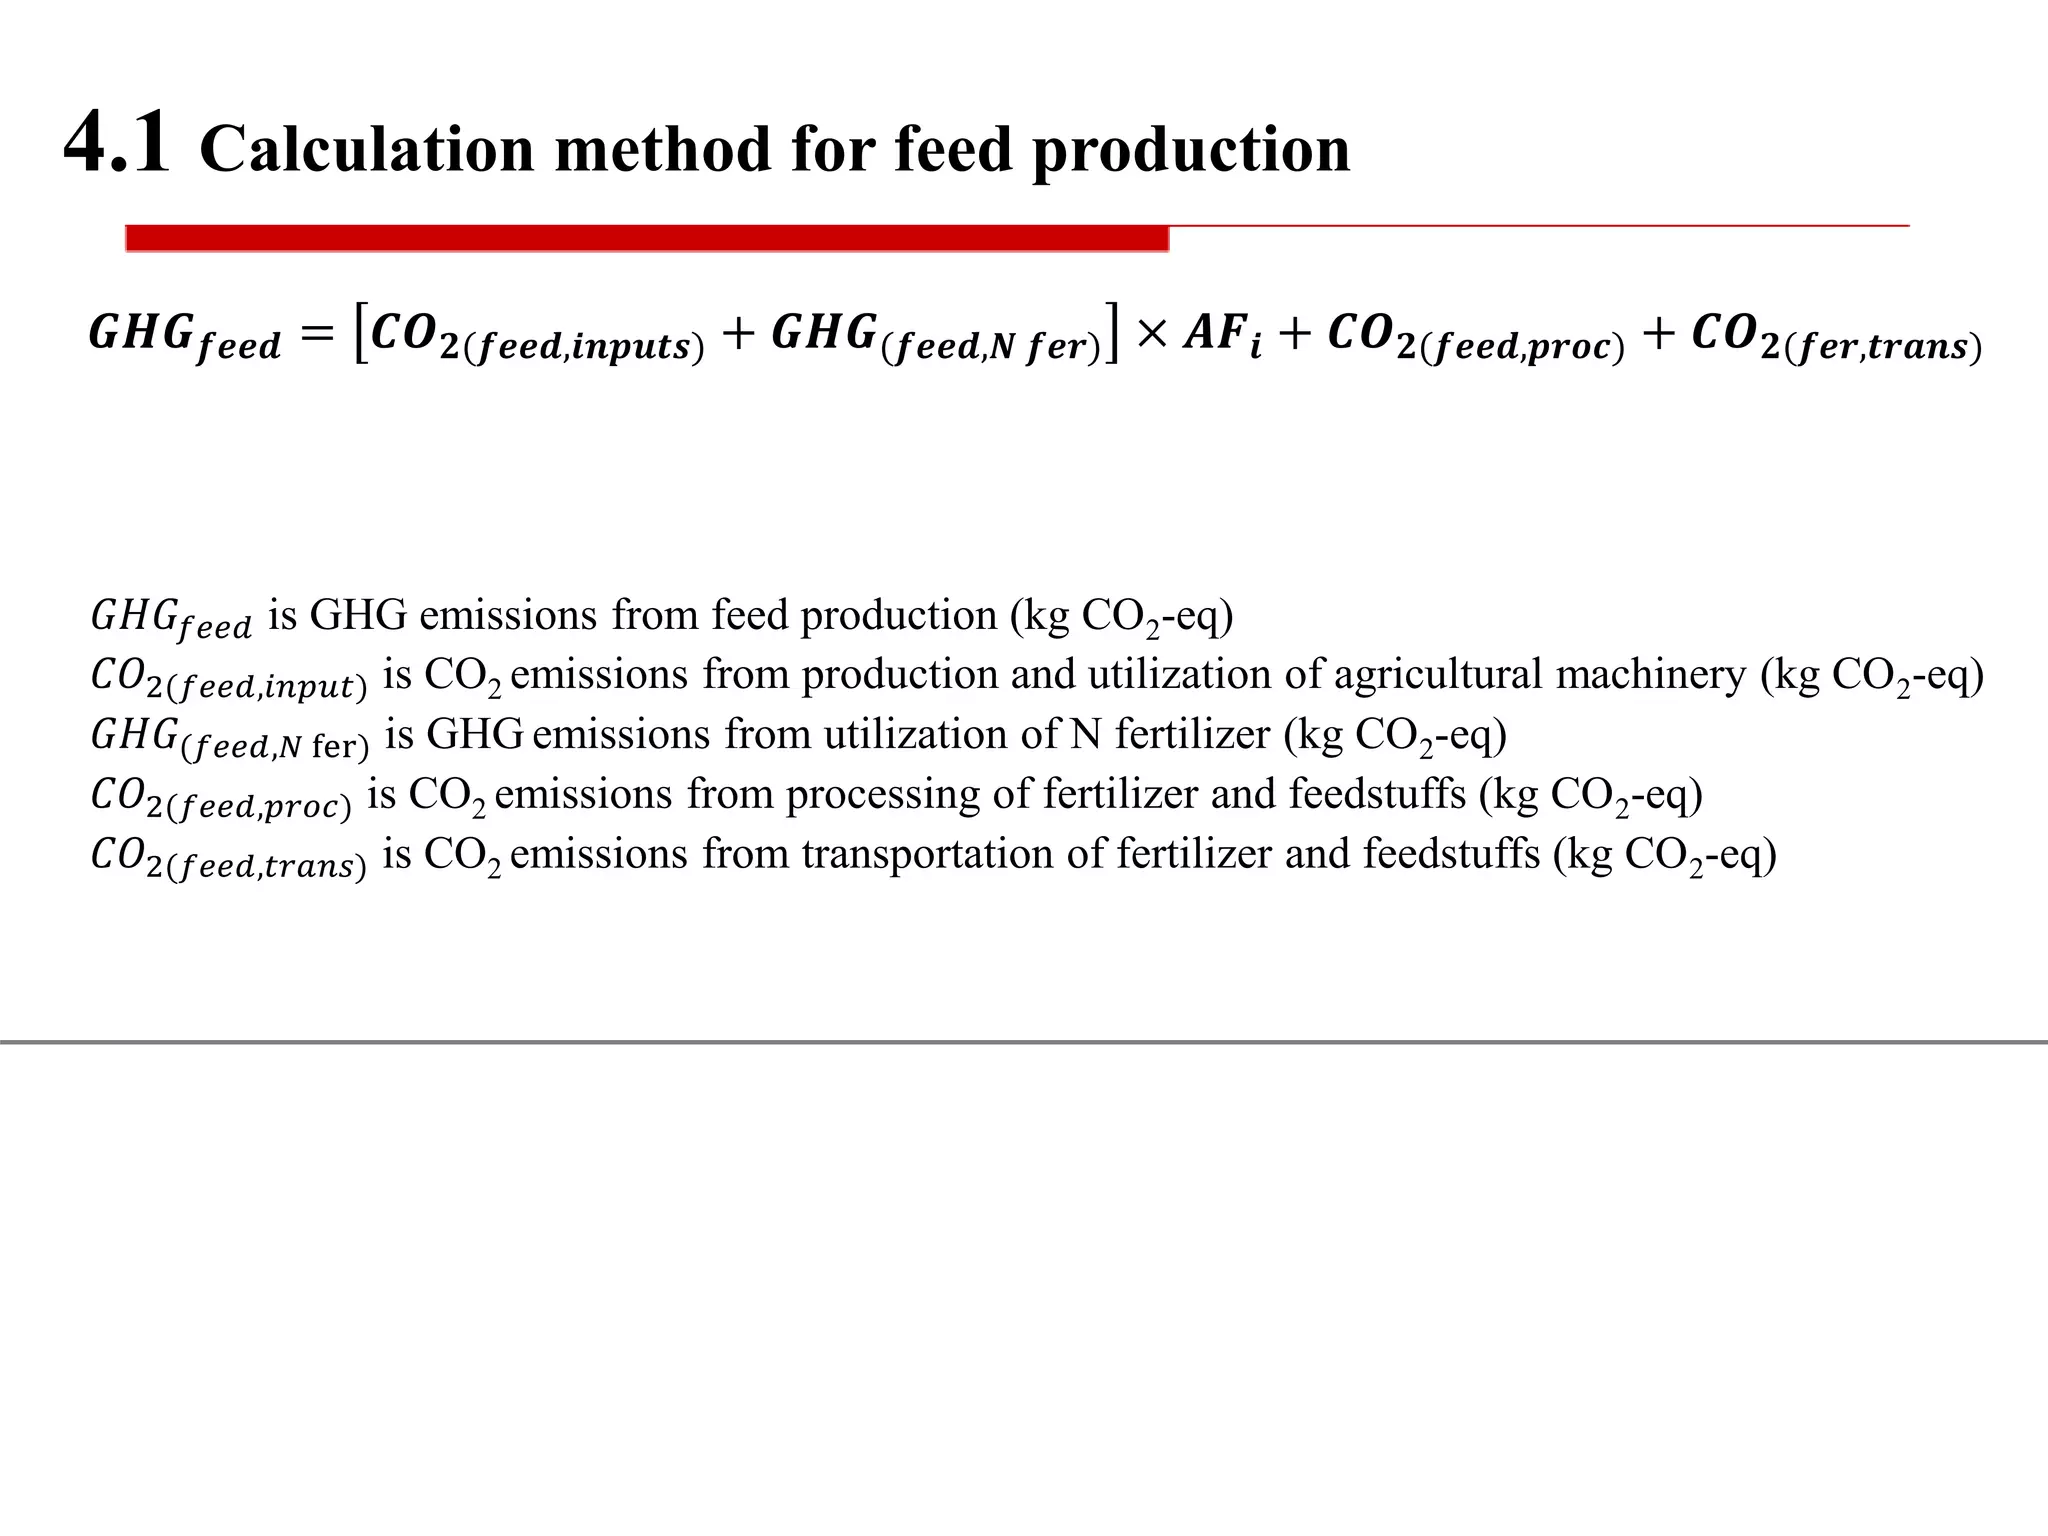
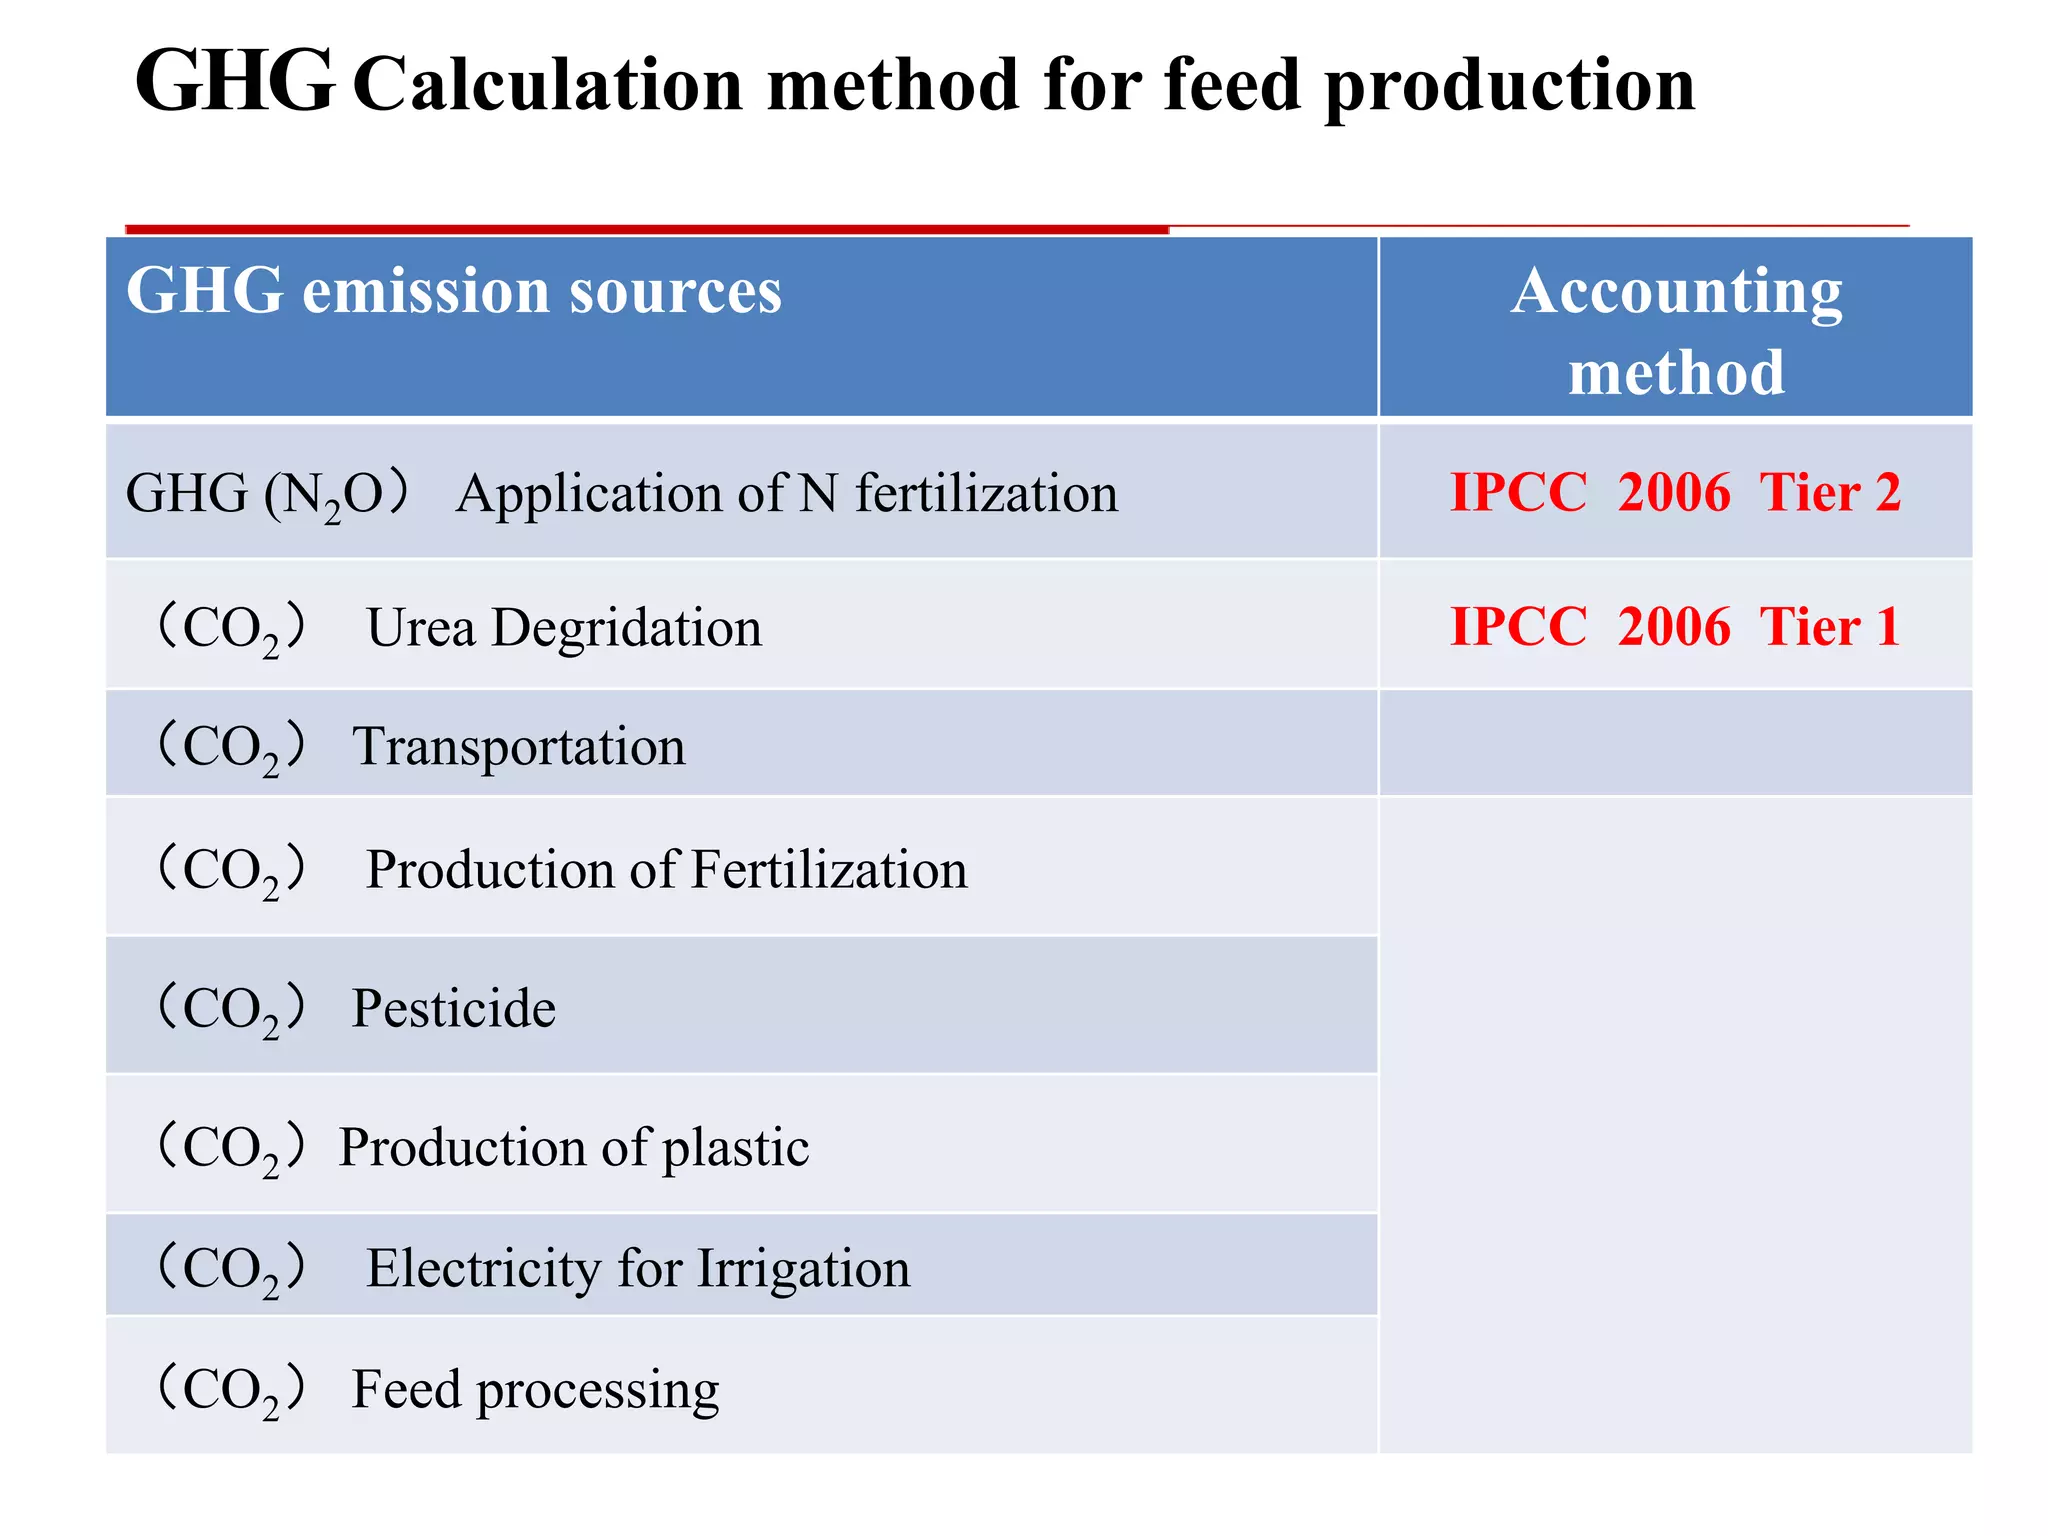
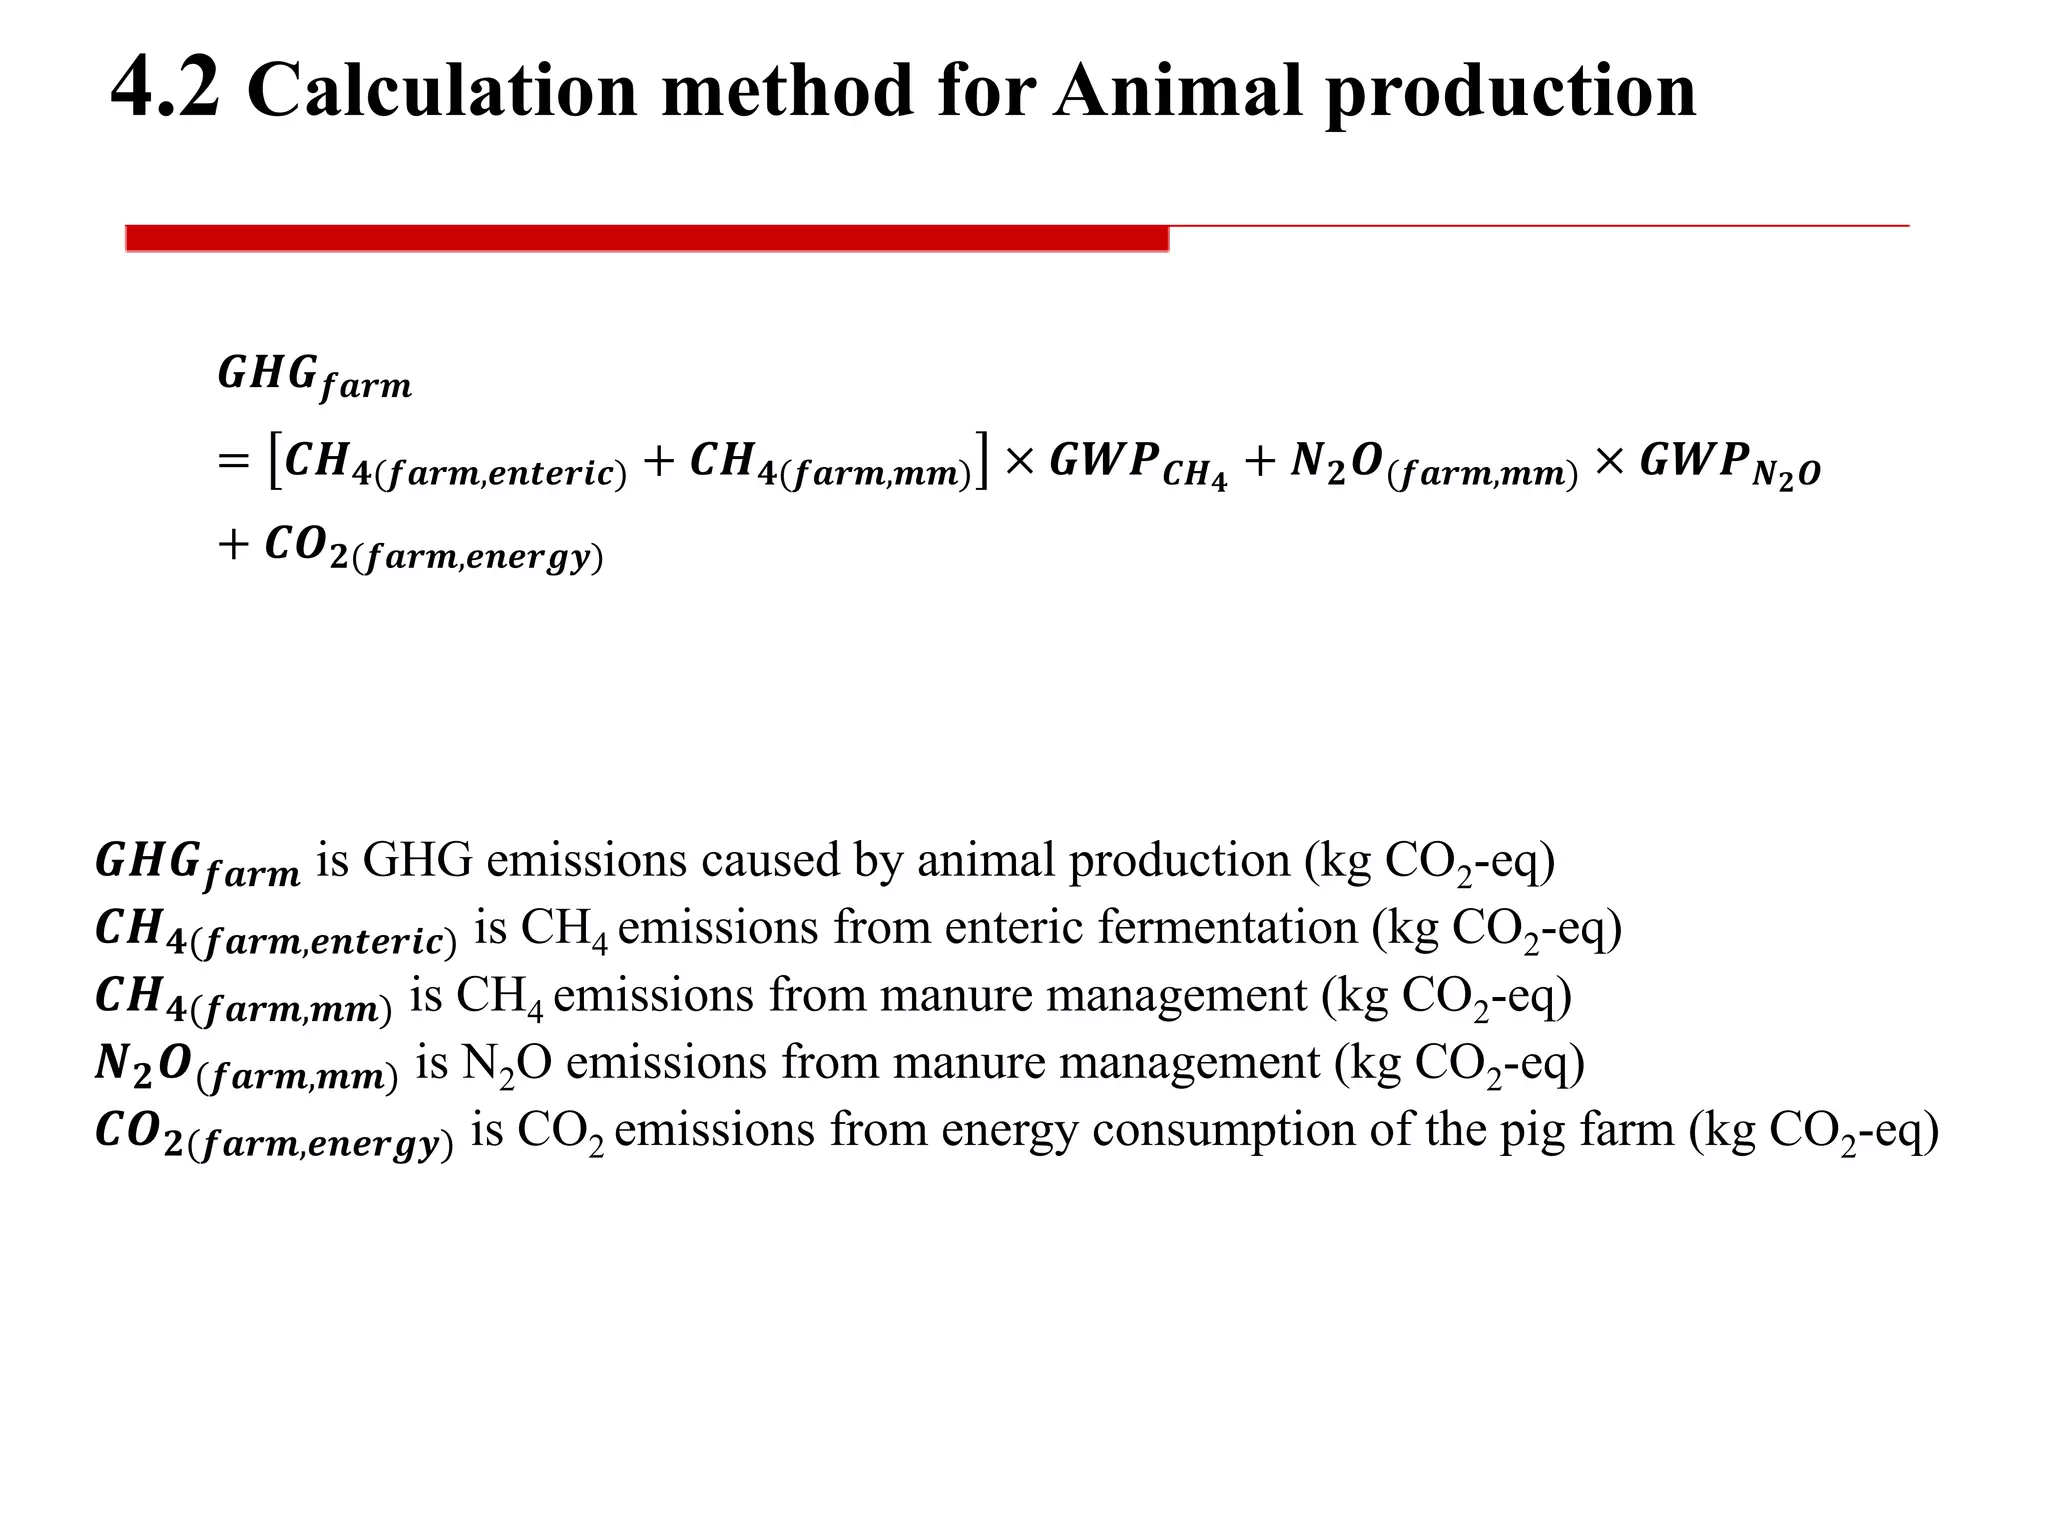
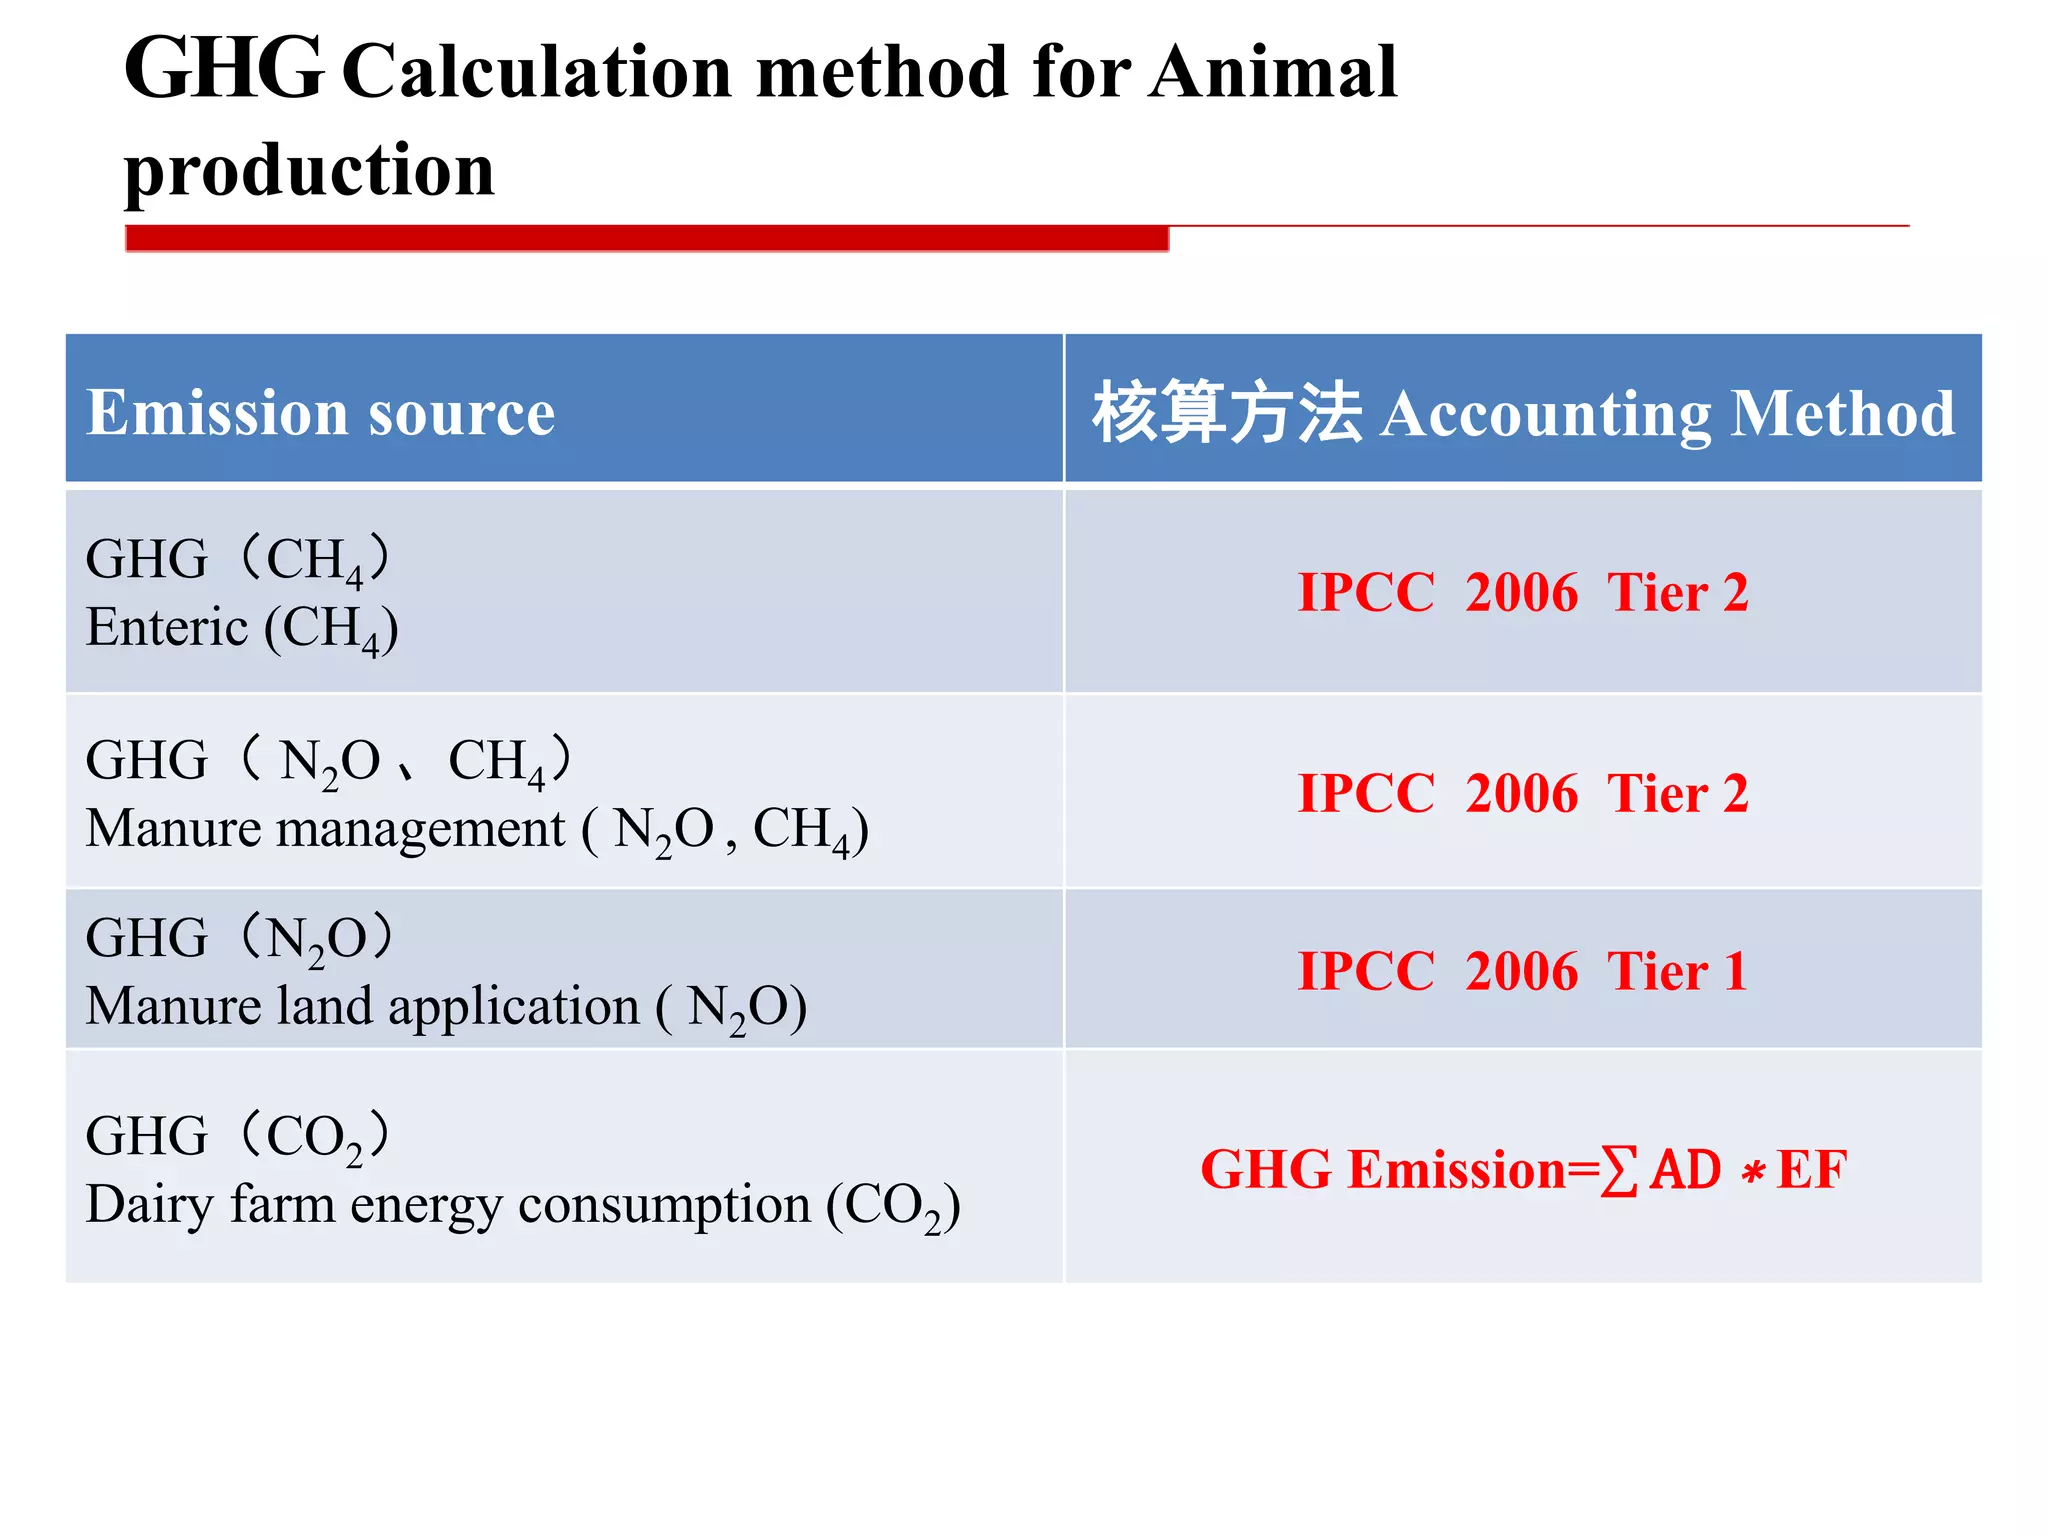
Steps for developing a carbon footprint method including boundaries, function units, and overall assessment structure.
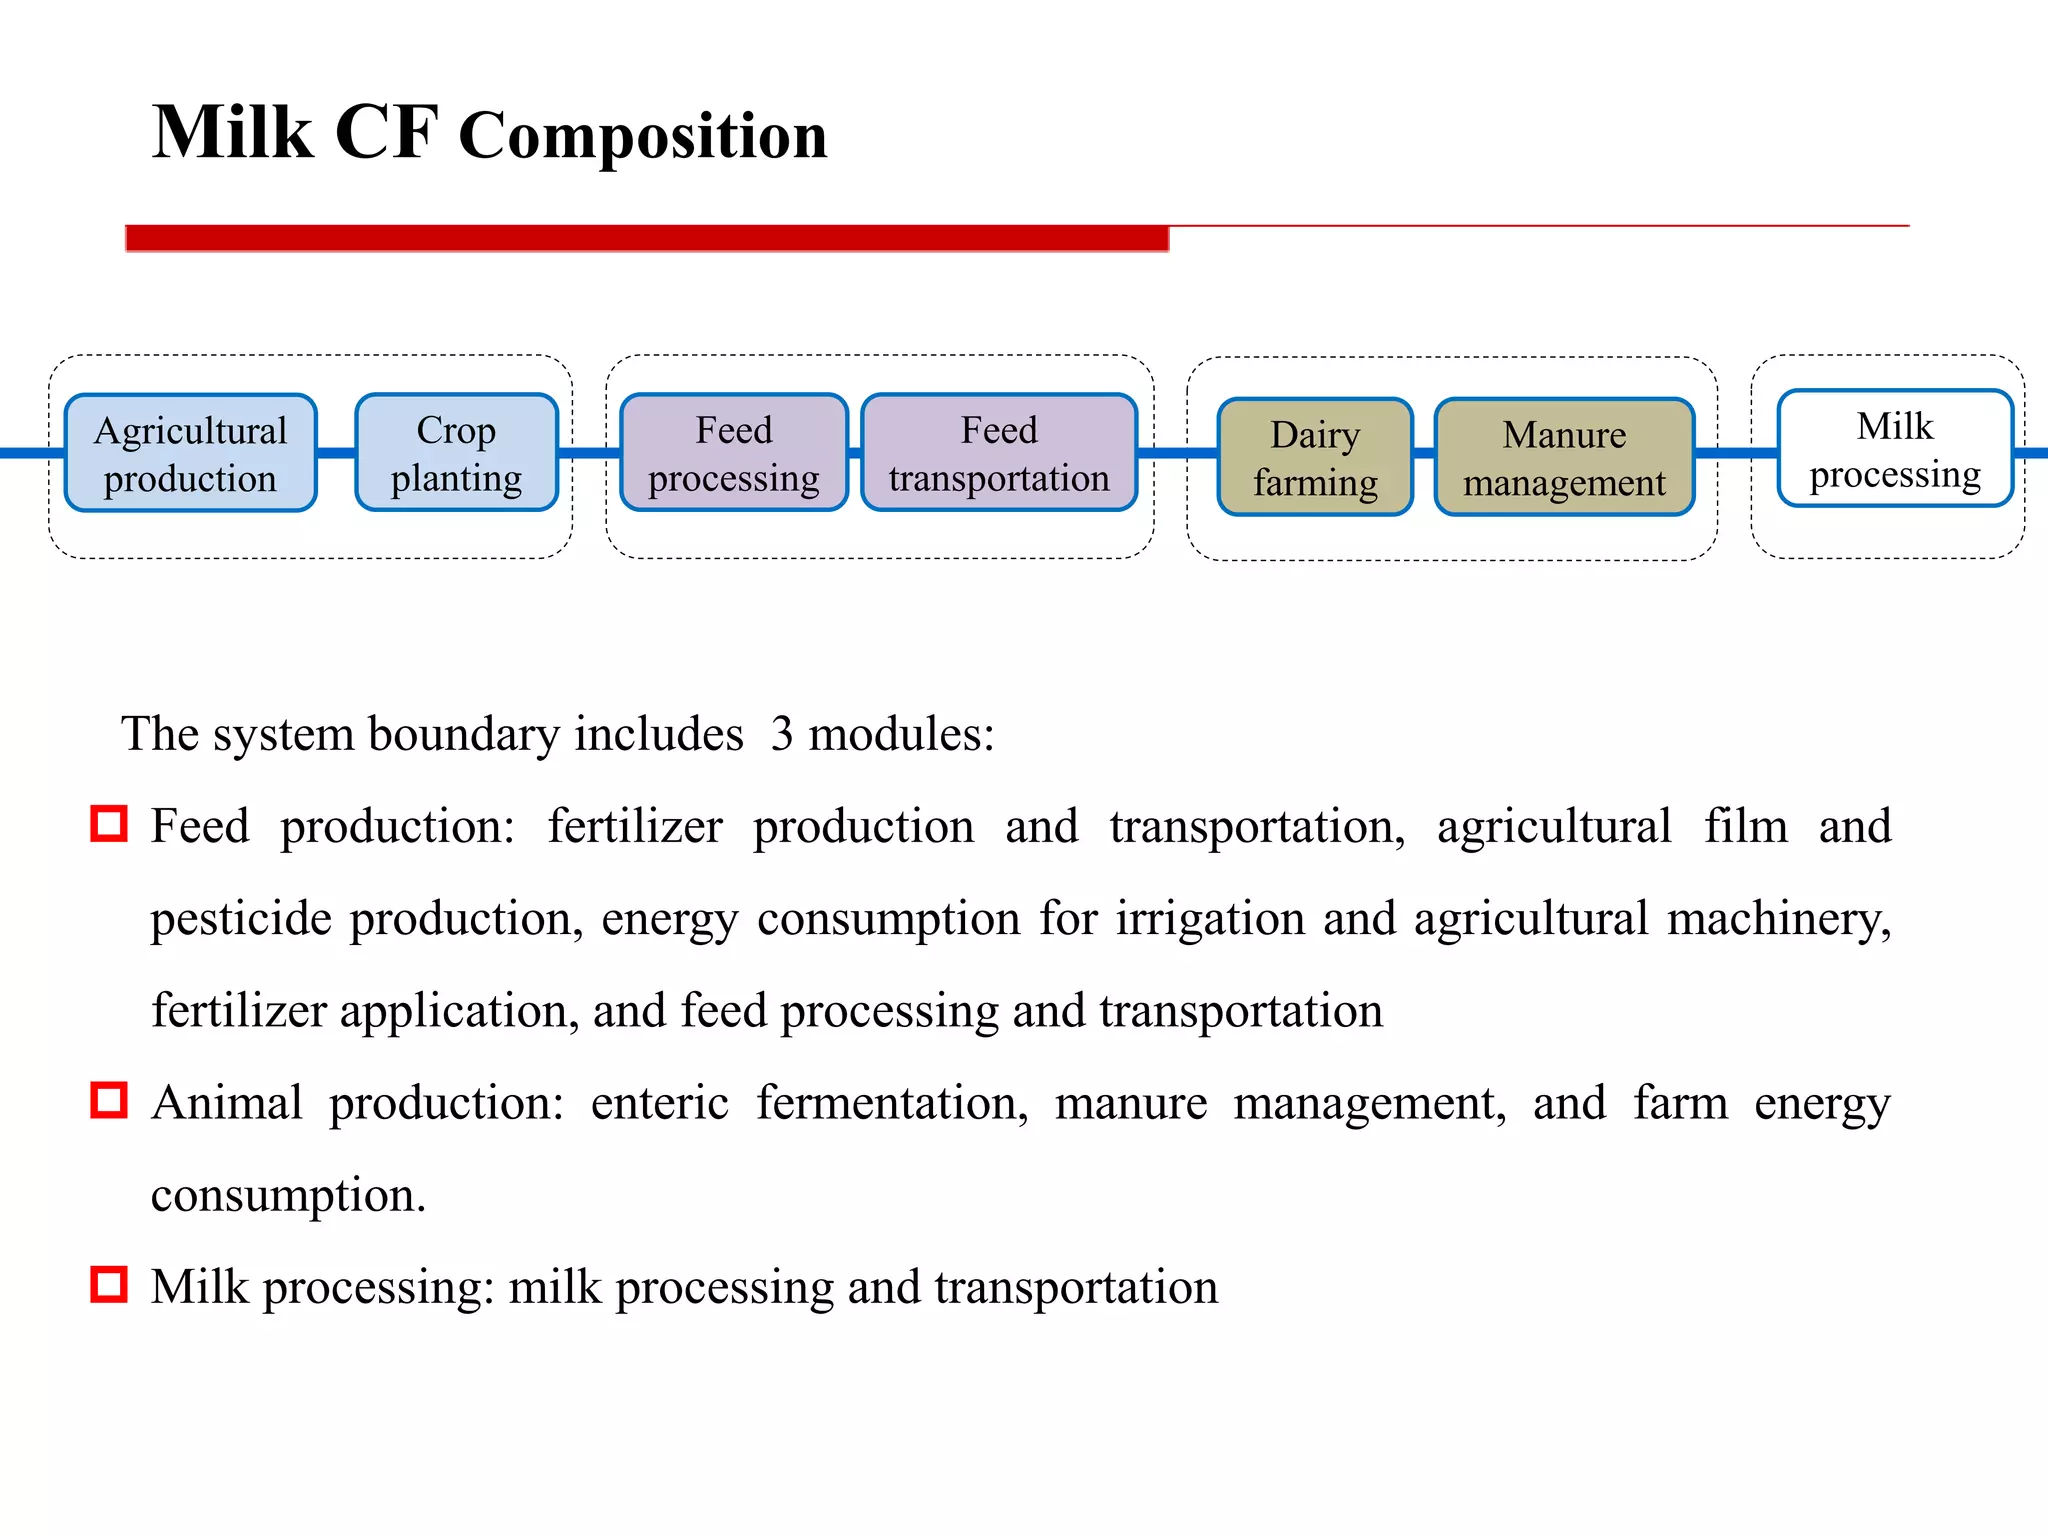
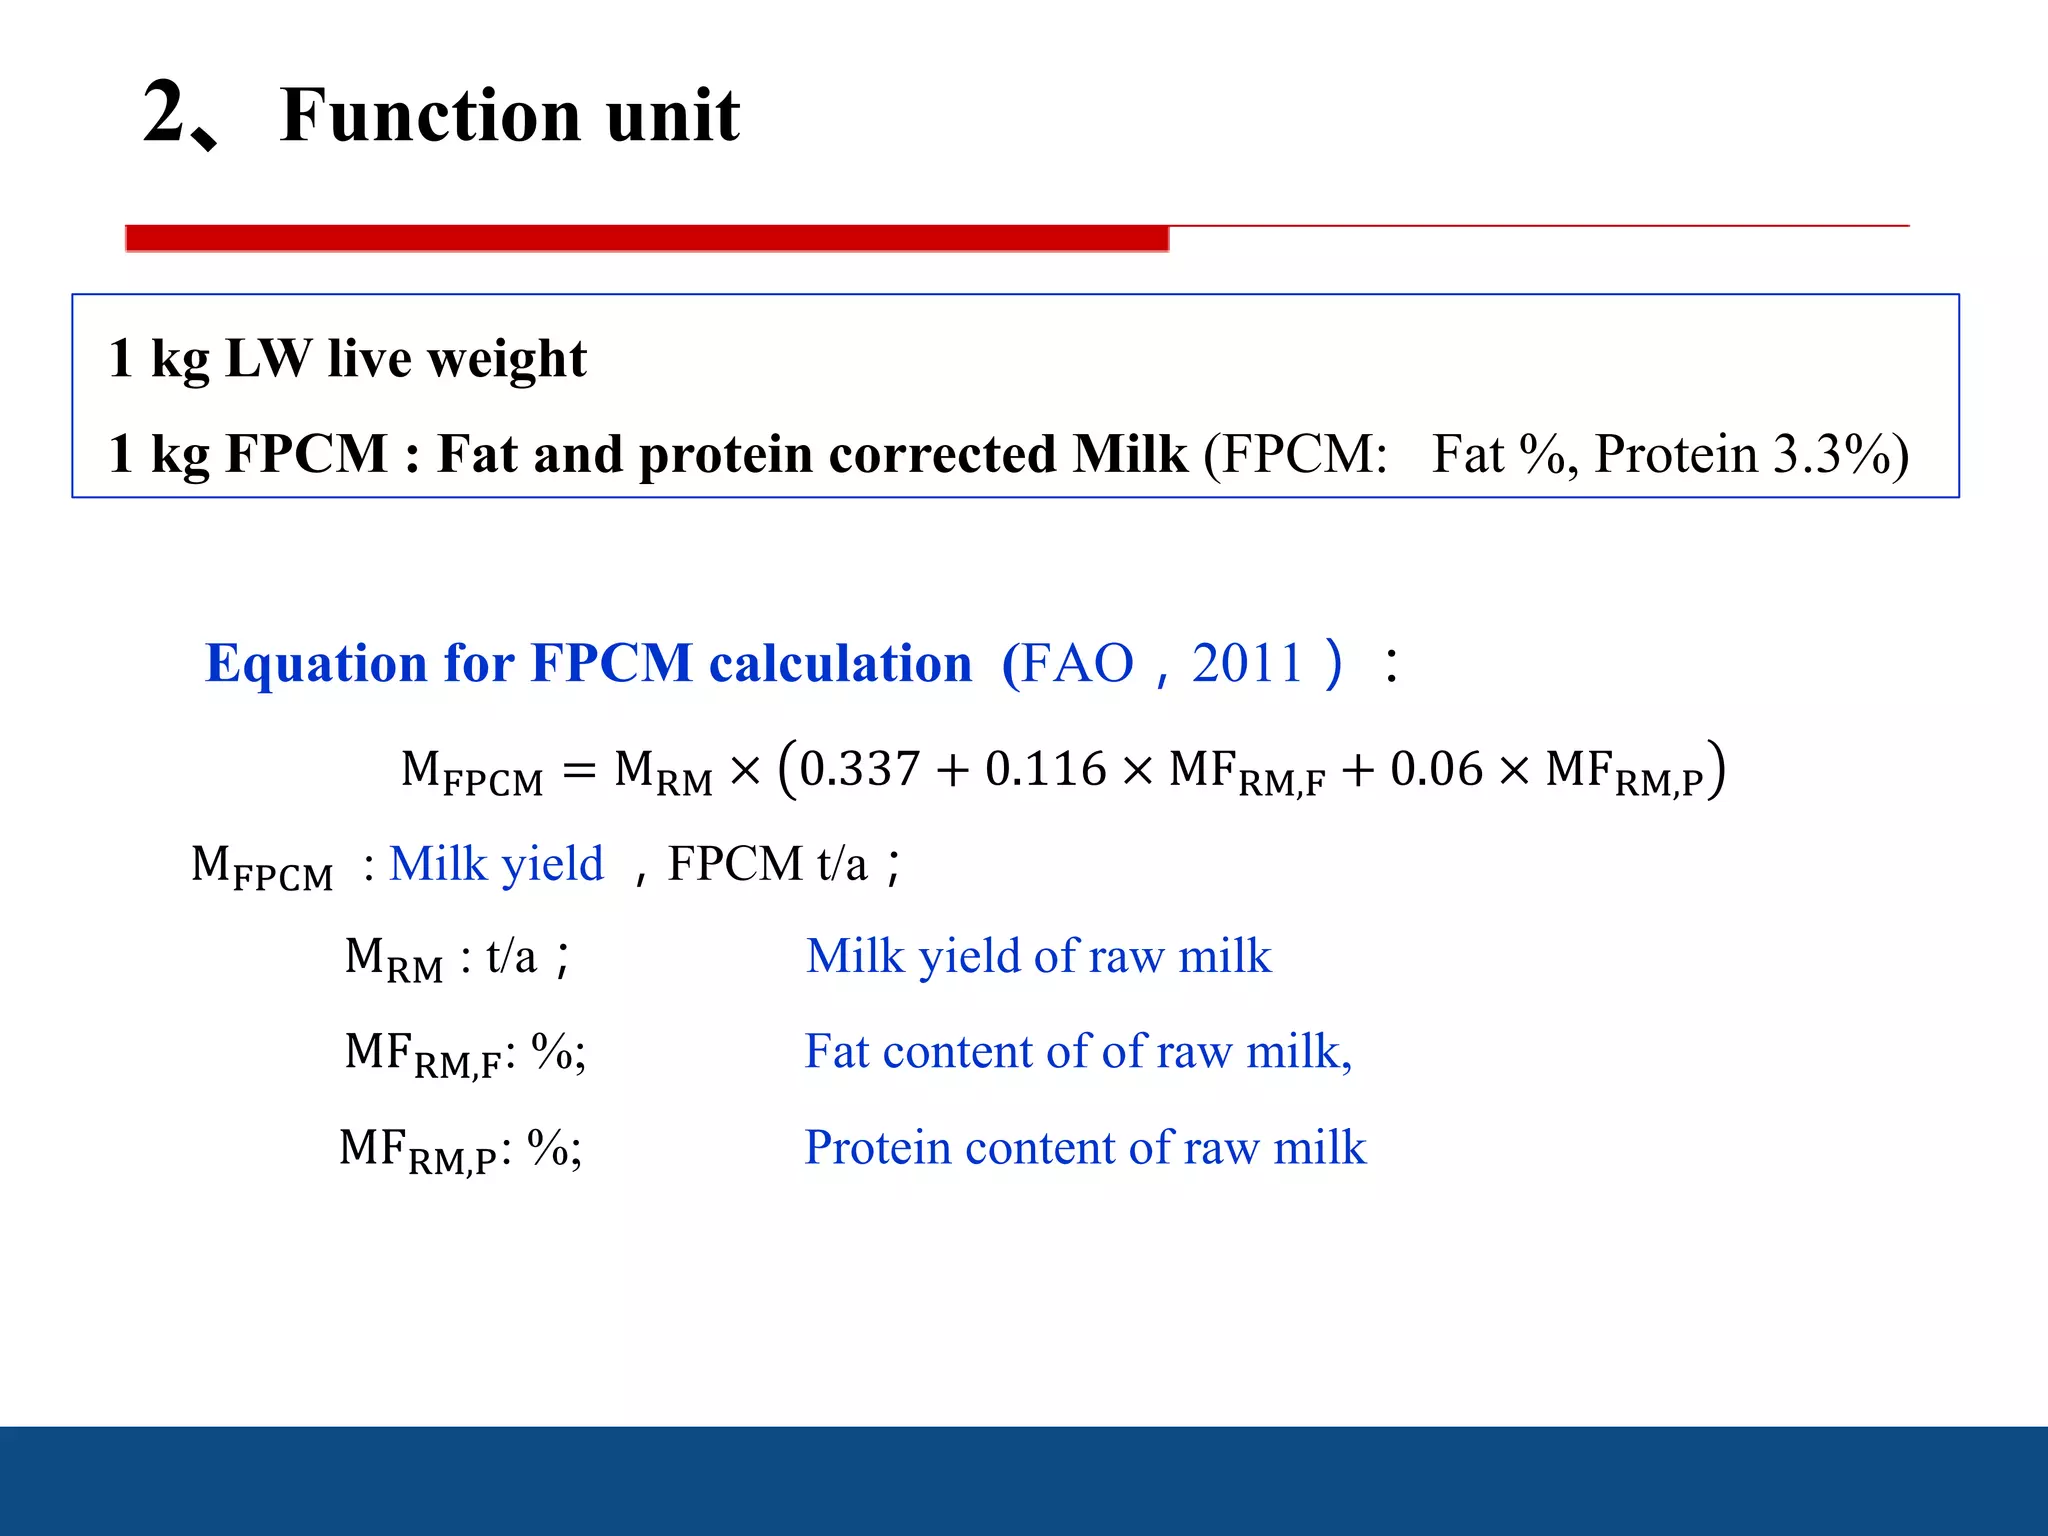
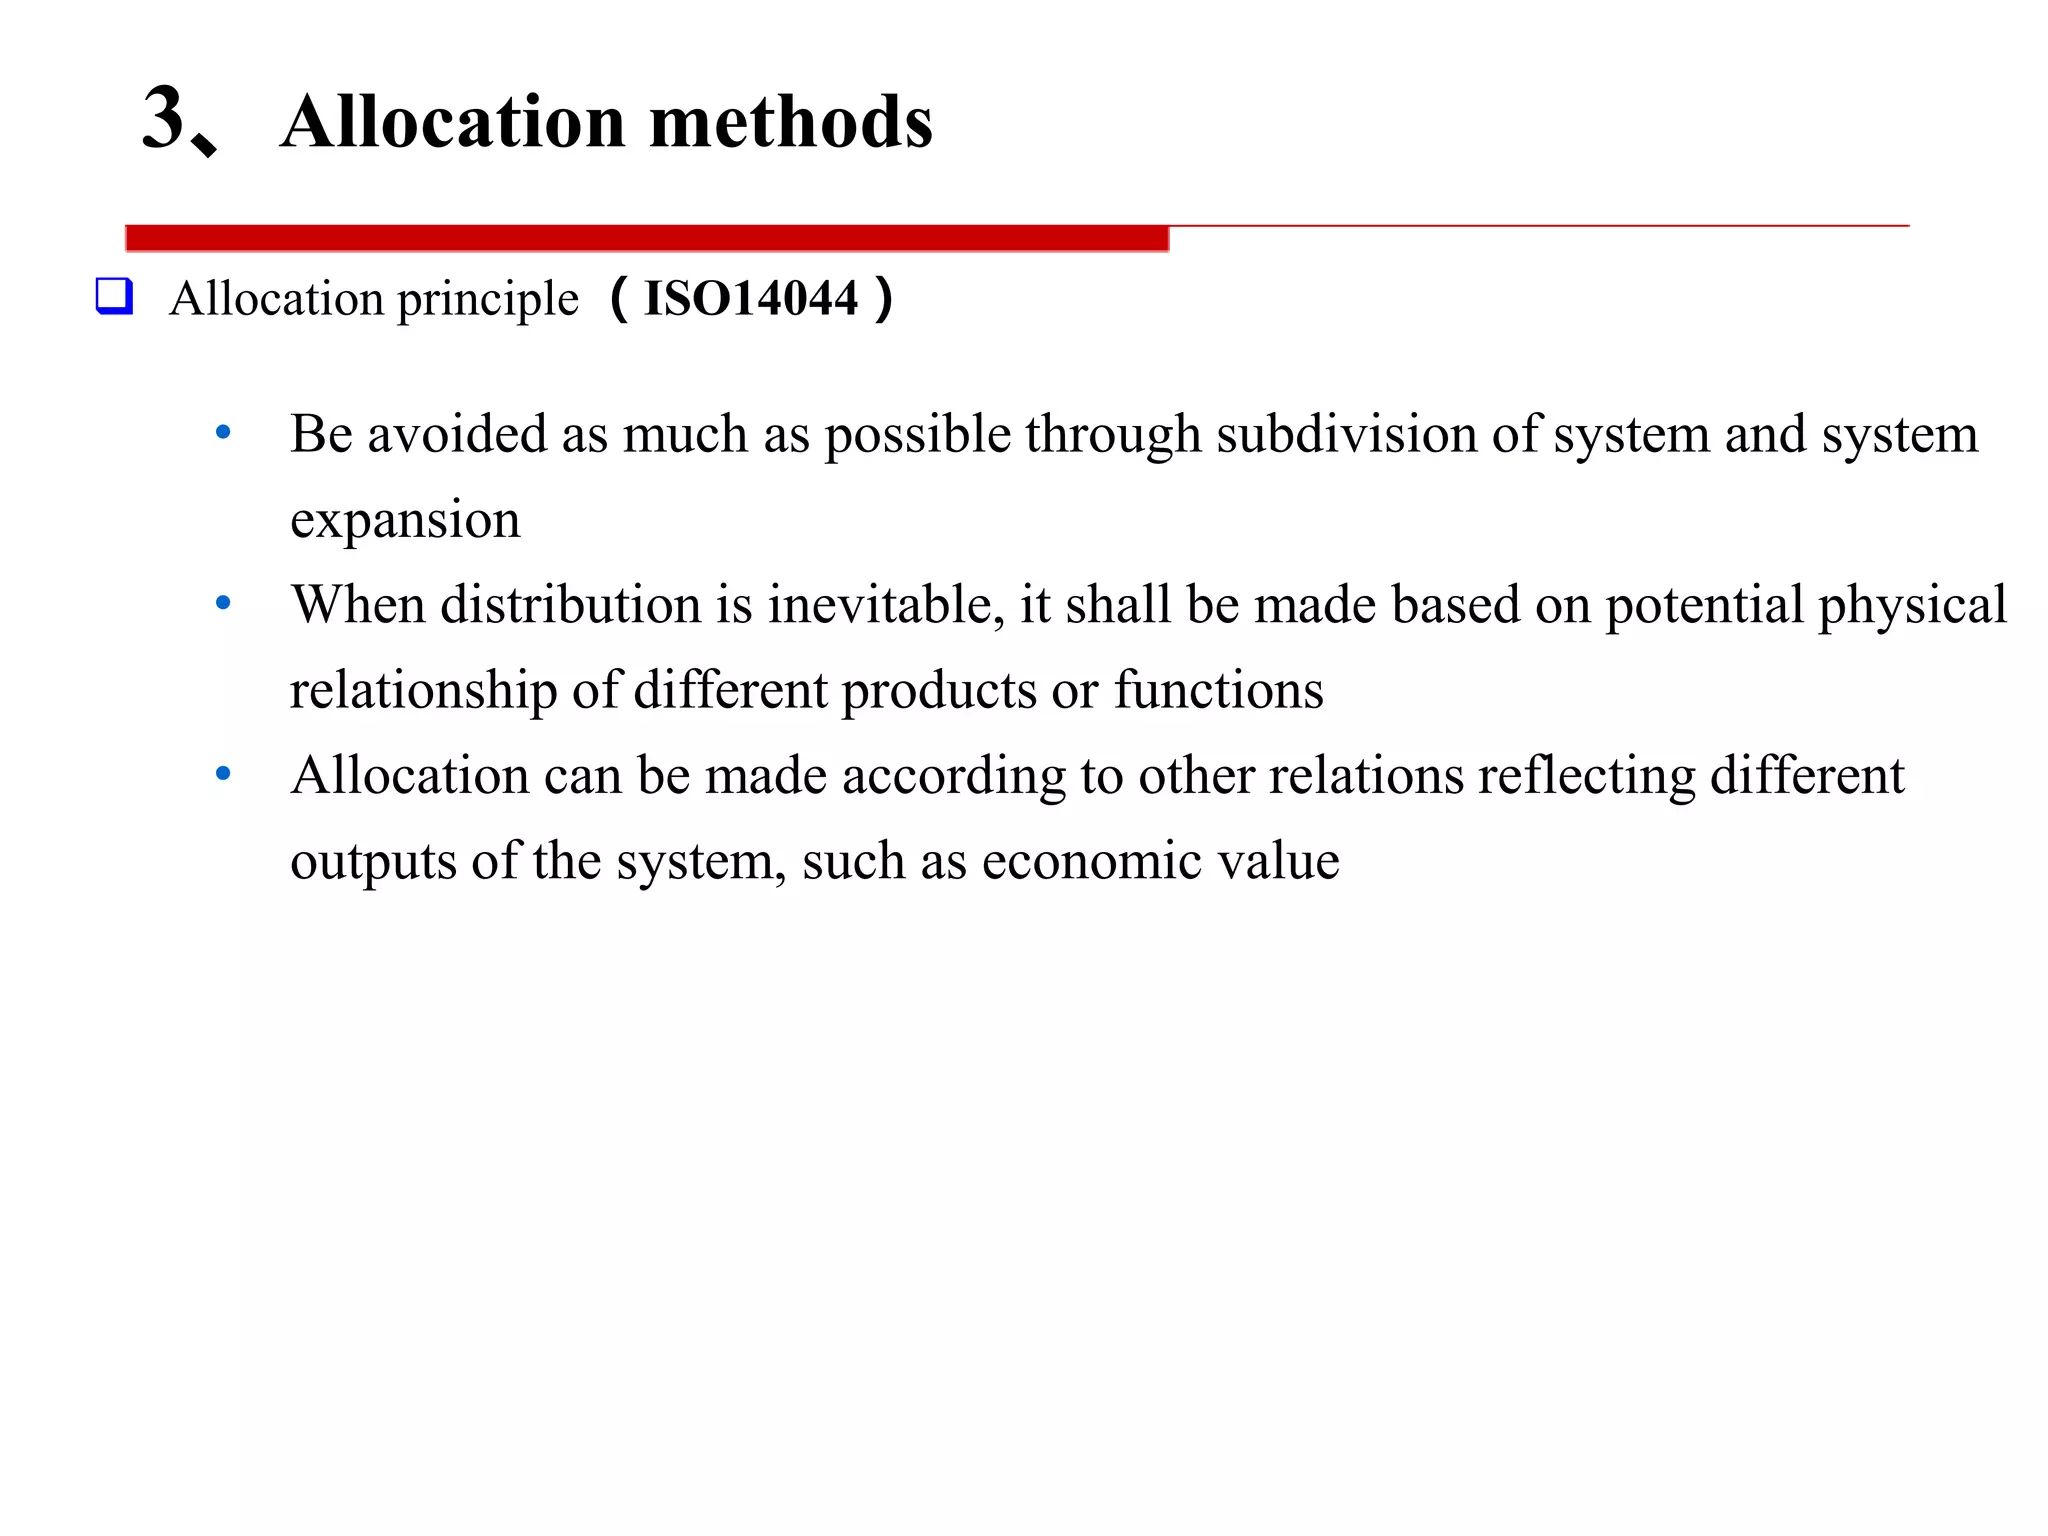
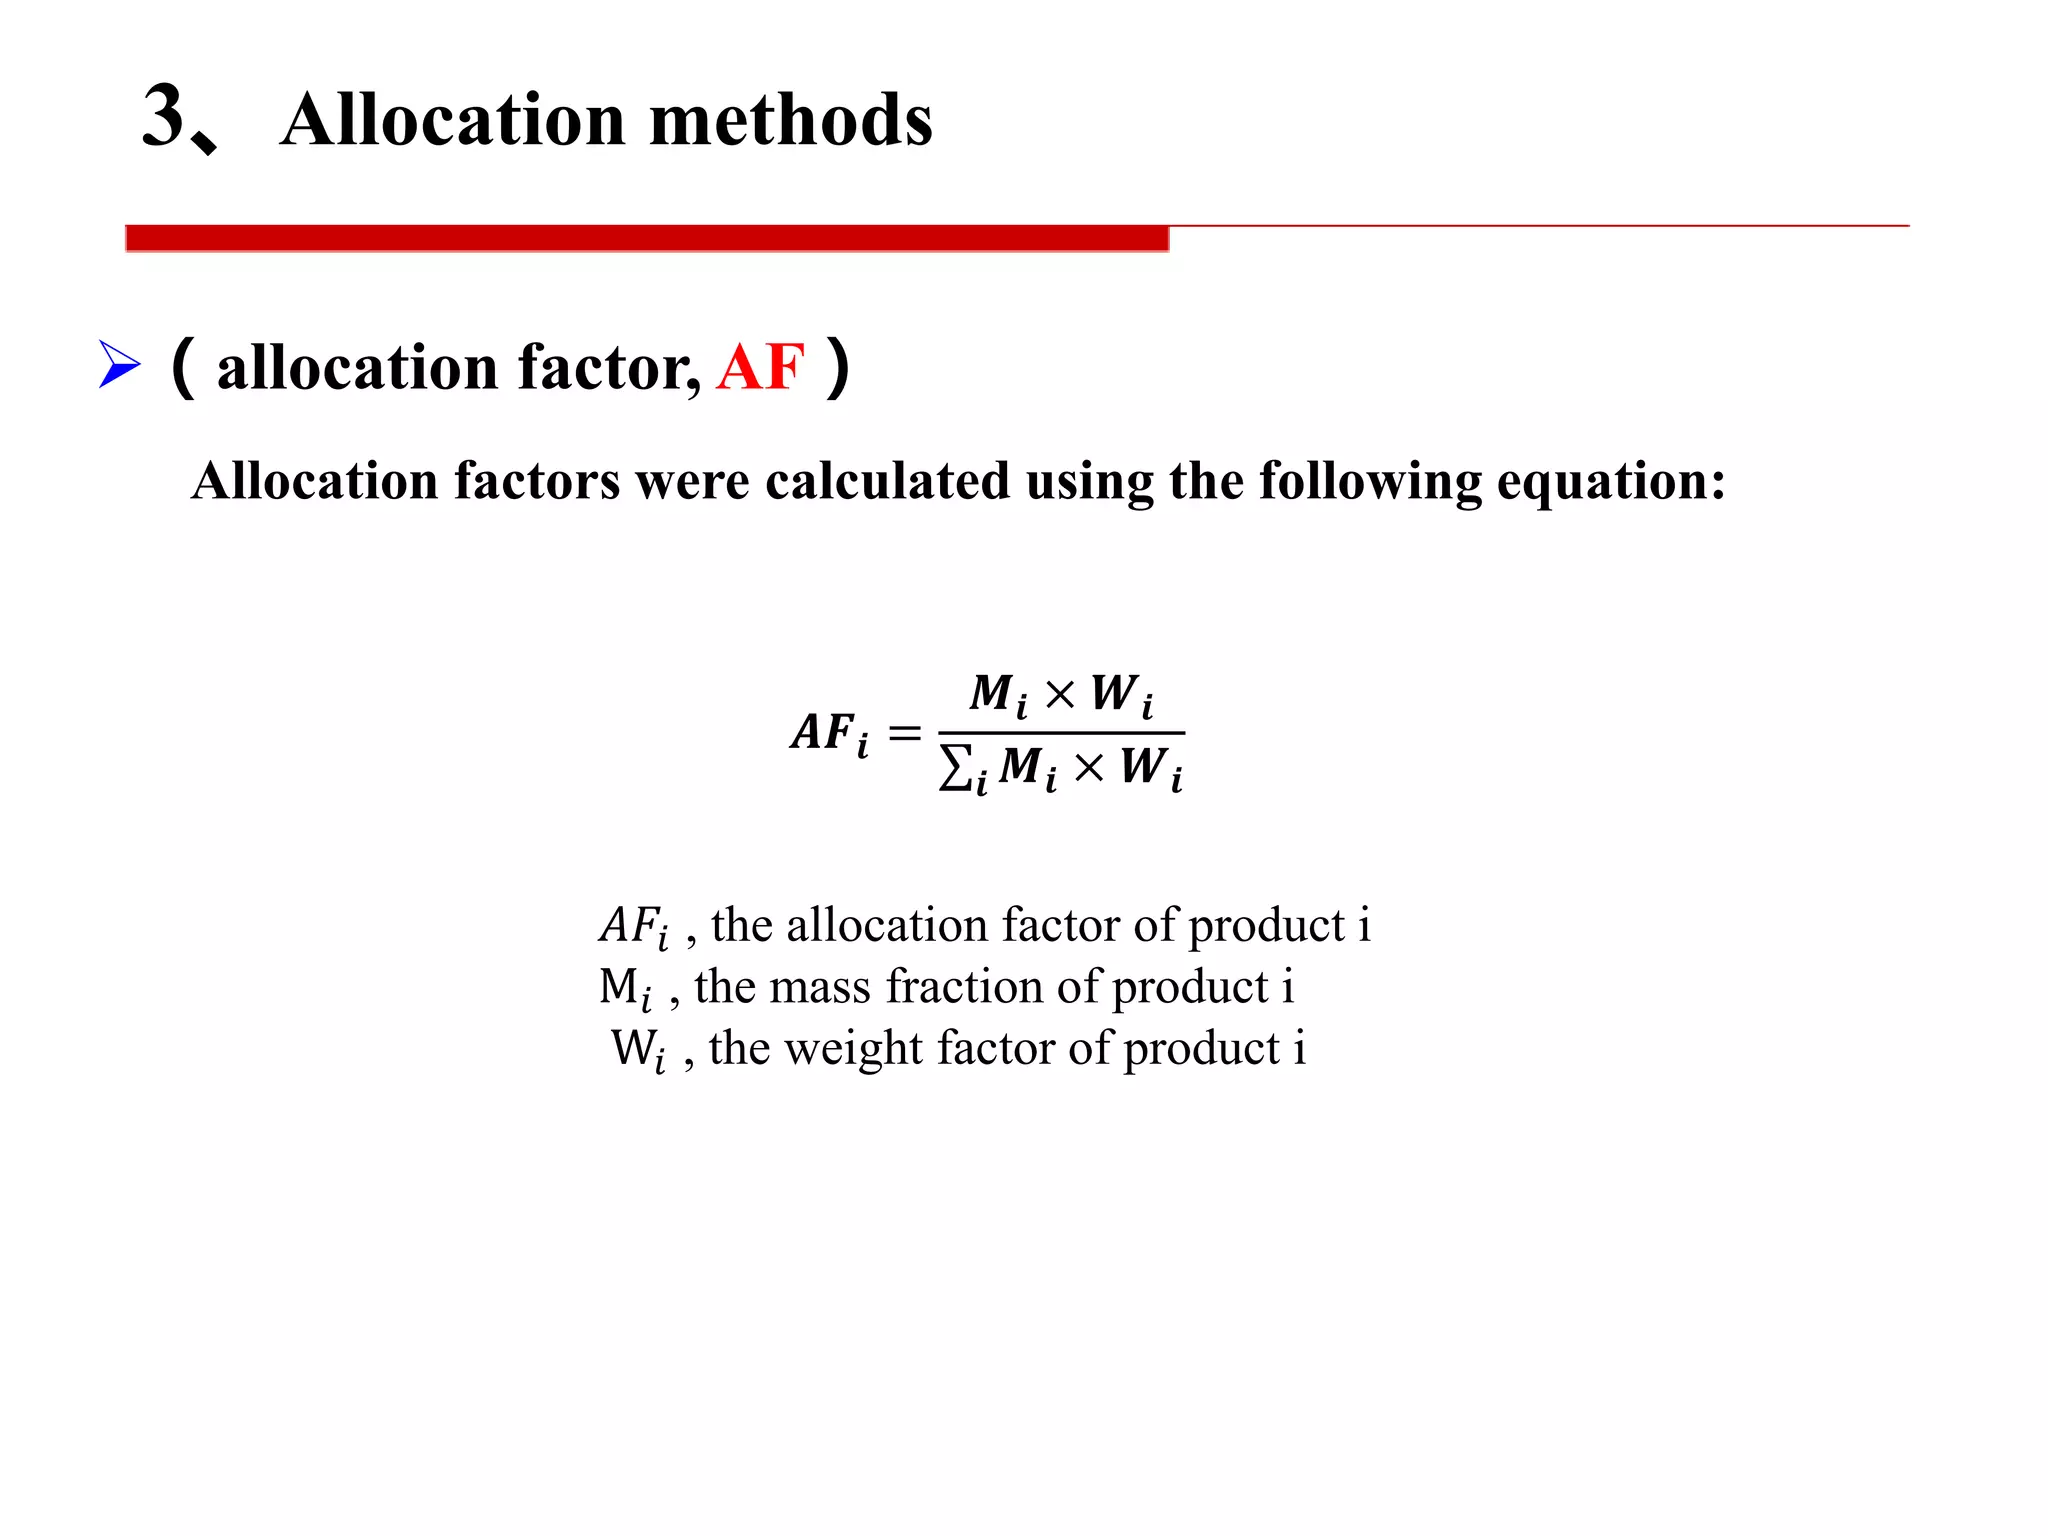
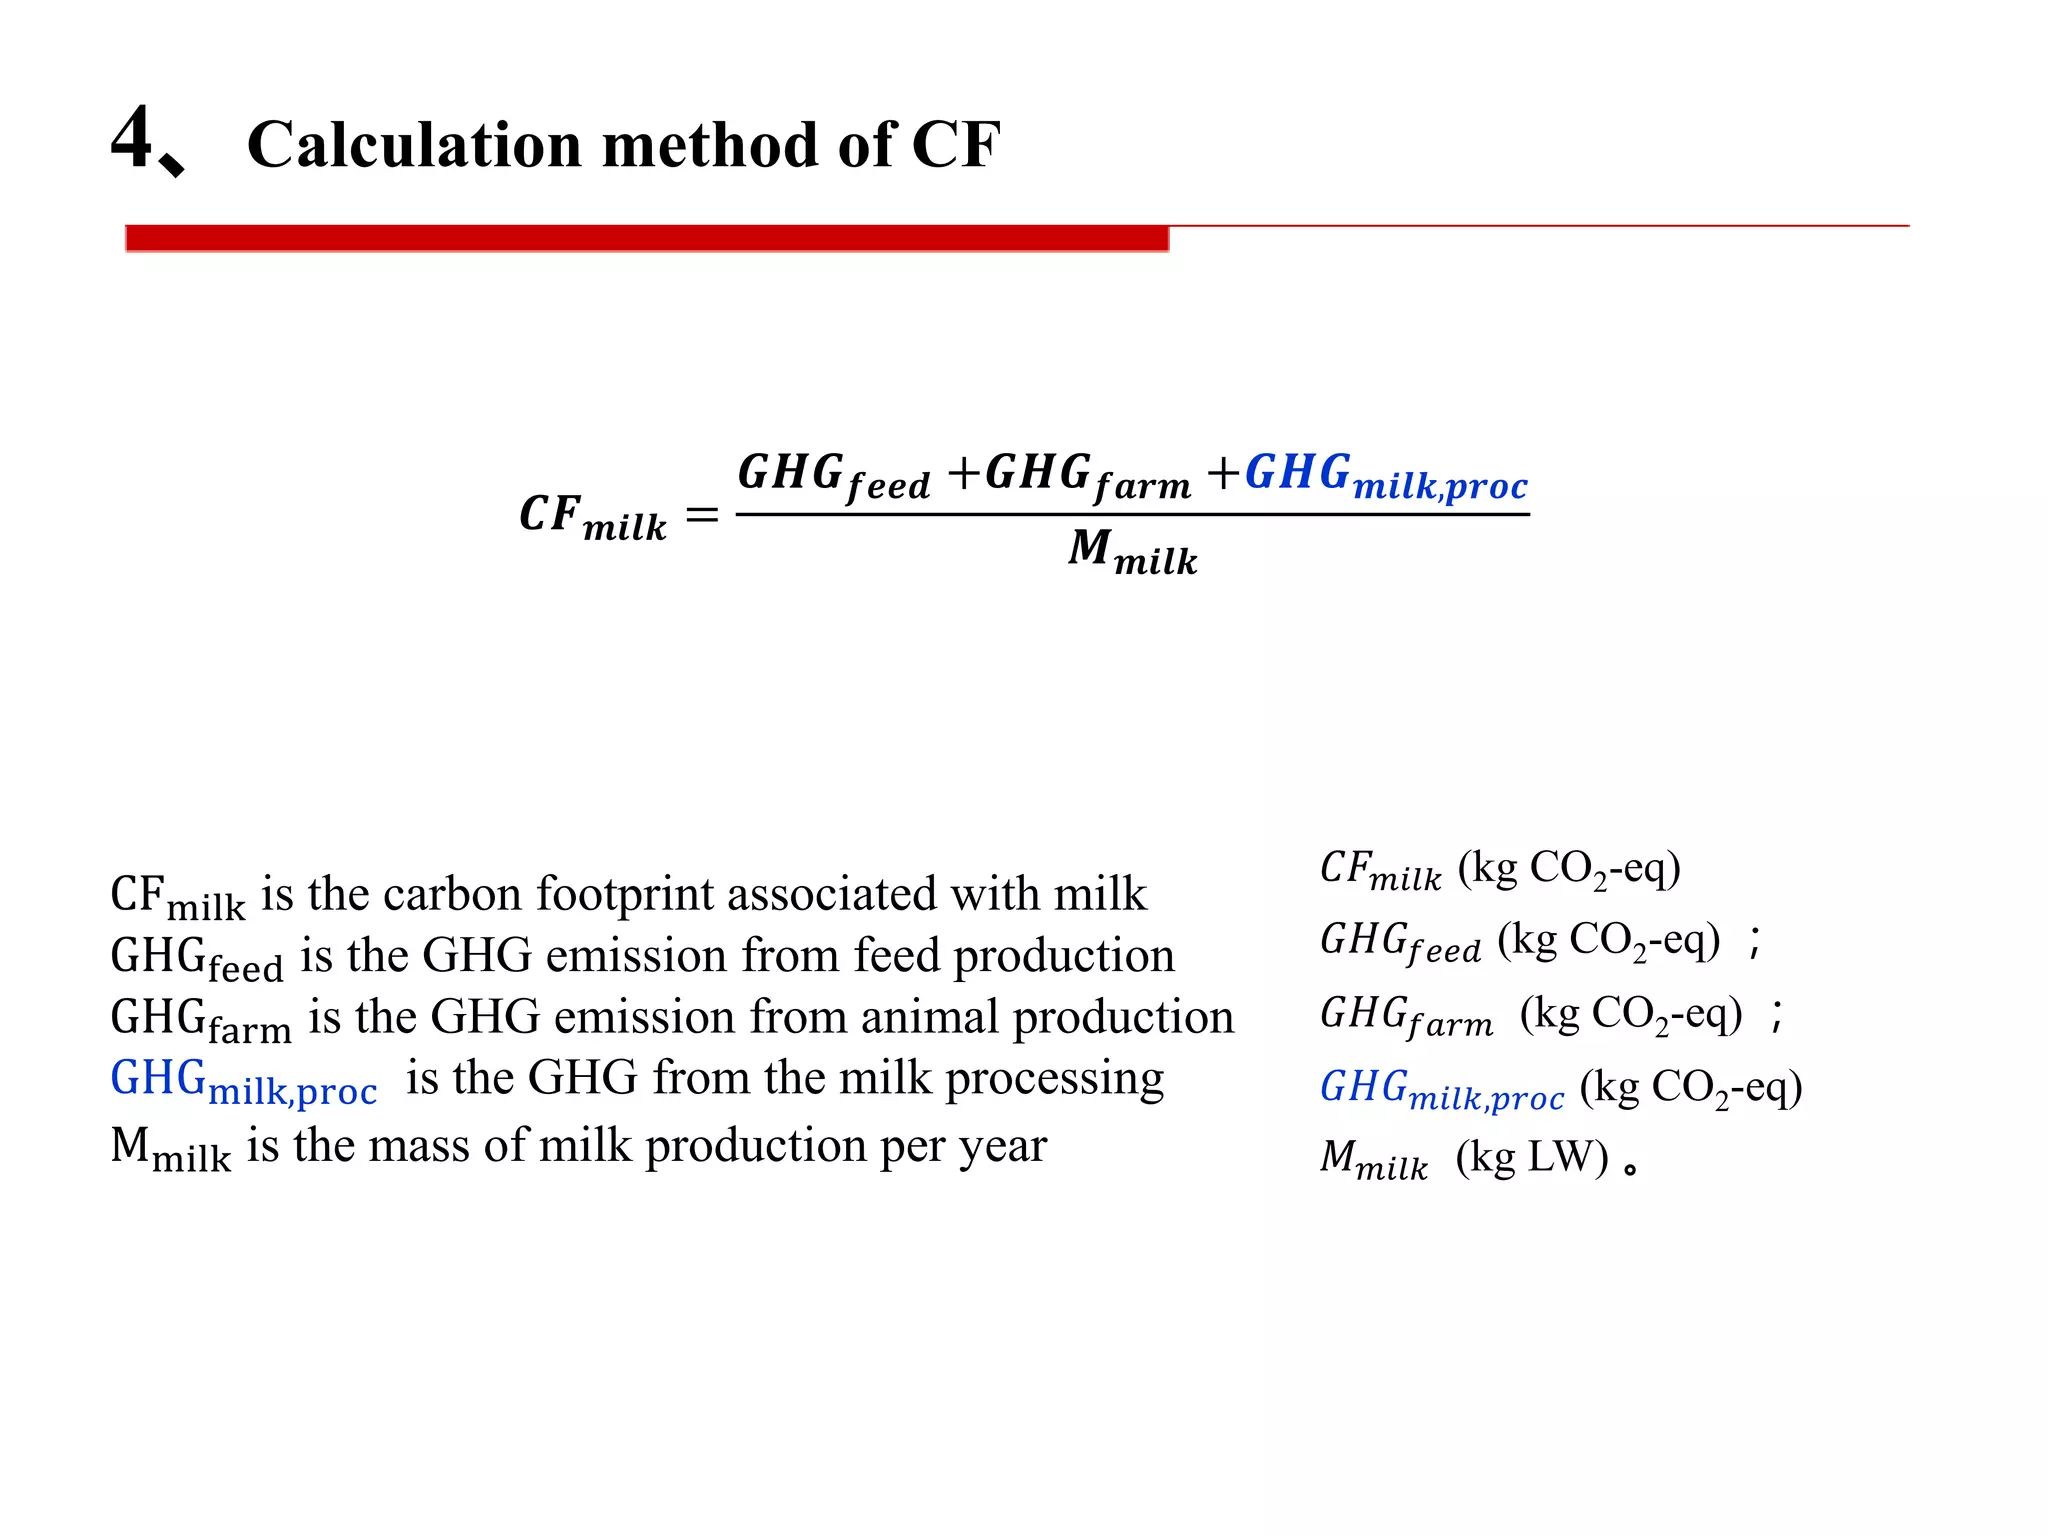
In-depth details on functional units, allocation methods, and calculating GHG emissions related to dairy operations.
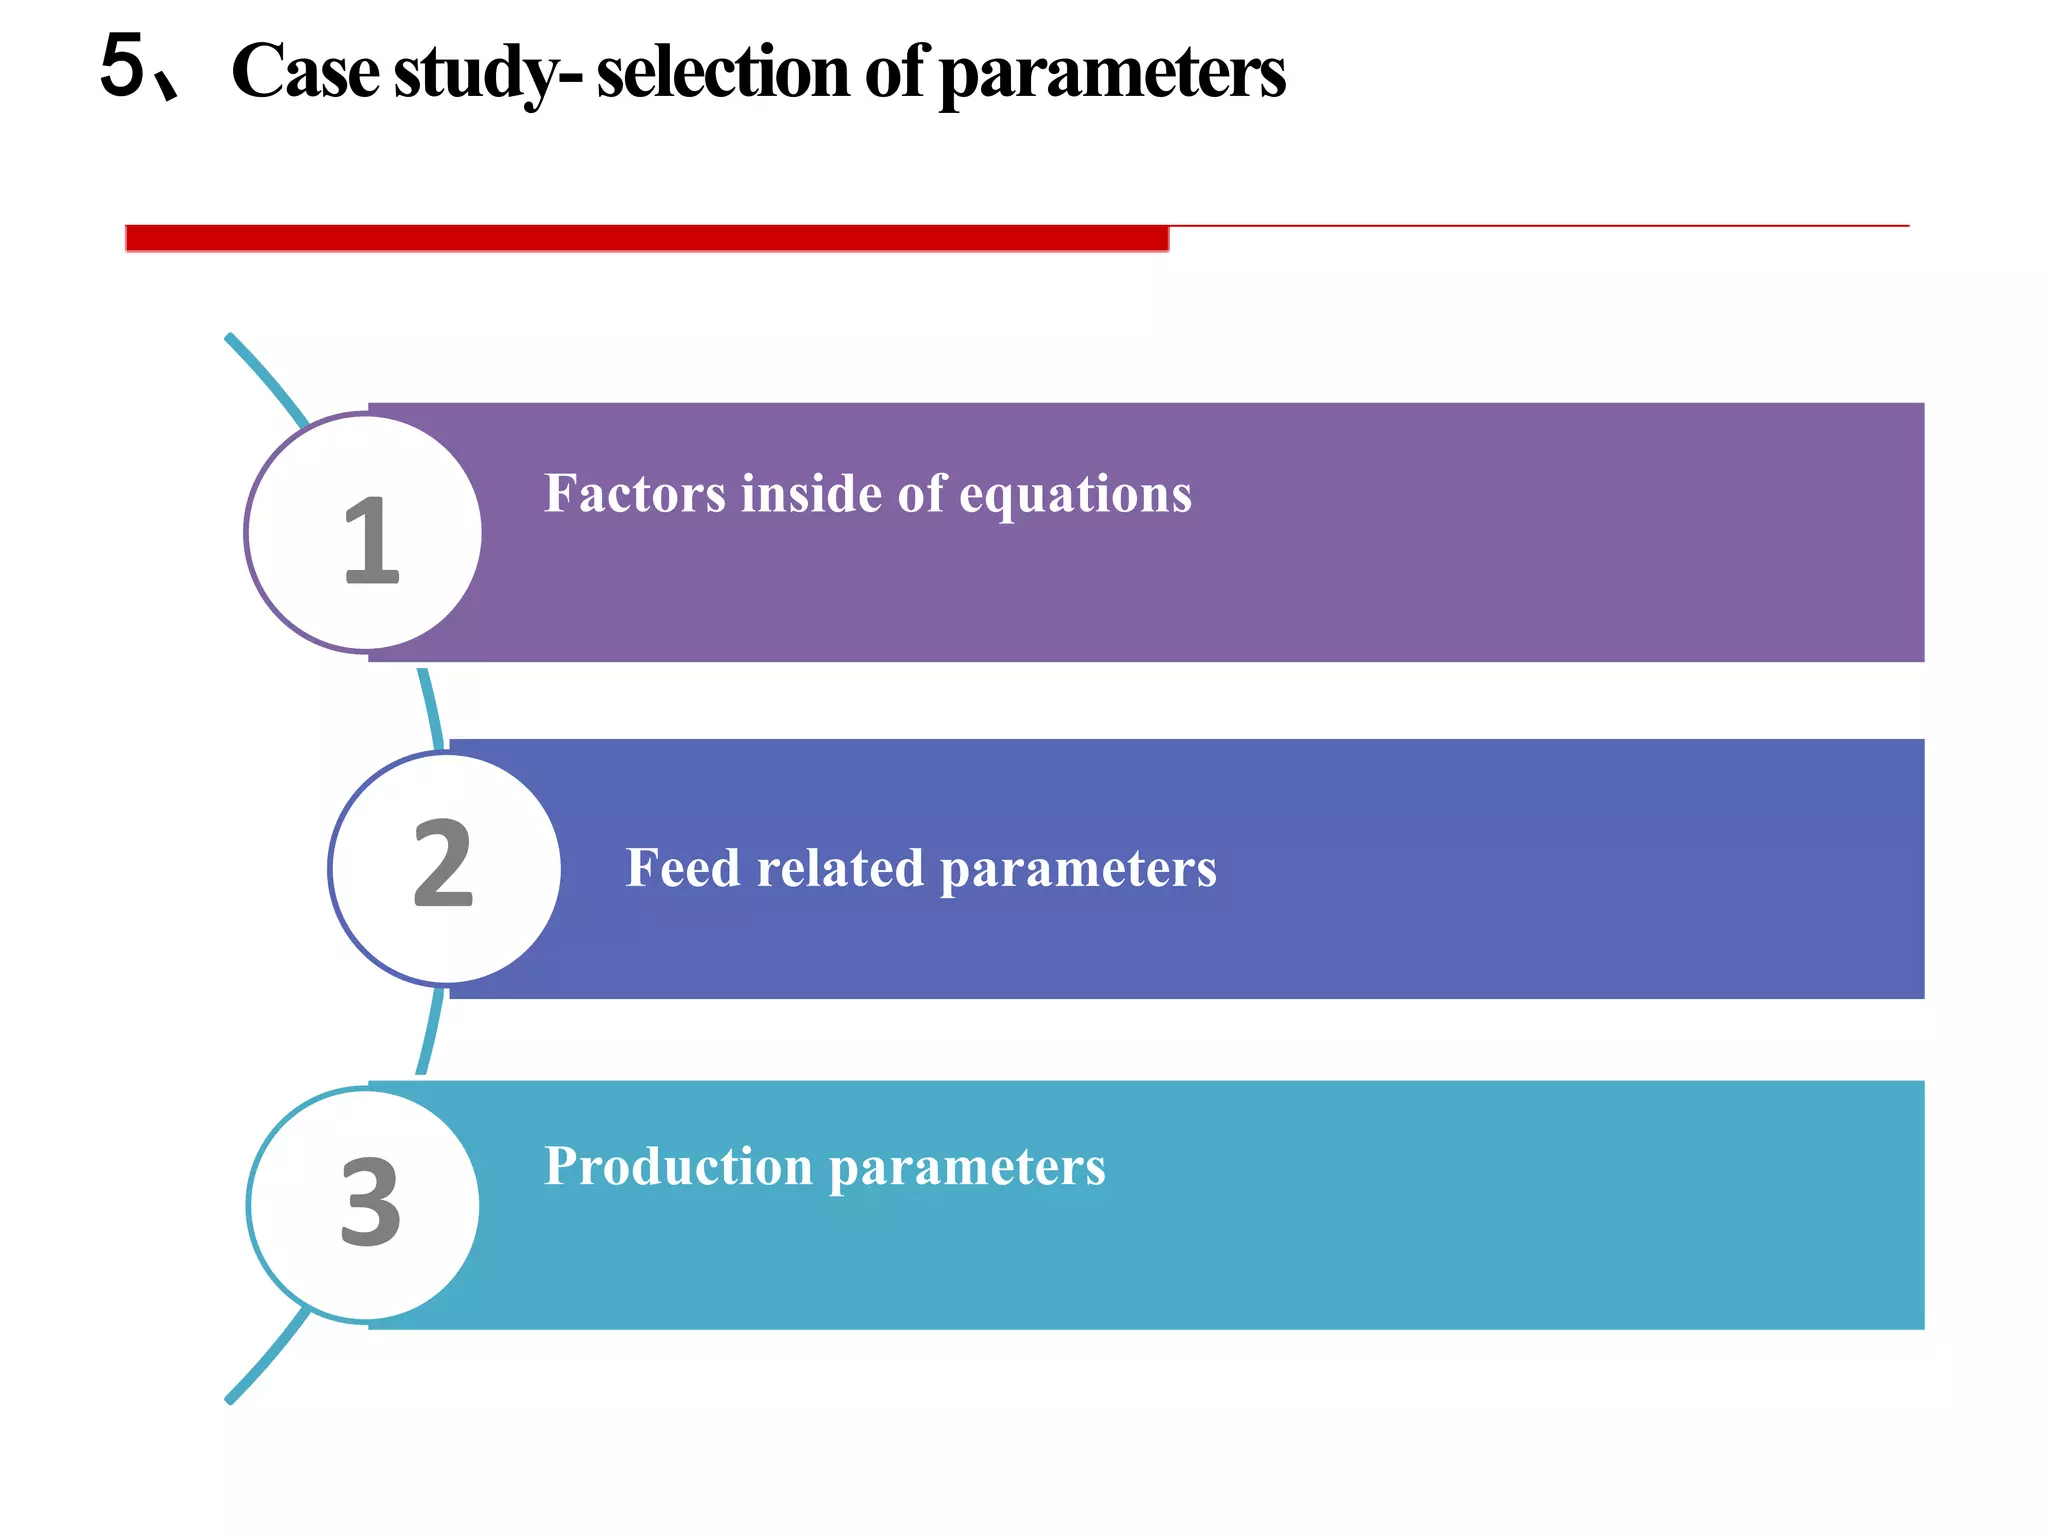
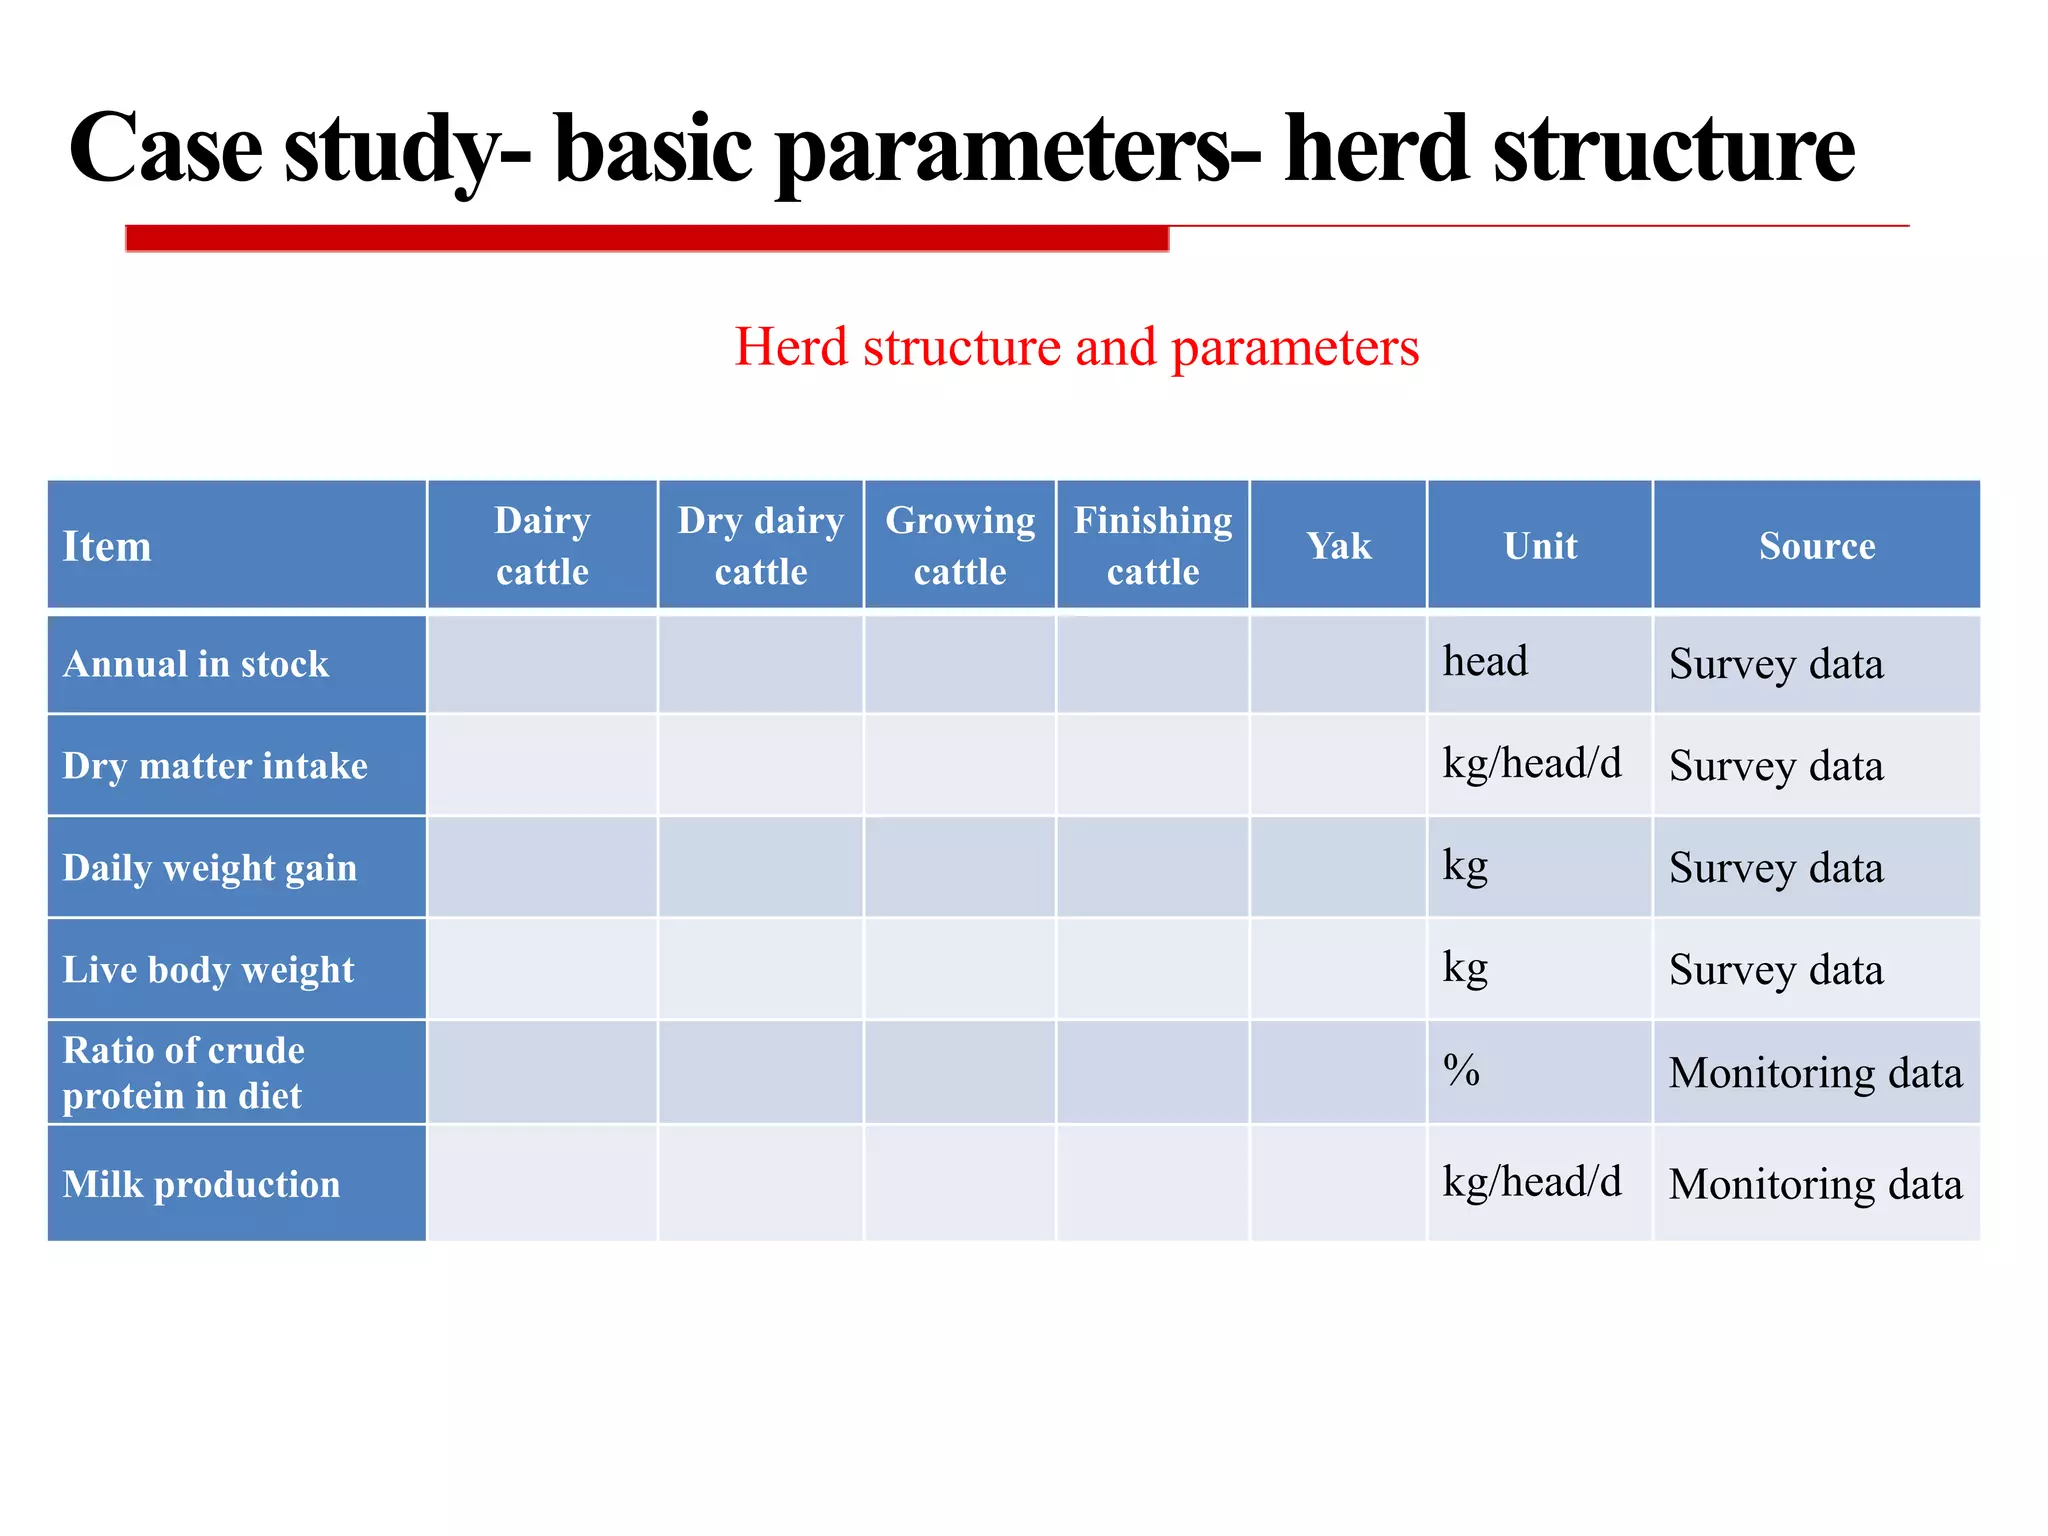
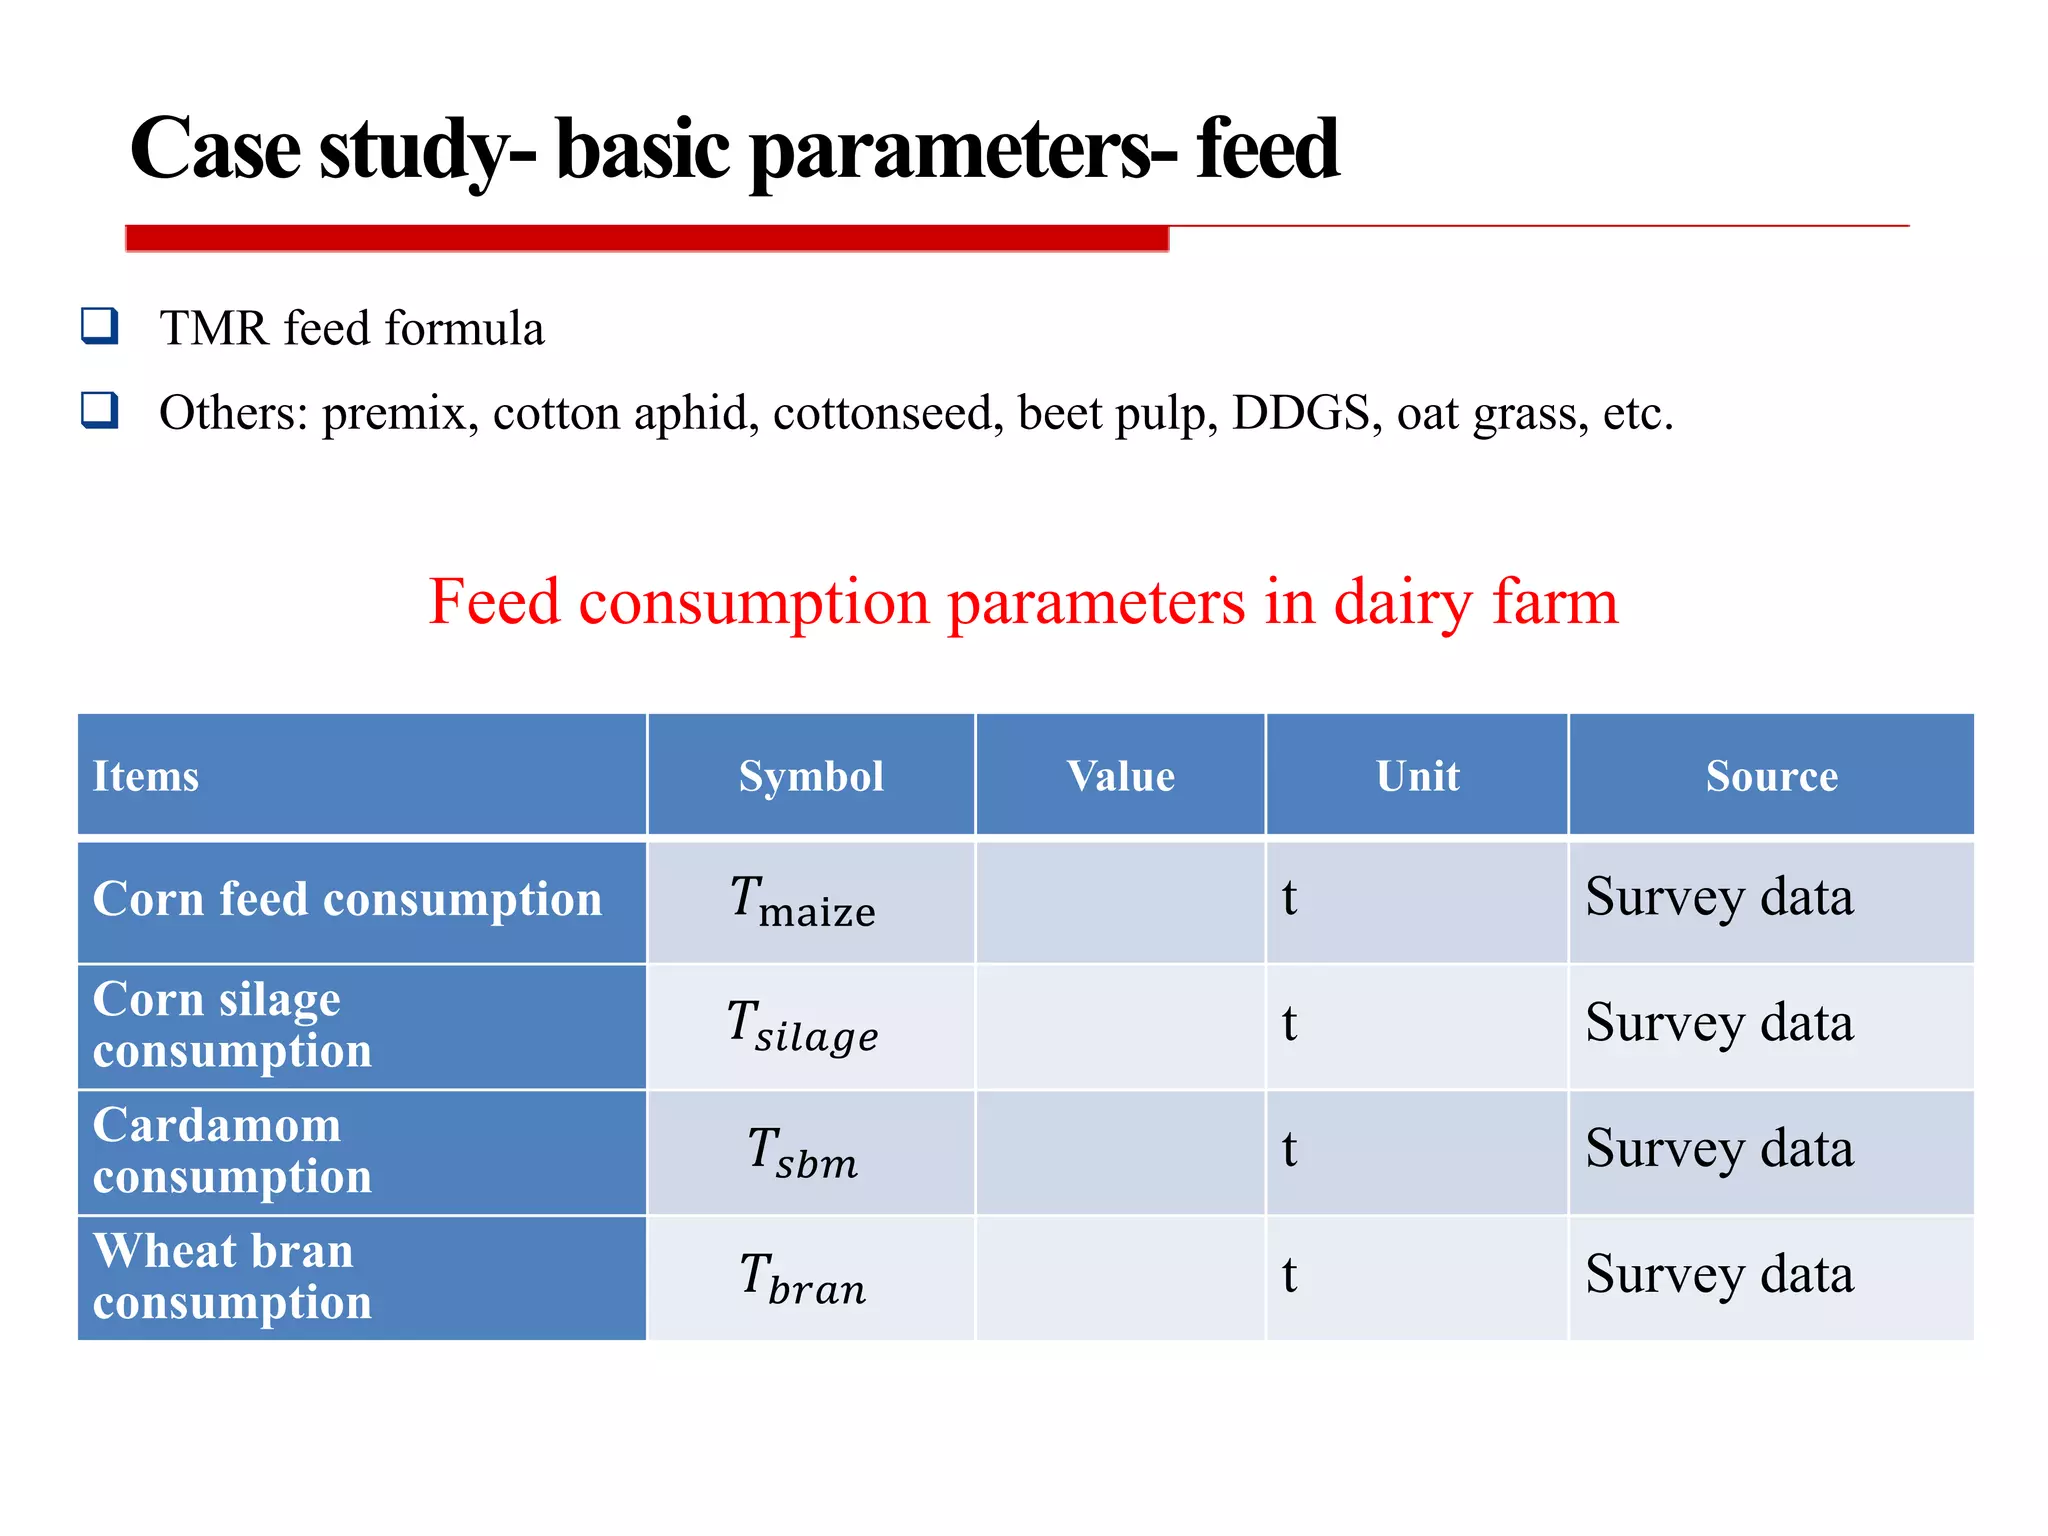
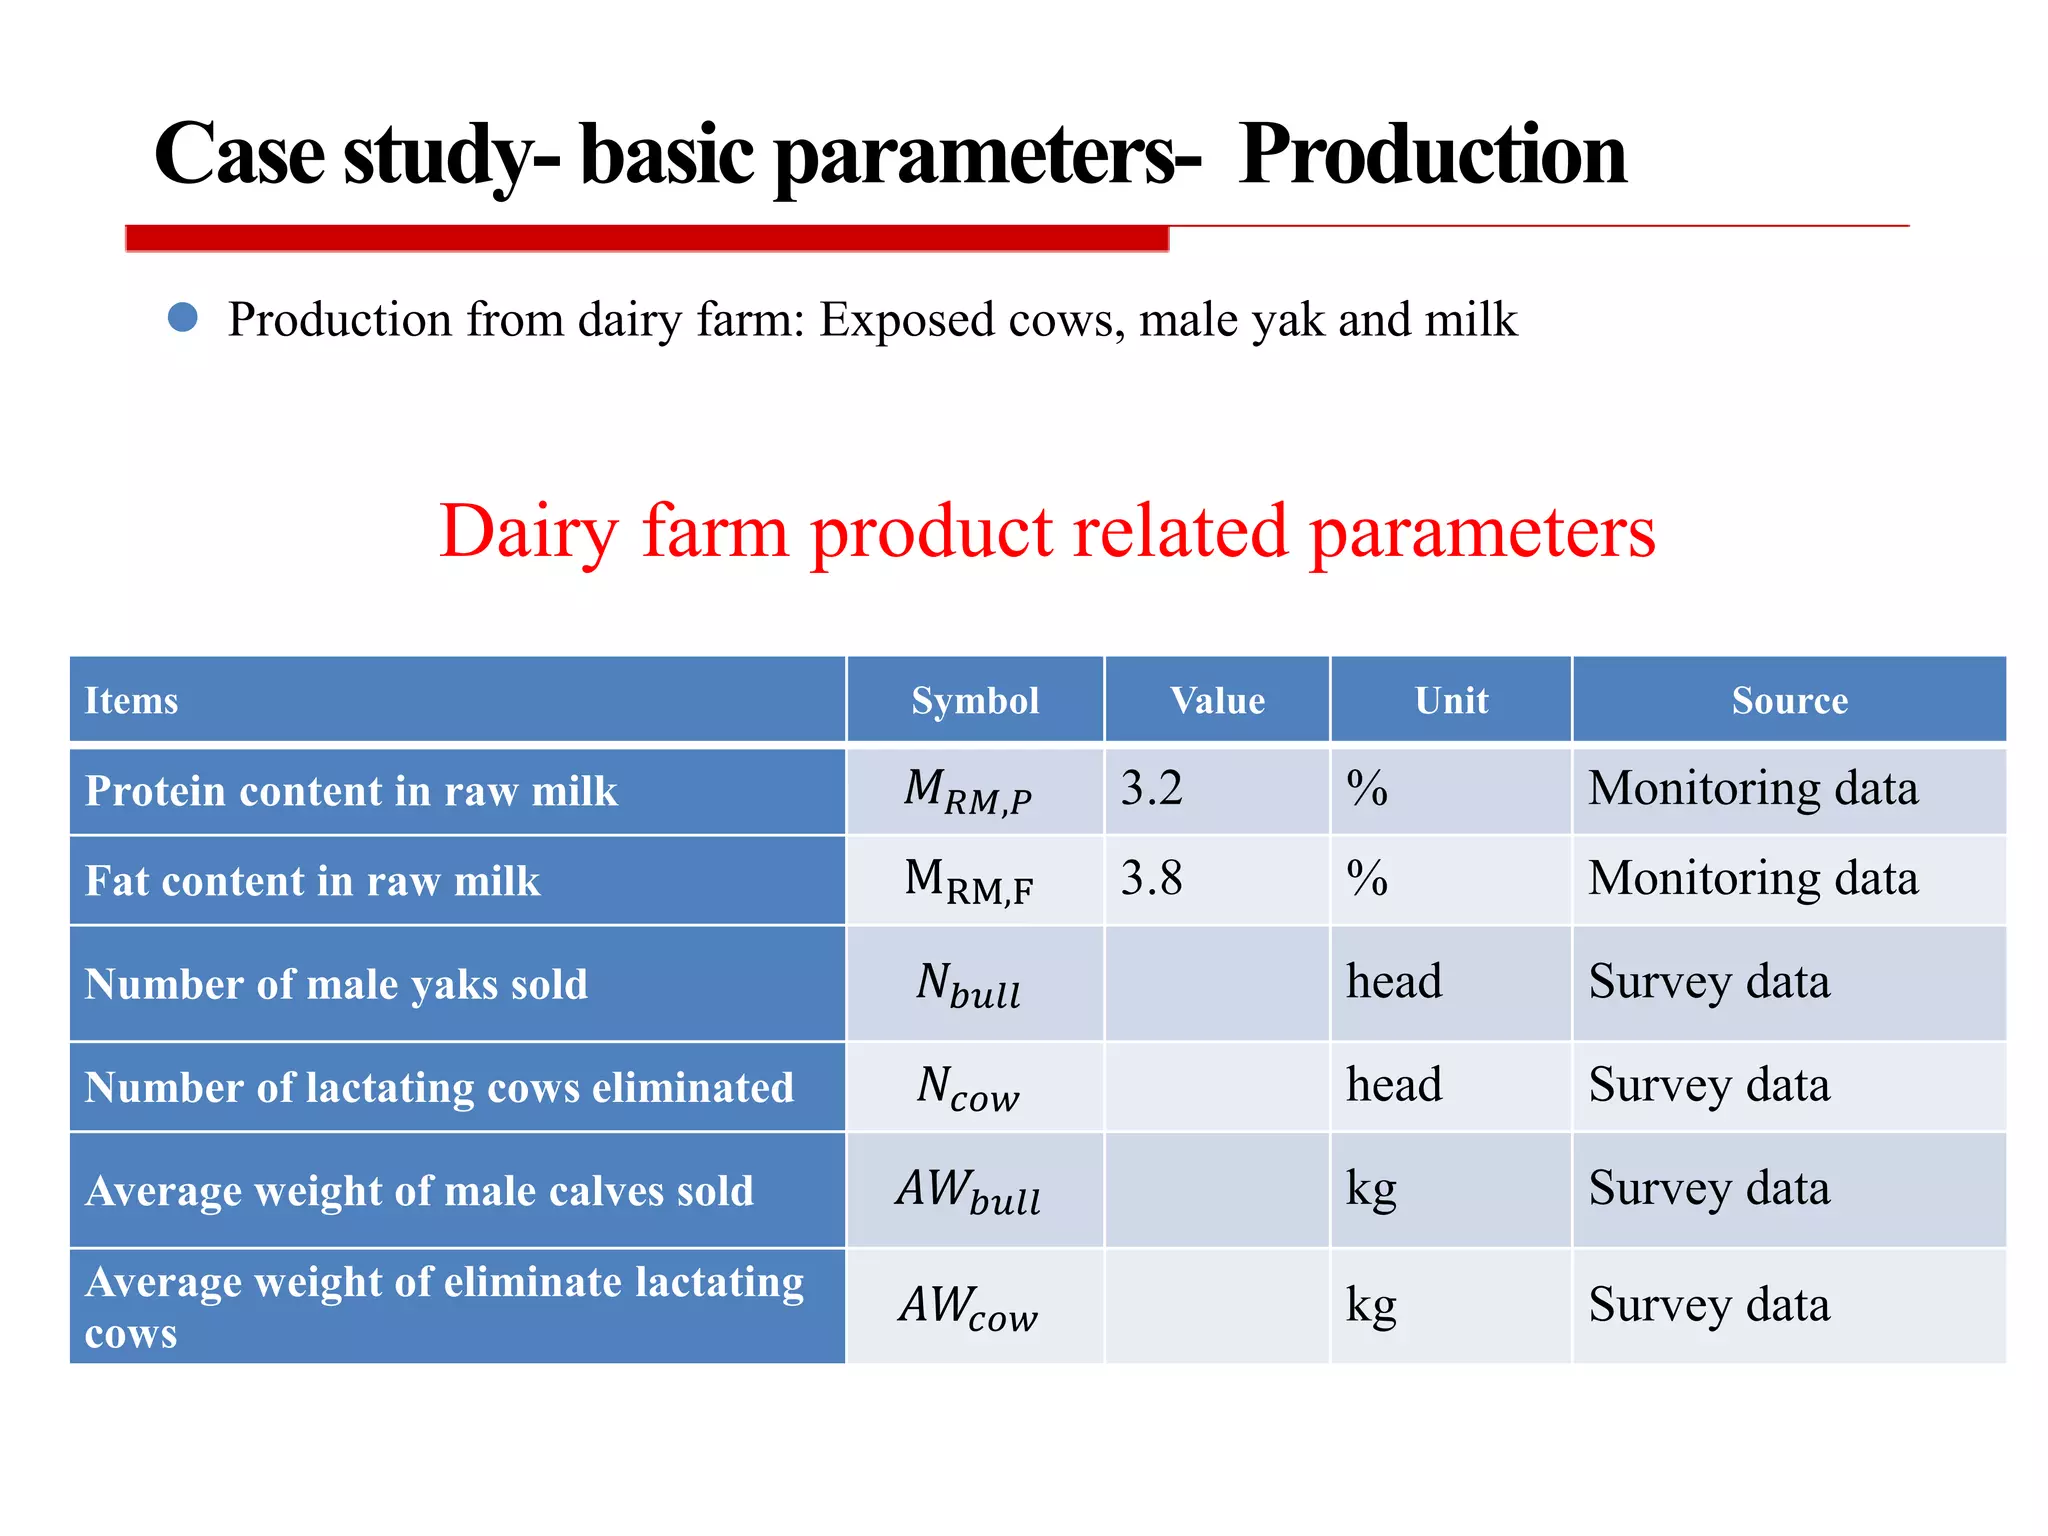
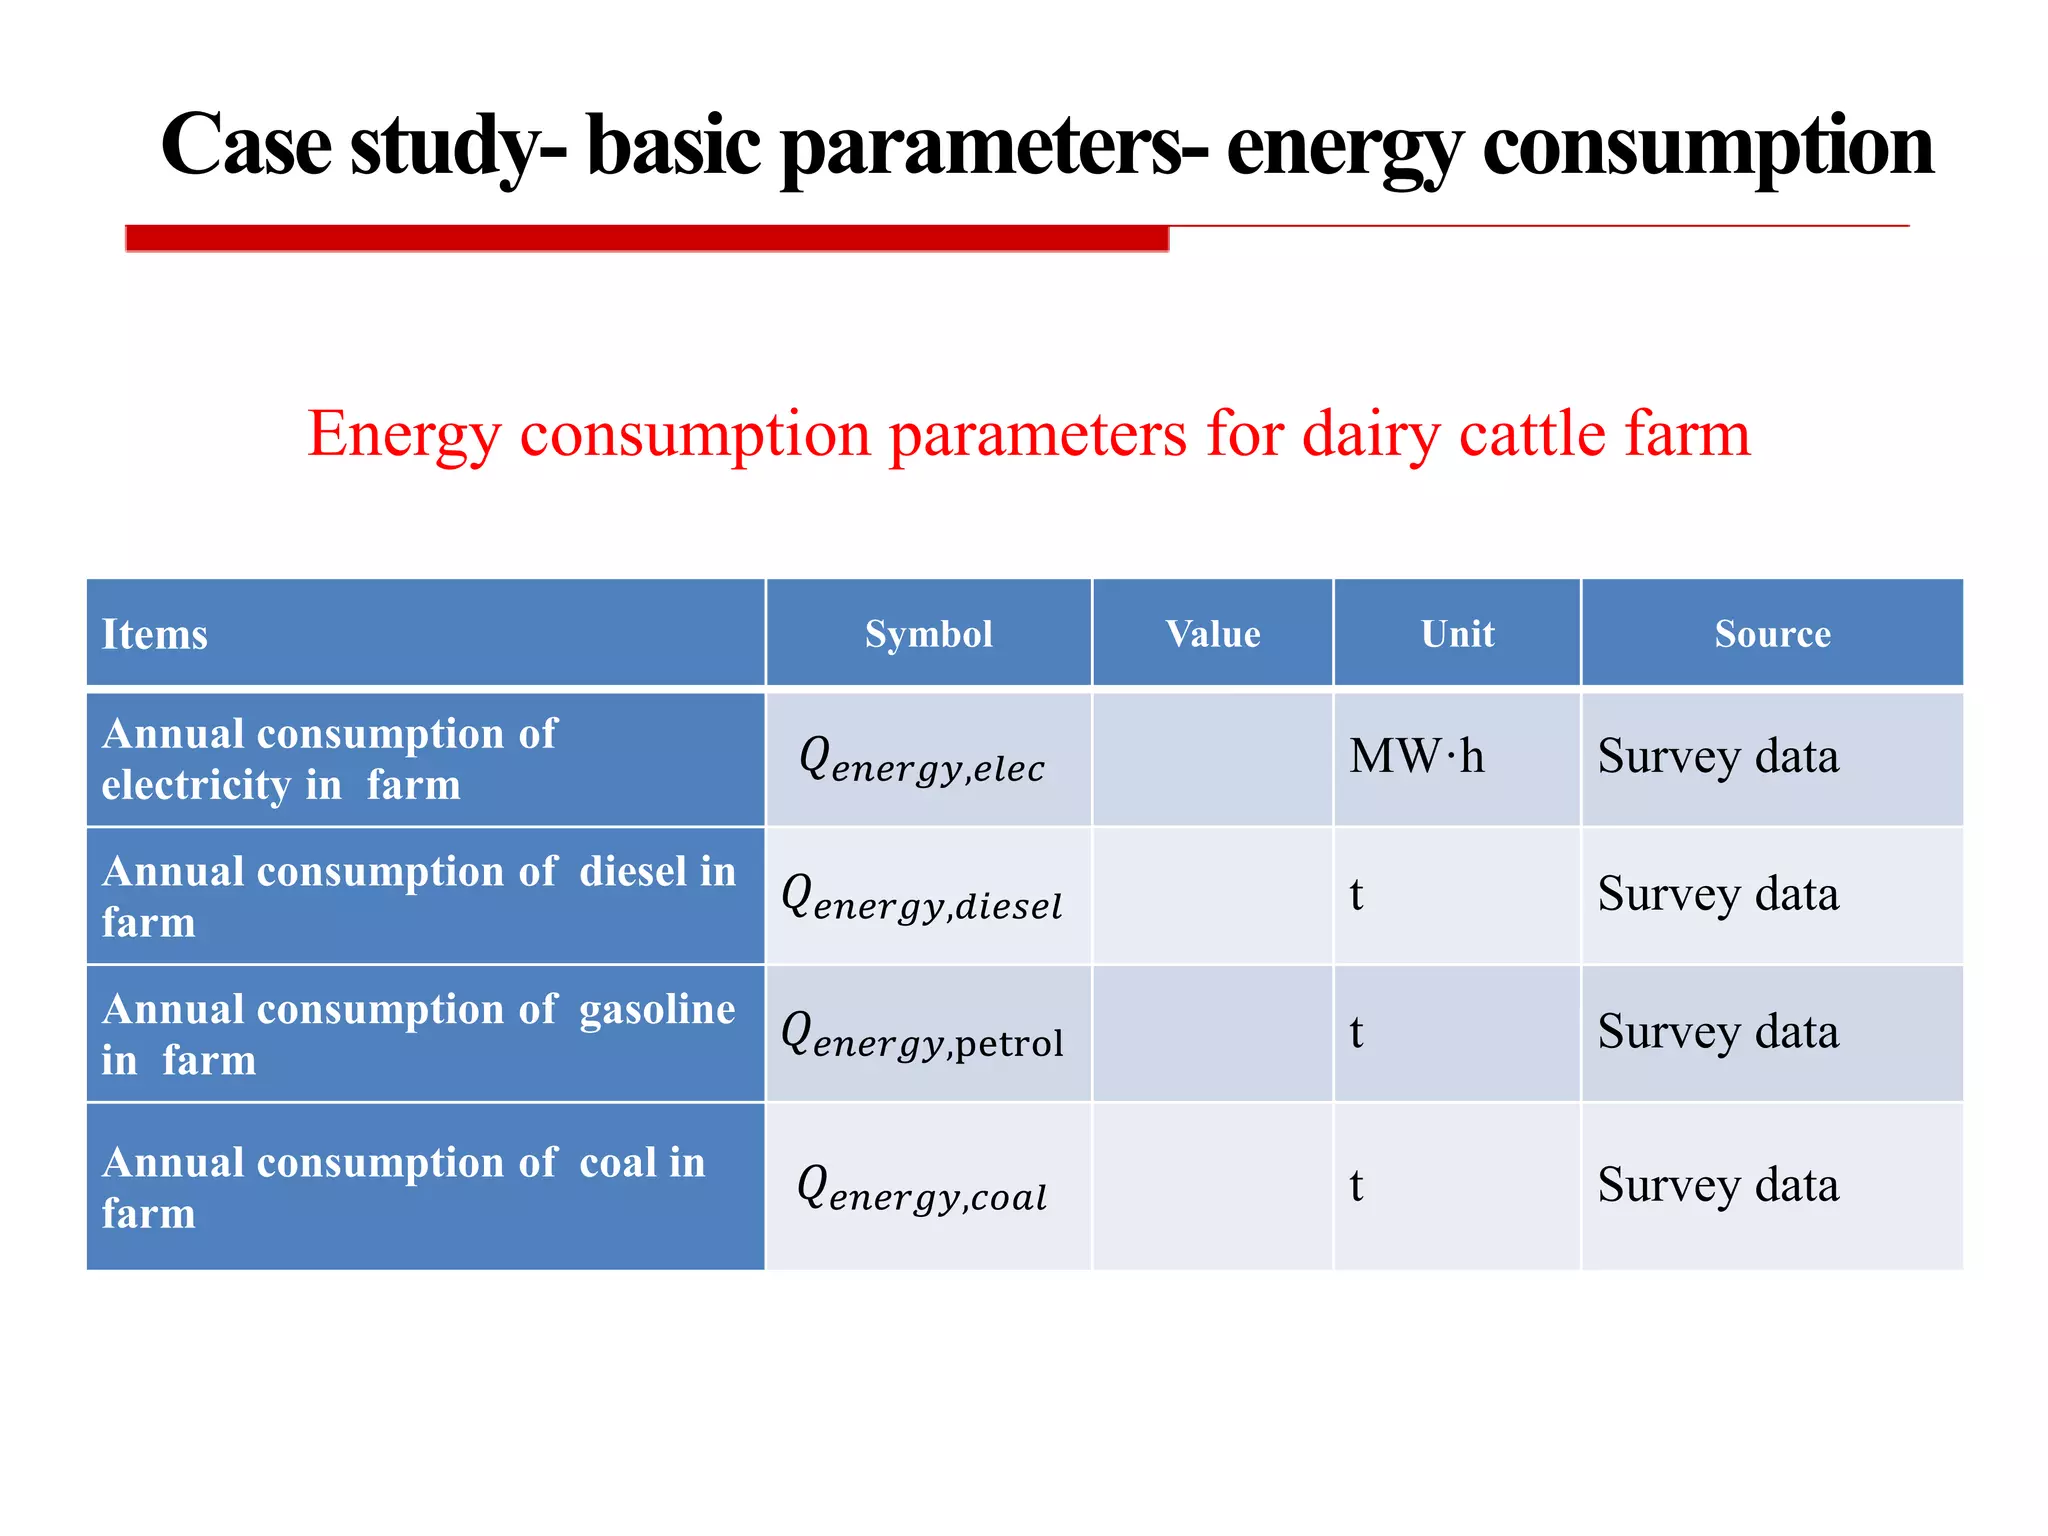
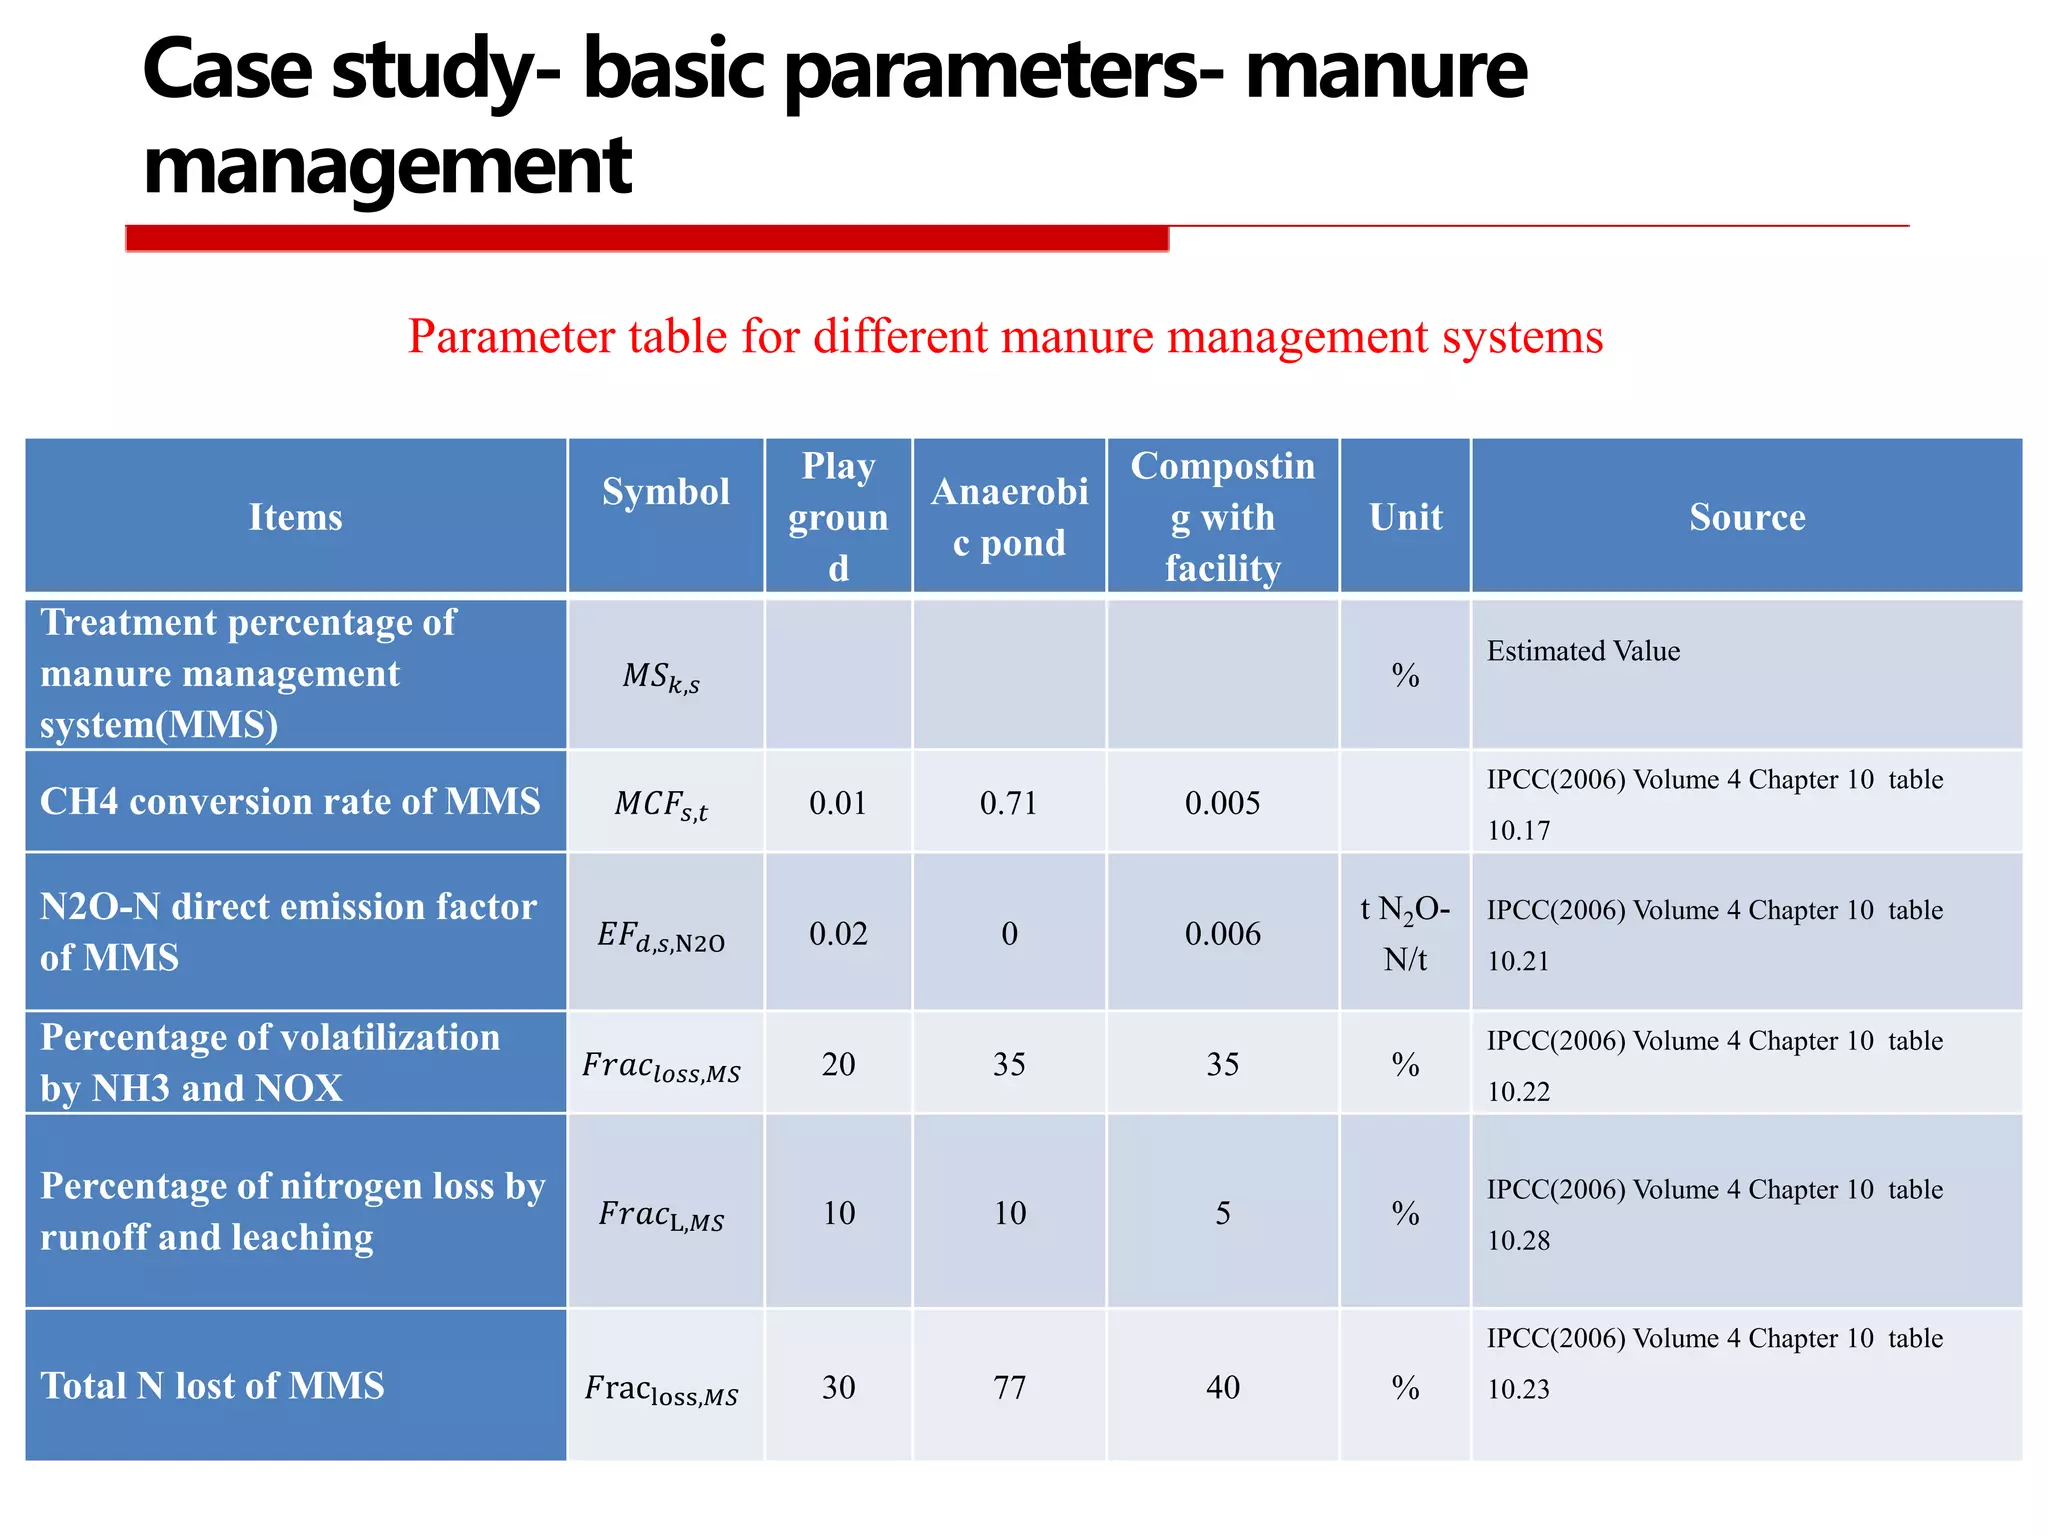
Parameters and data used in selecting case studies for different aspects of dairy production and management.
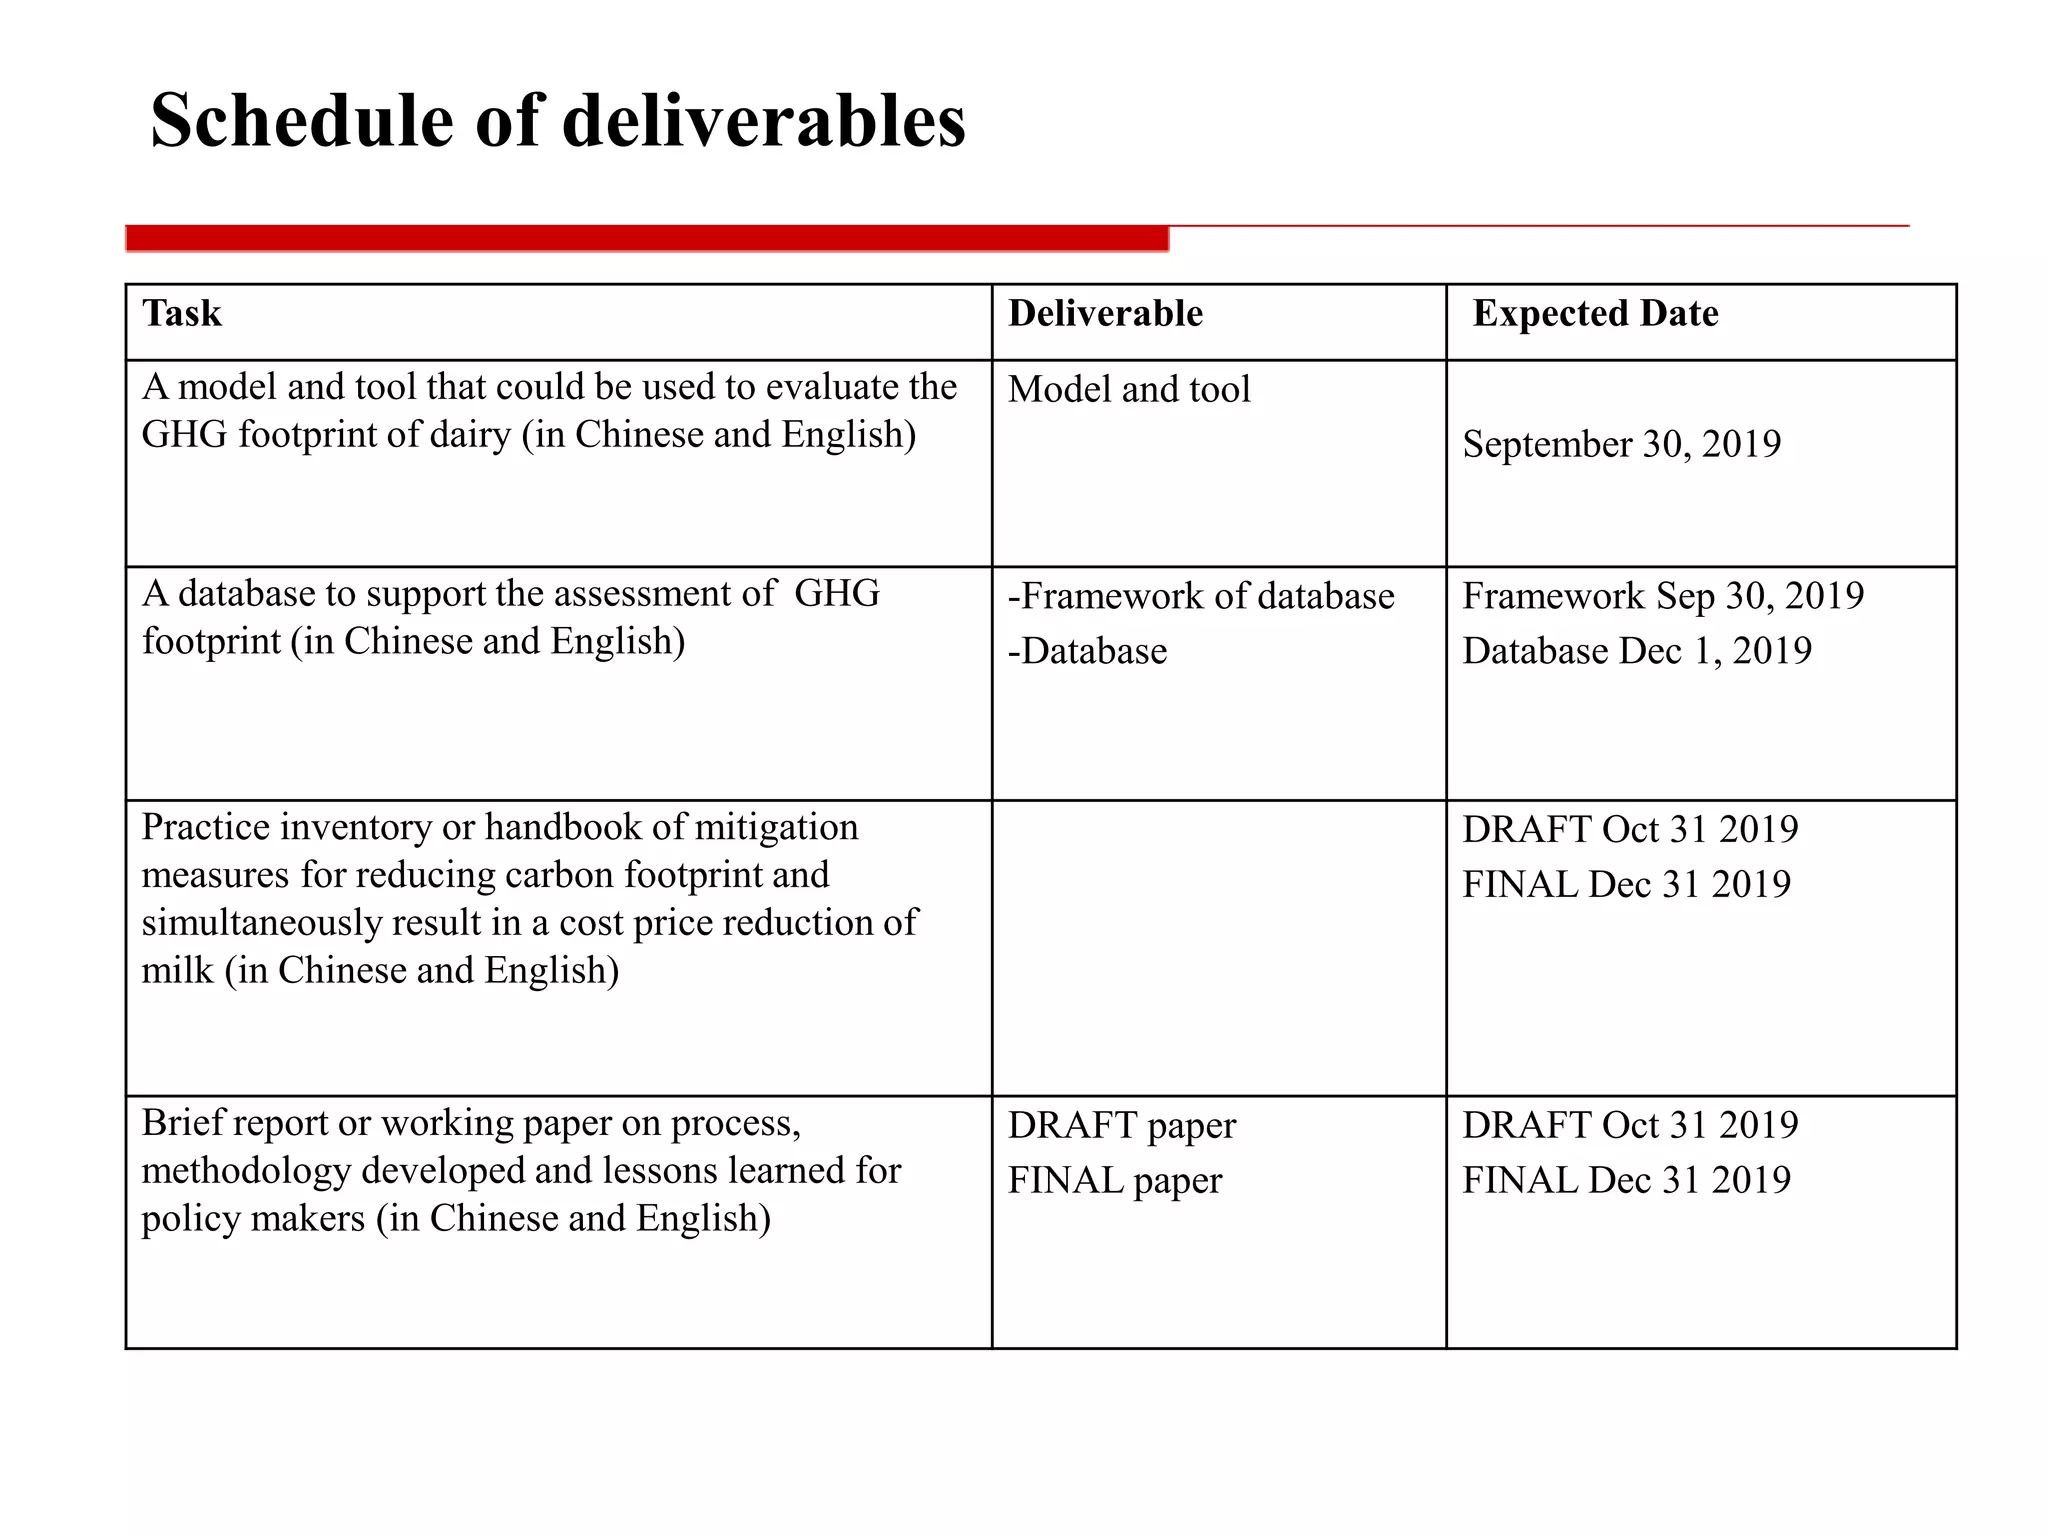
Timeline for deliverables including models, databases, and reports regarding GHG footprint assessments.
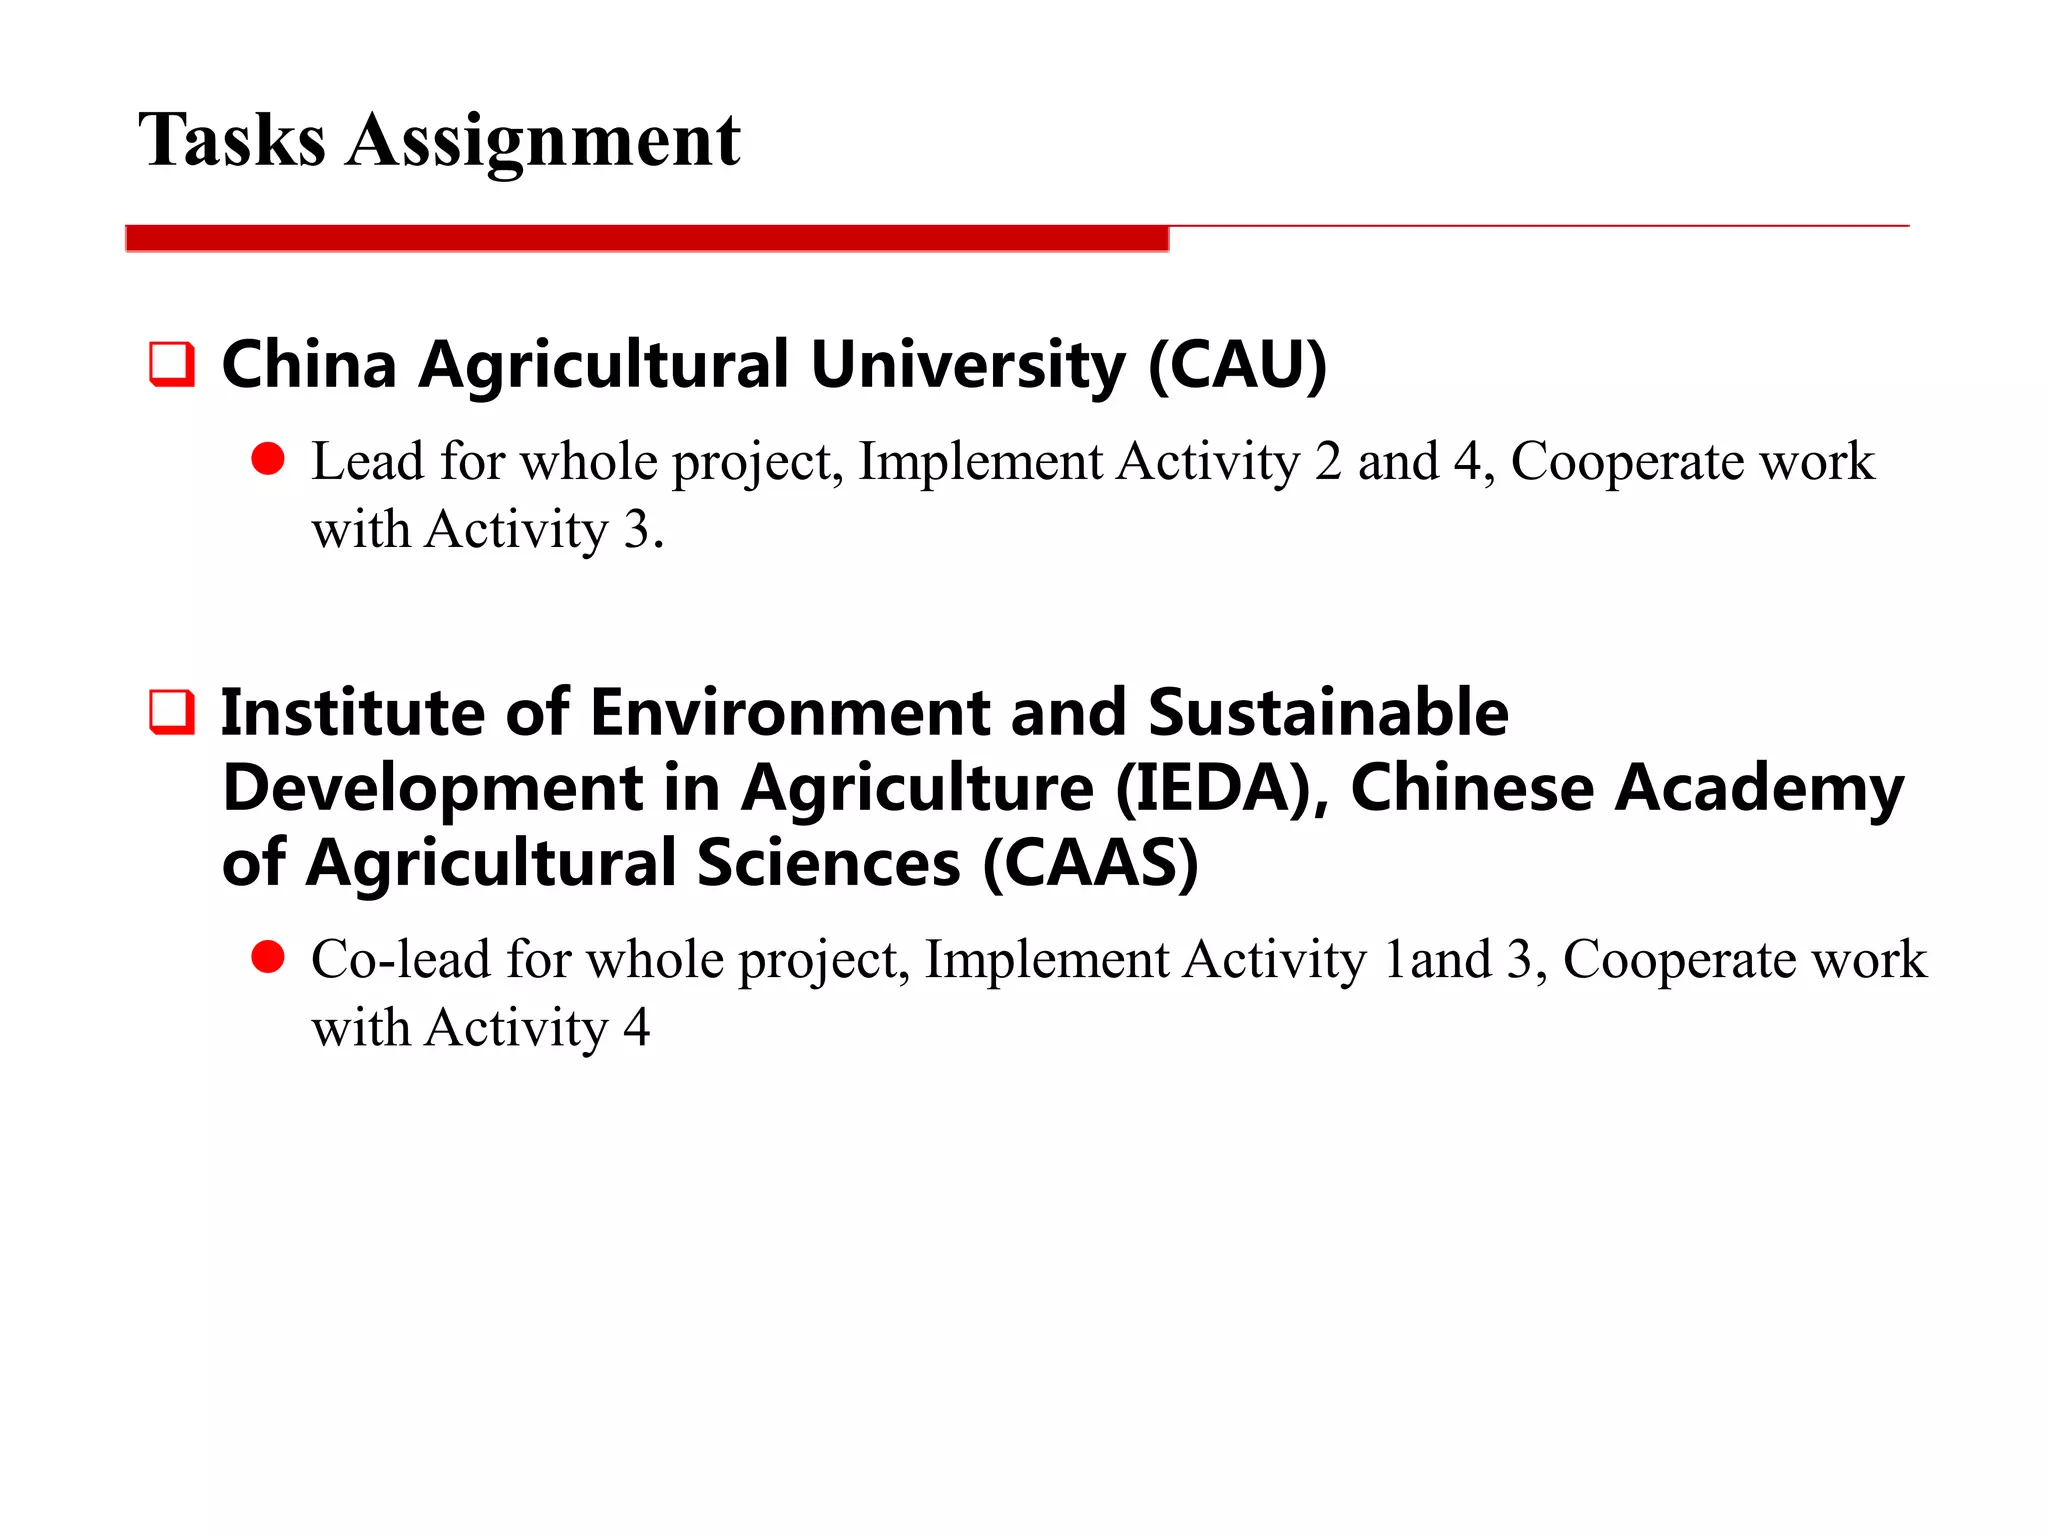
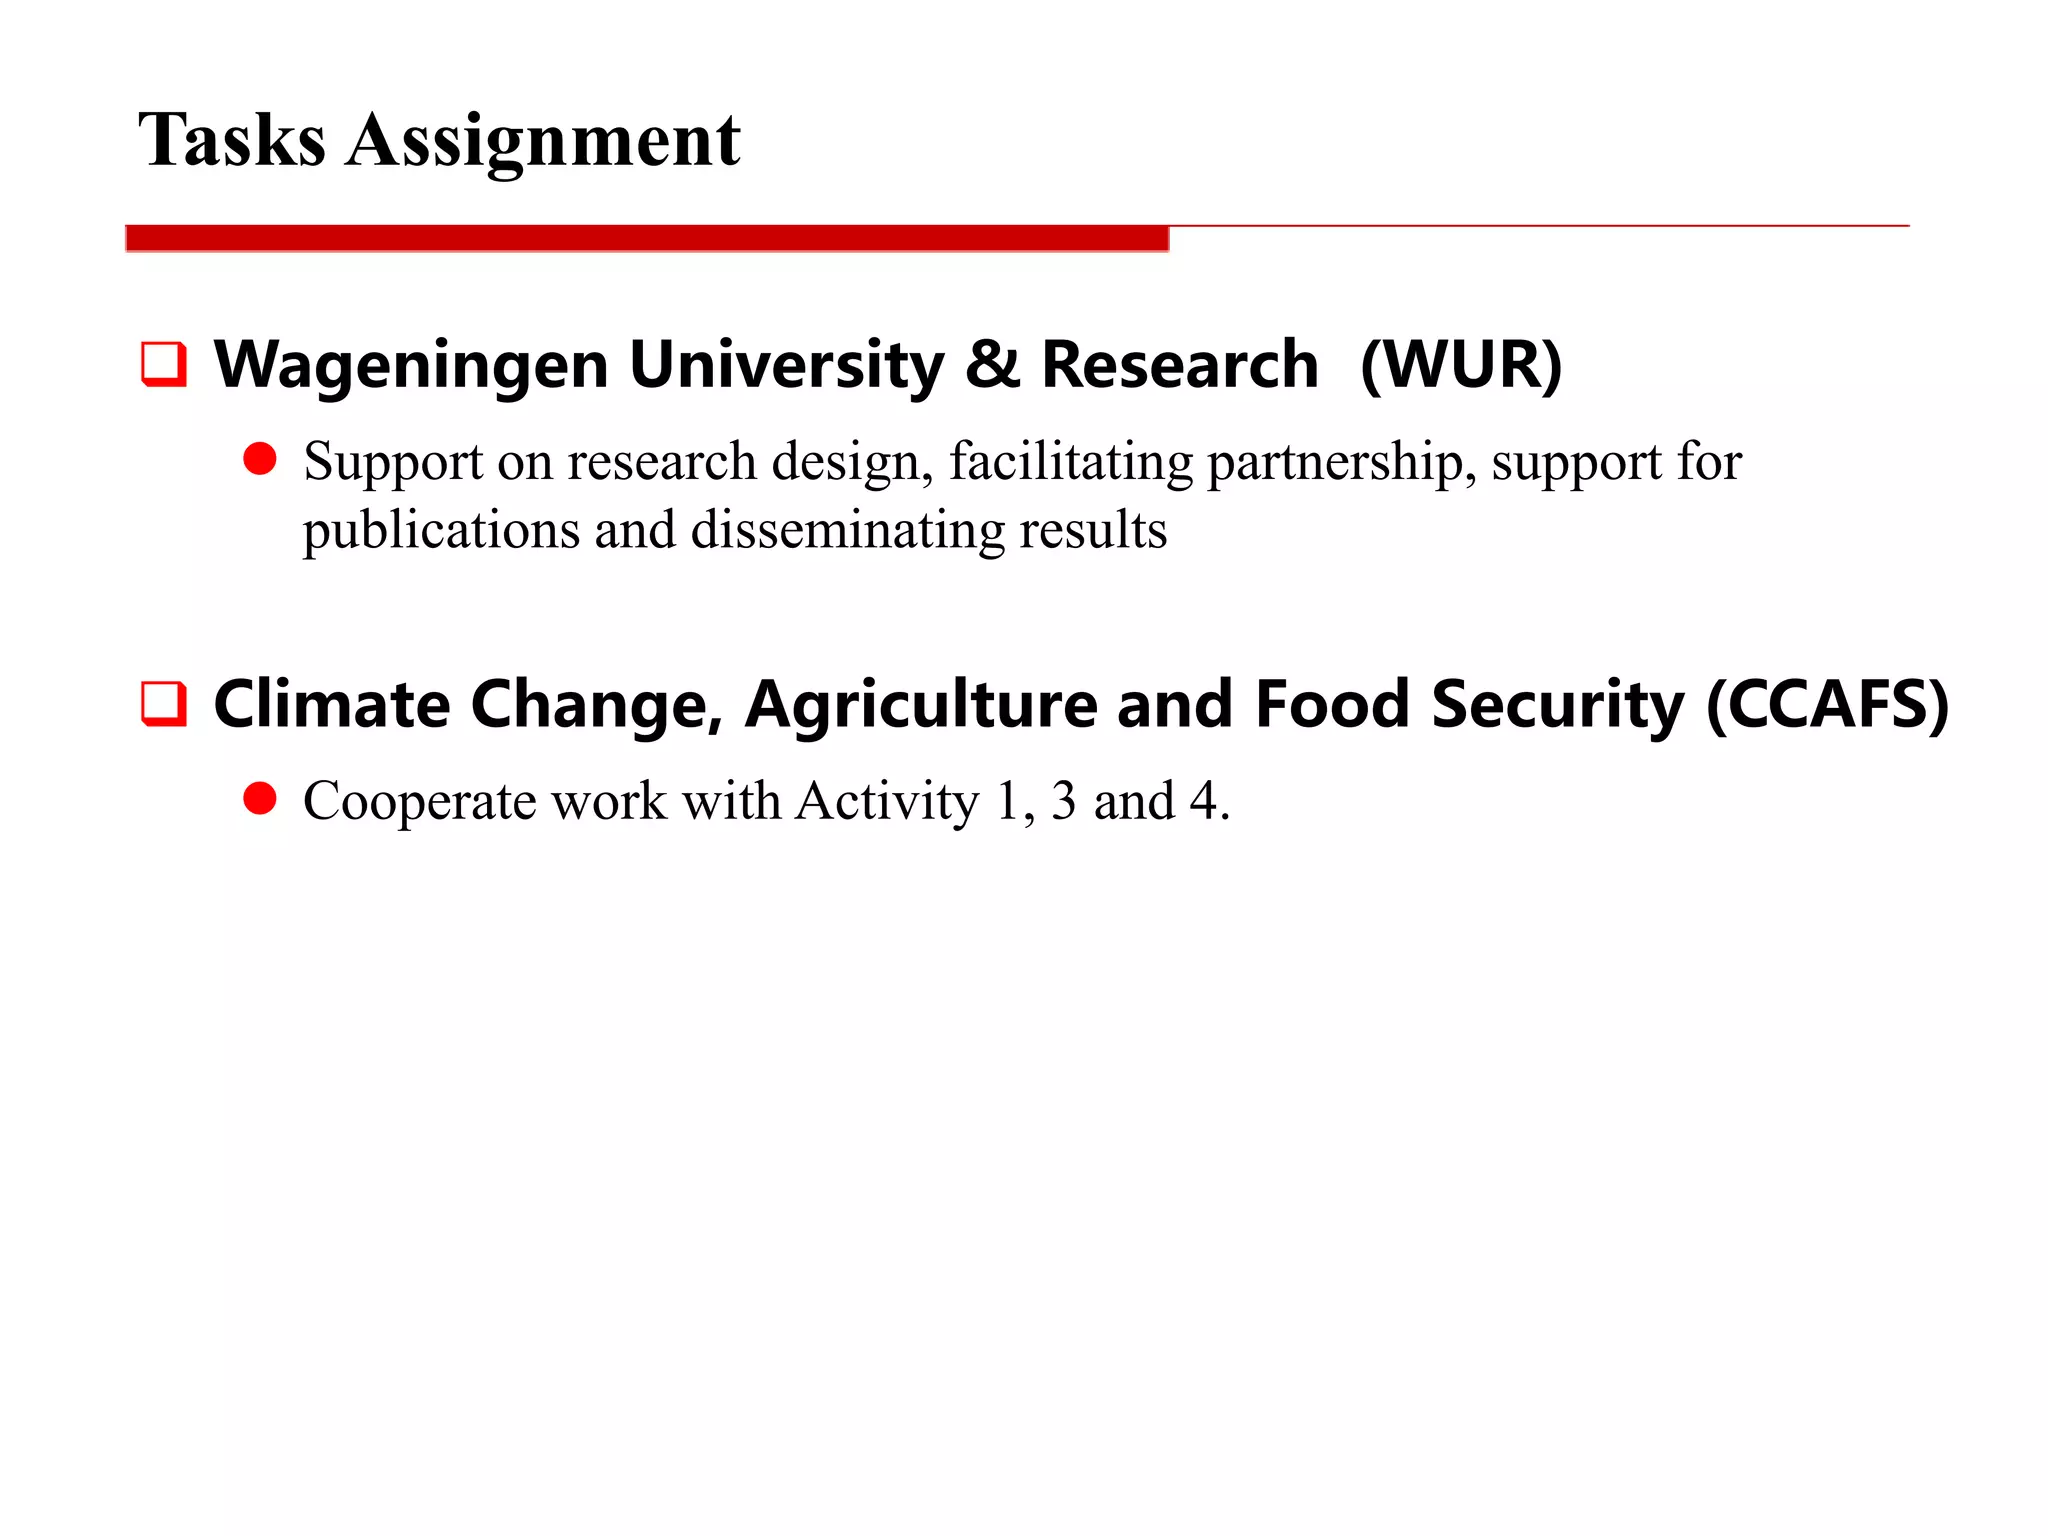
Outline of responsibilities for various institutions involved in the project on dairy GHG assessment.


