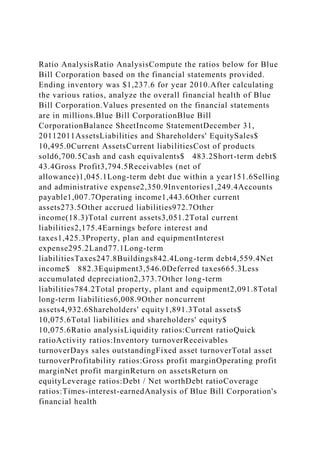
Ratio AnalysisRatio AnalysisCompute the ratios below for Blue Bill Corporation based on the financial statements provided. Ending inventory was $1,237.6 for year 2010.After calculating the various ratios, analyze the overall financial health of Blue Bill Corporation.Values presented on the financial statements are in millions.Blue Bill CorporationBlue Bill CorporationBalance SheetIncome StatementDecember 31, 20112011AssetsLiabilities and Shareholders' EquitySales$ 10,495.0Current AssetsCurrent liabilitiesCost of products sold6,700.5Cash and cash equivalents$ 483.2Short-term debt$ 43.4Gross Profit3,794.5Receivables (net of allowance)1,045.1Long-term debt due within a year151.6Selling and administrative expense2,350.9Inventories1,249.4Accounts payable1,007.7Operating income1,443.6Other current assets273.5Other accrued liabilities972.7Other income(18.3)Total current assets3,051.2Total current liabilities2,175.4Earnings before interest and taxes1,425.3Property, plan and equipmentInterest expense295.2Land77.1Long-term liabilitiesTaxes247.8Buildings842.4Long-term debt4,559.4Net income$ 882.3Equipment3,546.0Deferred taxes665.3Less accumulated depreciation2,373.7Other long-term liabilities784.2Total property, plant and equipment2,091.8Total long-term liabilities6,008.9Other noncurrent assets4,932.6Shareholders' equity1,891.3Total assets$ 10,075.6Total liabilities and shareholders' equity$ 10,075.6Ratio analysisLiquidity ratios:Current ratioQuick ratioActivity ratios:Inventory turnoverReceivables turnoverDays sales outstandingFixed asset turnoverTotal asset turnoverProfitability ratios:Gross profit marginOperating profit marginNet profit marginReturn on assetsReturn on equityLeverage ratios:Debt / Net worthDebt ratioCoverage ratios:Times-interest-earnedAnalysis of Blue Bill Corporation's financial health
...
Welcome to TechSoup New Member Orientation and Q&A (May 2024).pdf
Ratio AnalysisRatio AnalysisCompute the ratios below for Blue Bill.docx
1. Ratio AnalysisRatio AnalysisCompute the ratios below for Blue
Bill Corporation based on the financial statements provided.
Ending inventory was $1,237.6 for year 2010.After calculating
the various ratios, analyze the overall financial health of Blue
Bill Corporation.Values presented on the financial statements
are in millions.Blue Bill CorporationBlue Bill
CorporationBalance SheetIncome StatementDecember 31,
20112011AssetsLiabilities and Shareholders' EquitySales$
10,495.0Current AssetsCurrent liabilitiesCost of products
sold6,700.5Cash and cash equivalents$ 483.2Short-term debt$
43.4Gross Profit3,794.5Receivables (net of
allowance)1,045.1Long-term debt due within a year151.6Selling
and administrative expense2,350.9Inventories1,249.4Accounts
payable1,007.7Operating income1,443.6Other current
assets273.5Other accrued liabilities972.7Other
income(18.3)Total current assets3,051.2Total current
liabilities2,175.4Earnings before interest and
taxes1,425.3Property, plan and equipmentInterest
expense295.2Land77.1Long-term
liabilitiesTaxes247.8Buildings842.4Long-term debt4,559.4Net
income$ 882.3Equipment3,546.0Deferred taxes665.3Less
accumulated depreciation2,373.7Other long-term
liabilities784.2Total property, plant and equipment2,091.8Total
long-term liabilities6,008.9Other noncurrent
assets4,932.6Shareholders' equity1,891.3Total assets$
10,075.6Total liabilities and shareholders' equity$
10,075.6Ratio analysisLiquidity ratios:Current ratioQuick
ratioActivity ratios:Inventory turnoverReceivables
turnoverDays sales outstandingFixed asset turnoverTotal asset
turnoverProfitability ratios:Gross profit marginOperating profit
marginNet profit marginReturn on assetsReturn on
equityLeverage ratios:Debt / Net worthDebt ratioCoverage
ratios:Times-interest-earnedAnalysis of Blue Bill Corporation's
financial health