The study investigates the risk factors associated with enamel fluorosis in two groups of children from nonfluoridated and optimally fluoridated communities. Findings reveal that excessive fluoride supplementation and inappropriate toothpaste use during early childhood significantly contribute to enamel fluorosis rates. The results emphasize the need for dental professionals to guide parents on proper fluoride usage to reduce the risk of enamel fluorosis while maintaining dental health.

![paste has been formulated for
use by infants and toddlers, and
none has been tested.10,17
Furthermore, using no tooth-
paste or using only nonfluori-
dated toothpaste (such as Baby
Orajel Tooth and Gum Cleanser
[Church and Dwight, Princeton,
N.J.]) is regarded as the stand-
ard of care for children of this
age. There is nothing in the
portfolio of research supported
by the National Institute of
C O M M E N T A R Y G U E S T E D I T O R I A L
630 JADA, Vol. 140 http://jada.ada.org June 2009
Copyright © 2009 American Dental Association. All rights
reserved. Reprinted by permission.
Dental and Craniofacial
Research or sponsored by the
Centers for Disease Control and
Prevention on this topic; we do
not know what investigations, if
any, manufacturers are
sponsoring.
Formally testing the benefits
and secondary effects of the use
of 1,100-ppm fluoridated tooth-
paste with infants and toddlers](https://image.slidesharecdn.com/1-httpfluoridealert-221223181504-93ad0f66/85/1-httpfluoridealert-orgresearchersstateskentucky2-docx-68-320.jpg)
![in the United States who are at
high risk of developing caries—
and changing instructions for
use on toothpaste labels, if ap-
propriate—can benefit many
children at little cost relative to
current investments in dental
research and profits from oral
care products. Parents and pro-
fessionals in poor and minority
communities in the United
States have told us in the
course of our research that they
would support a randomized
placebo-controlled study of a
special fluoridated toothpaste
for infants and toddlers. Thus,
we conclude on the basis of ex-
isting science and the rising lev-
els of dental caries that clinical
trials of fluoridated toothpaste
for very young children in the
United States are overdue. ■
Dr. Milgrom is a professor, Department of
Dental Public Health Sciences, and director,
Northwest Center to Reduce Oral Health
Disparities, University of Washington, Box
357475, Seattle, Wash. 98195-7475, e-mail
“[email protected]”. Address reprint re-
quests to Dr. Milgrom.
Dr. Huebner is an associate professor,
Department of Health Services, University of
Washington, Seattle, and the director, gradu-](https://image.slidesharecdn.com/1-httpfluoridealert-221223181504-93ad0f66/85/1-httpfluoridealert-orgresearchersstateskentucky2-docx-69-320.jpg)
![ered for acceptance only until the
end of June. You may submit your
letter via e-mail to “[email protected]
ada.org”; by fax to 1-312-440-3538;
or by mail to 211 E. Chicago Ave.,
Chicago, Ill. 60611-2678. By send-
ing a letter to the editor, the author
acknowledges and agrees that the
letter and all rights of the author in
the letter sent become the property
of The Journal. The views ex-
pressed are those of the letter
writer and do not necessarily reflect
the opinion or official policy of the
Association. Brevity is appreciated.
L E T T E R S
Copyright © 2009 American Dental Association. All rights
reserved. Reprinted by permission.
Fluoridated toothpaste and the prevention of early childhood
caries: A failure to meet the needs
of our youngDisclosureREFERENCE
Title Page
Include course ID, full name, date, laboratory number, and title.
Also include a brief abstract (≤ 150 words summarizing the lab
objectives, importance, results, and conclusions).
Introduction
Include background material pertaining to the laboratory
technique and its importance and application to environmental
microbiology. Clearly state the objective(s) of the laboratory.
Results and Discussion
This section should represent the bulk of your report. It should](https://image.slidesharecdn.com/1-httpfluoridealert-221223181504-93ad0f66/85/1-httpfluoridealert-orgresearchersstateskentucky2-docx-74-320.jpg)


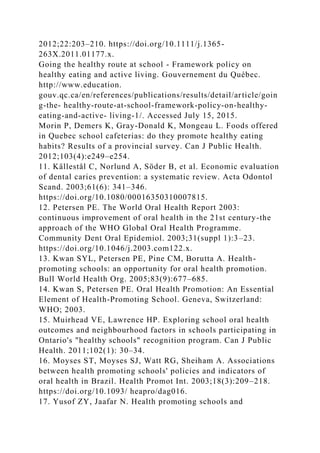
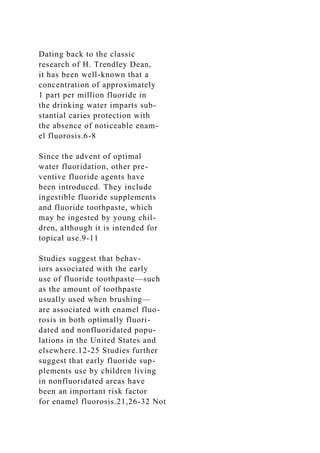
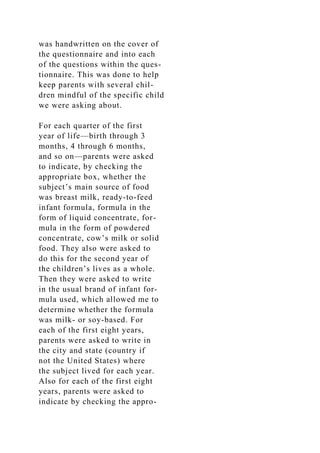
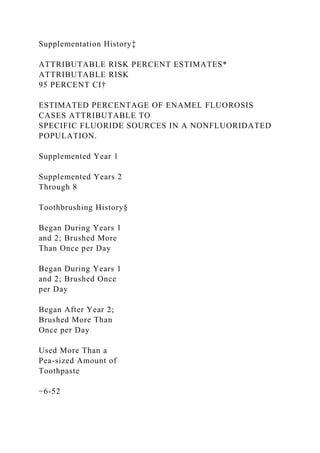
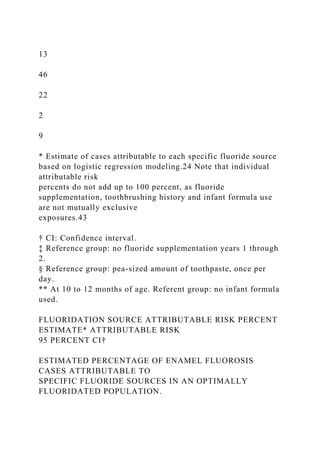
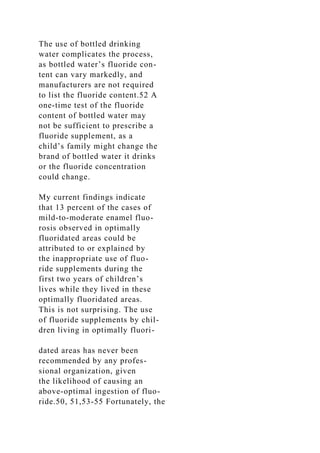
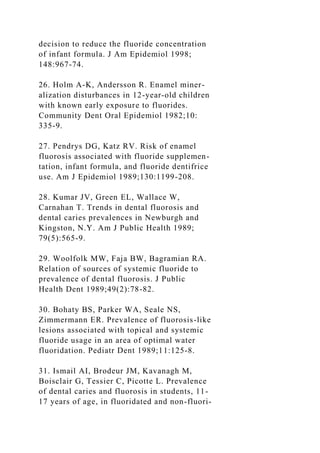
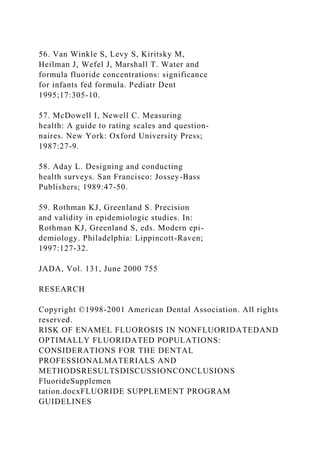
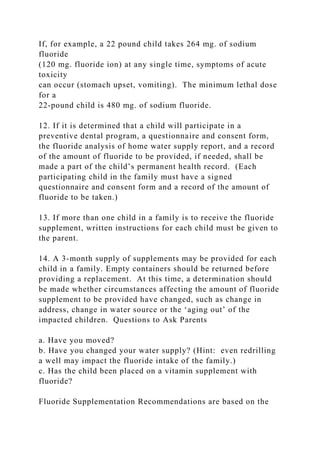
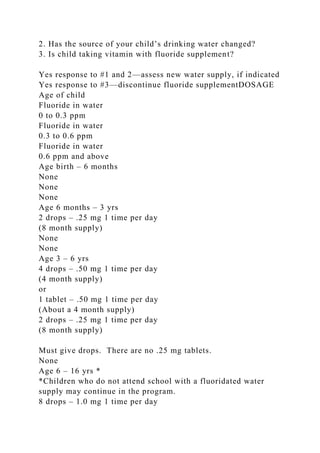
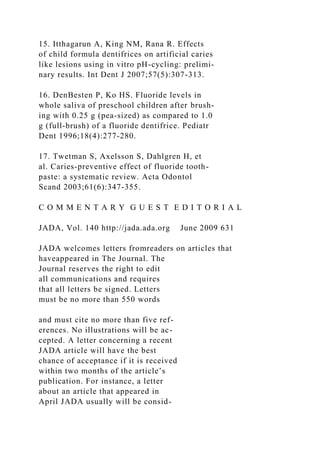
![INTRODUCTION
Despite improved detection and treatment
modalities, dental caries remain the most com-
mon chronic oral disease among children and a
major public health concern affecting 60%−90% of
school-aged children worldwide.1 Oral conditions
(untreated caries, severe periodontitis, and tooth loss)
affect nearly 3.9 billion people worldwide; untreated
decay in permanent teeth is the most prevalent condition,
affecting 35% of the population and ranking 80th among
the top 100 causes of disability-adjusted life years.2 North
American children have the second highest lifetime
caries experience measured by the Decayed, Missing,
and Filled-Teeth index (Decayed Missing Filled-
3
youth have experienced dental caries, with a higher prevalence
and severity found among youth from a low socioeconomic
background.4 Moreover, oral health is a determinant of general
health and plays an important role in quality of life.5 Finally,
oral disease is the fourth
From the 1Division of Oral Health and Society, Faculty of
Dentistry, McGill University, Montreal, Québec, Canada;
2Epidemiology and Biostatistics Unit, Institut National de la
Recherche Scientifique−Institut Armand Frappier, Laval,
Québec, Canada; 3University of Montreal Hospital Research
Centre, Montreal, Québec, Canada; and 4Department of Pedia-
trics, Université de Montréal, Centre Hospitalier Universitaire
Sainte- Justine, Montreal, Québec, Canada
Address correspondence to: Belinda Nicolau, PhD, Faculty of
Dentistry, McGill University, 2001 McGill College Avenue,
Suite 527, Montreal, QC Canada, H3A 1G1. E-mail:
[email protected]
0749-3797/$36.00
https://doi.org/10.1016/j.amepre.2017.07.005
Teeth1⁄42.08) worldwide. More than half of Canadian](https://image.slidesharecdn.com/1-httpfluoridealert-221223181504-93ad0f66/85/1-httpfluoridealert-orgresearchersstateskentucky2-docx-77-320.jpg)
![from the 2006 Canadian Census. The authors constructed a
material deprivation index of the area within 1,000 m of street
network around each school. The index comprises “the
proportion of individuals without a high school diploma, the
employment population ratio and the average personal income”
for people aged ≥15 years in census dissemination areas, with a
higher value representing lower deprivation.31 This variable
was classified into tertiles ranging from high (0) to low (2)
deprivation. The numbers of convenience and fast-food stores
within 500 m around each school were calculated using the GIS
from the Montreal Epide- miological and Geographic Analysis
of Population Health Out- comes and Neighbourhood Effect
database that contains information until May 2005.32 These
variables were then dicho- tomized into at least one store within
500 m (unfavorable) versus none within 500 m (favorable).
Statistical Analysis
The analyses for this paper were conducted in 2016. Principal
component analysis (PCA) with a polychoric correlation matrix
was used to group variables measuring schools’ healthy eating
promotion policies. Oblimin oblique rotation was applied to
differentiate the components and those with eigen values 41
were retained.
Subsequently, the authors performed a hierarchical agglomer-
ative average linkage cluster analysis using the components
identified by PCA, along with variables that measured presence
of dental health/hygiene programs and formal healthy eating
promotion initiatives, school’s surrounding food environment
and SES, to identify distinct types of school environments.
Cluster stop rules (Calinski−Harabasz pseudo-F index, and
Duda−Hart and Je [2]/Je [1] indices) were used to select the
optimal number of clusters.33
After preliminary descriptive and exploratory analyses, the
authors used generalized estimating equations with a binomial
link function, exchangeable correlation matrix, and school as
the grouping variable, to model the association between school
environment types and 2-year dental caries incidence in](https://image.slidesharecdn.com/1-httpfluoridealert-221223181504-93ad0f66/85/1-httpfluoridealert-orgresearchersstateskentucky2-docx-82-320.jpg)

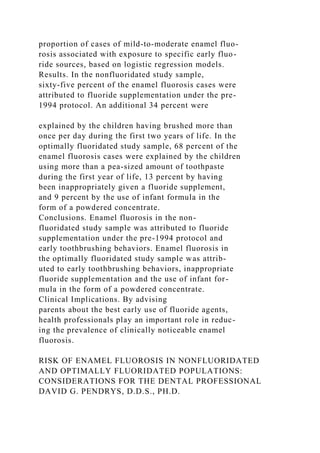
![variables in three
clusters.
cThe types of schools were graded as strong/average/weak in
dental care programs, based the on the distribution of these
variables in three clusters.
www.ajpmonline.org
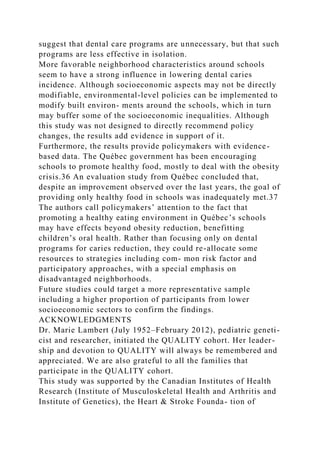
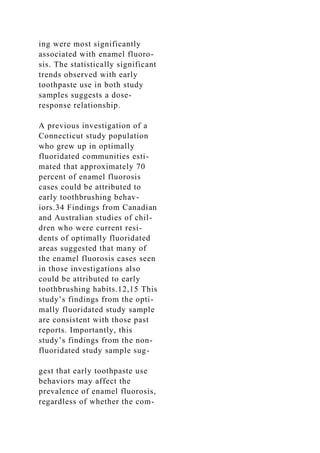
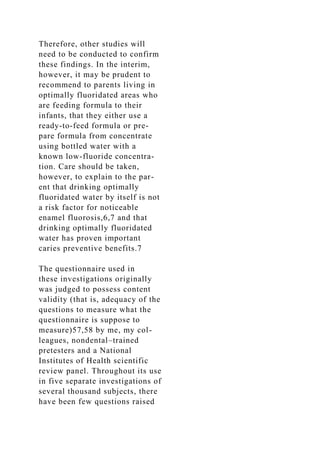
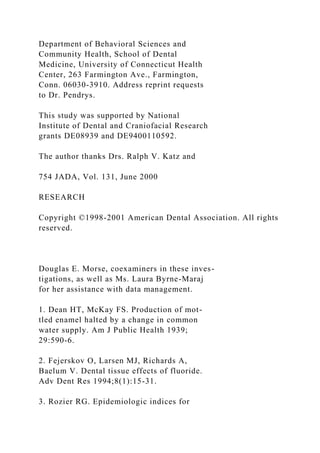
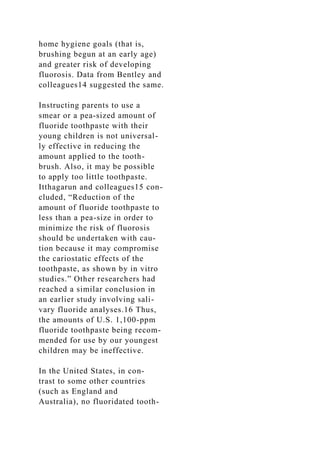
Edasseri et al / Am J Prev Med 2017;53(5):697–704 701 Table
3. Distribution of Sociodemographic Characteristics and Mean
DMF-S in Children Within Each School Environment
Cluster
Type
Total (n1⁄4330 1 (n1⁄4168 2 (n1⁄4119 3 (n1⁄443 Variable
[100%]) [50.9%]) [36.1%]) [13.0%])
Age, years, M (SD) 9.2 (0.9) 9.2 (0.9) 9.3 (0.9) 9.0 (0.9)
Sex, n (%)
Boys 191 (57.9) 93 (55.4) 73 (61.3) 25 (58.1)
Girls 139 (42.1) 75 (44.6) 46 (38.7) 18 (41.9)
Household income, n (%)
o$29,070 78 (23.6) 38 (22.6) 33 (27.7) 7 (16.3)
$29,070–$42,579 79 (23.9) 40 (23.8) 30 (25.2) 9 (20.9)
$42,580–$56,271 85 (25.8) 33 (19.6) 38 (31.9) 14 (32.6)
4$56,271 88 (26.7) 57 (33.9) 18 (15.1) 13 (30.2)
Parental education, n (%)
One or both parents hold a high school degree or 25 (7.6) 15
(8.9) 10 (8.4) 0 less
One or both parents completed CEGEP/vocational 121 (36.7) 67
(39.9) 39 (32.8) 15 (34.9) or trade school
One or both parents hold a university degree 184 (55.8) 86
(51.2) 70 (58.8) 28 (65.1)
DMF-S Index, M (SD)
Baseline DMF-S 0.6 (1.4) 0.5 (1.2) 0.7 (1.6) 0.8 (1.5)
DMF-S Visit 2 2.0 (2.9) 1.6 (2.3) 2.3 (3.3) 3.0 (3.5)
CEGEP, collège d'enseignement général et professionnel; DMF-
S, Decayed, Missing, Filled-Surfaces.
investigating the impact of comprehensive oral health](https://image.slidesharecdn.com/1-httpfluoridealert-221223181504-93ad0f66/85/1-httpfluoridealert-orgresearchersstateskentucky2-docx-86-320.jpg)