2. by six dimensions: Honesty–Humility (H), Emotionality
(E), Extraversion (X), Agreeableness (A), Conscientiousness
(C), and Openness to Experience (O) (Ashton & Lee, 2001,
2007). The most widely used measure of these six personality
dimensions is the HEXACO Personality Inventory–Revised
(HEXACO-PI-R), a self- or observer report instrument that
is available in 200-, 100-, and 60-item versions (Ashton &
Lee, 2009; Lee & Ashton, 2004, 2006), with the latter two
being widely used in personality research. Although there is
a published article reporting the detailed psychometric
properties of the HEXACO-60 (Ashton & Lee, 2009), there
has not yet been such an article specific to the HEXACO-100,
except for some brief reports on other language versions
of it (e.g., Romero, Villar, & López-Romero, 2015). In the
present research, we report the psychometric properties of
the HEXACO-100 using two large data sets cumulated in
the past few years.
The HEXACO Model of Personality Structure
As with the five-factor model (FFM), the HEXACO model
originated from research based on the lexical approach to
personality structure. In typical lexically based studies of
personality structure, researchers compile a comprehen-
sive list of familiar personality-descriptive adjectives of a
given language. Self- or observer ratings on the adjectives,
as provided by a large sample of participants, are then fac-
tor analyzed to identify a few major dimensions that
explain much of the covariation among those terms.
Research of this kind has been conducted in several
European and Asian languages, and the largest factor space
to replicate widely across languages has been the six-factor
solution (see Ashton et al., 2004; De Raad et al., 2014; Lee
& Ashton, 2008). The content of the HEXACO-PI-R was
based in large part on that of the six cross-culturally repli-
3. cated lexical personality factors.
The precursor of the HEXACO-PI-R (the HEXACO-PI)
was introduced by Lee and Ashton (2004). This earlier instru-
ment contained six broad factor-level scales, each of which
included four facet-level scales. A 25th facet-level scale,
Altruism, was later added both because of the importance of
that trait (as shown by the heavy representation of relevant
terms in personality lexicons) and also because of its role in
the theoretical interpretation of the HEXACO factors; note
that Altruism is an “interstitial” facet, which is expected to
divide its loadings across three factors (Honesty–Humility,
Emotionality, and Agreeableness). Another interstitial facet-
level scale, Negative Self-Evaluation, was added but later
removed, at which point the Expressiveness facet-level scale
659134ASMXXX10.1177/1073191116659134AssessmentLee
and Ashton
research-article2016
1University of Calgary, Calgary, Alberta, Canada
2Brock University, St. Catharines, Ontario, Canada
Corresponding Author:
Kibeom Lee, Department of Psychology, University of Calgary,
2500 University Drive NW, Calgary, Alberta T2N 1N4, Canada.
Email: [email protected]
Psychometric Properties of the
HEXACO-100
Kibeom Lee1 and Michael C. Ashton2
Abstract
Psychometric properties of the 100-item English-language
HEXACO Personality Inventory–Revised (HEXACO-
PI-R) were examined using samples of online respondents (N =
4. 100,318 self-reports) and of undergraduate students
(N = 2,868 self- and observer reports). The results were as
follows: First, the hierarchical structure of the HEXACO-100
was clearly supported in two principal components analyses:
each of the six factors was defined by its constituent facets
and each of the 25 facets was defined by its constituent items.
Second, the HEXACO-100 factor scales showed fairly low
intercorrelations, with only one pair of scales (Honesty–
Humility and Agreeableness) having an absolute correlation
above
.20 in self-report data. Third, the factor and facet scales showed
strong self/observer convergent correlations, which far
exceeded the self/observer discriminant correlations.
Keywords
HEXACO, Honesty–Humility, personality measurement,
personality structure, self/observer agreement
mailto:[email protected]
https://sagepub.com/journalsPermissions.nav
https://doi.org/10.1177/1073191116659134
https://journals.sagepub.com/home/asm
http://crossmark.crossref.org/dialog/?doi=10.1177%2F10731911
16659134&domain=pdf&date_stamp=2016-07-13
544 Assessment 25(5)
of Extraversion was replaced by the Social Self-Esteem
facet-level scale. These changes completed the HEXACO-
PI-R, which thus contains 25 facet-level scales, including 24
univocal facets plus the interstitial Altruism facet. For a
detailed history of the HEXACO-PI-R, see http://hexaco.org/
history, and for definitions of its factor- and facet-level scales,
see http://hexaco.org/scaledescriptions.
5. As discussed elsewhere (Ashton & Lee, 2007; Lee &
Ashton, 2012b), the theoretical interpretation of the six
HEXACO personality factors categorizes them into two broad
conceptual groups. First, the Extraversion, Conscientiousness,
and Openness to Experience dimensions represent individual
differences in engagement within three different domains of
endeavor: social, work-related, and idea-related. Second, the
Honesty–Humility, Emotionality, and Agreeableness dimen-
sions represent individual differences in three different
forms of altruistic tendencies. Specifically, Honesty–
Humility represents a tendency to treat others fairly even
when one could successfully exploit them, and Agreeableness
represents a tendency to be patient with others even when
one may be treated unfairly by them. In this way, Honesty–
Humility and Agreeableness represent two forms of recipro-
cal-altruistic tendency. Emotionality is conceptualized to
represent a tendency to prevent harms to self and kin, and is
thereby relevant to kin altruism (see detailed discussion in
Ashton & Lee, 2007).
The latter three personality dimensions distinguish the
HEXACO model from the FFM. Specifically, the variance
in FFM Agreeableness and Emotional Stability is redistrib-
uted into these three HEXACO dimensions, which also
incorporate a large amount of new variance not captured by
the FFM. This latter fact was demonstrated in Lee and
Ashton’s (2013) comparison between the NEO Five-Factor
Inventory and HEXACO-60 in which each of the FFM
dimensions was explained by the full set of HEXACO
dimensions, and vice versa. Results indicated that although
all of the FFM dimensions were accounted for adequately by
the HEXACO dimensions, HEXACO Honesty–Humility,
Emotionality, and (to a lesser degree) Agreeableness were
not satisfactorily accounted for by the FFM dimensions.
These results were obtained in cross-source analyses
(whereby self-reports were used in predicting observer
6. reports, or vice versa) as well as same-source analyses, and
have also been found in same-source analyses involving the
full-length versions of the two inventories (Gaughan,
Miller, & Lynam, 2012).
The recognition that the HEXACO model contains vari-
ance not shared with the FFM has inspired several empirical
studies examining the HEXACO factors in relation to vari-
ous outcome variables. Many of these studies investigated
variables that are expected to be related to the Honesty–
Humility, Emotionality, or Agreeableness dimensions.
Among these variables are guilt and shame proneness
(Cohen, Wolf, Panter, & Insko, 2011), moral character
(Cohen, Panter, Turan, Morse, & Kim, 2014), altruistic
behavior in economic game contexts (Hilbig & Zettler,
2009; Zettler, Hilbig, & Heydasch, 2013), religiousness
(Aghababaei, Wasserman, & Nannini, 2014; Saroglou,
Pichon, Trompette, Verschueren, & Dernelle, 2005), risk
taking (Ashton, Lee, Pozzebon, Visser, & Worth, 2010;
Weller & Thulin, 2012), the “dark triad” traits (Lee et al.,
2013), workplace impression management behaviors
(Bourdage, Wiltshire, & Lee, 2015), forgiving versus retali-
ating behaviors (Lee & Ashton, 2012a), phobic tendencies
(Ashton, Lee, Visser, & Pozzebon, 2008), schizotypy
(Winterstein et al., 2011), vocational interests (McKay &
Tokar, 2012), political attitudes (Chirumbolo & Leone,
2010; Zettler, Hilbig, & Haubrich, 2011), academic aptitude
and performance (Noftle & Robins, 2007), and so on. The
use of the HEXACO model as an organizing framework for
personality characteristics has been steeply increasing in
recent years.
In this article, we provide psychometric information on
the 100-item English-language version of the HEXACO-
PI-R. The results reported here are based on two large data
7. sets. First, we collected self-reports through the HEXACO-
PI-R online survey site. This site was originally developed
in 2009 to provide basic information about the inventory
and to allow researchers and teachers to download the
inventory materials in various languages. In October 2014,
we added a HEXACO online survey page to this website,
where any visitors wishing to learn about their HEXACO
personality profile can complete the inventory online. We
used here the data collected through this online survey site
cumulated over its first full year. Second, we also obtained
self-reports on the HEXACO-100, as well as observer
reports from closely acquainted persons, as part of ongoing
research in university student samples; for the present
report, we combined these latter data as cumulated from
2007 up until the end of 2014.
Method
Participants and Procedures
Online Sample. Between October 19, 2014 and October 18,
2015, 104,467 individuals submitted responses on the self-
report form of the English-language HEXACO-100 on a
recently launched online survey site (http://hexaco.org). Of
these, 100,639 participants responded to all of the 100 items
and made correct responses to all of the three attentiveness-
check items interspersed throughout the inventory (e.g.,
“This is an attentiveness check; please indicate ‘neutral’”).
The participants were further screened out on the basis of
two additional checks for data quality. First, to screen out
the respondents who provided extremely incoherent
responses, we computed a standard deviation of the item
responses on each of the six factor-level scales (i.e., after
recoding of reverse-keyed items), and calculated for each
respondent an average of the six standard deviations. Our
8. http://hexaco.org/history
http://hexaco.org/history
http://hexaco.org/scaledescriptions
http://hexaco.org
Lee and Ashton 545
previous data from student samples suggested that it is
extremely unlikely that a respondent will have a value of
1.60 or greater on this variable, and therefore, we excluded
respondents according to this criterion. Second, to screen
out persons who overused the same response option (or oth-
erwise showed very little variation in use of response
options), we computed for each respondent a standard devi-
ation of responses on all HEXACO-100 items before recod-
ing of reverse-keyed items. Our previous data from student
samples suggested that it is extremely unlikely that a
respondent will have a value of less than 0.70 on this vari-
able, and therefore, we excluded respondents according to
this criterion. After the application of these three screening
criteria, a sample of 100,318 respondents remained.1
Of the 100,318 respondents included in the final online
sample, 48.4% were female and 50.2% were male (the
remaining 1.4% did not provide gender information). With
regard to the age of participants, 1,373 participants did not
indicate their age; of the remaining participants, the mean
age was 37.1 years and the standard deviation was 14.1. A
majority of the participants indicated their highest level of
completed education as high school (19.2%), university/
college (41.6%), or graduate/professional school (32.8%).
Of those who indicated high school, 47% indicated that
they are currently attending a postsecondary education.
Undergraduate Student Sample. In ongoing research since
9. 2007, the HEXACO-100 has been administered to under-
graduate students and their close acquaintances (typically
friends, romantic partners, or relatives, with most of the
acquaintances also being students). In this research, partici-
pants attended sessions in pairs of two closely acquainted
persons, both of whom provided self-reports and observer
reports of the other dyad member on the HEXACO-100.
Participants completed the questionnaires in a small group
setting (10 pairs or fewer), and participants were seated
separately from (and were not permitted to communicate
with) the other members of their respective pairs.
The final sample included 2,868 participants (hereafter
the student sample); 64.3% were female and 34.9% were
male (0.8% did not indicate their sex). The average age of
the participants was 20.9 (SD = 3.9). The length of time that
the participants indicated having known each other ranged
from 6 months to 37 years (M = 5.0 years, SD = 4.7), and
the median subjective rating as to how well they feel they
know their participating partners was 8 on a scale from 0 to
10 (M = 8.1, SD = 1.4).
HEXACO-100. The paper-and-pencil format of the inven-
tory was used for the student sample. Different subsets of
student respondents also completed different sets of addi-
tional self-report survey materials. Participants provided
self-reports on the HEXACO-100 (and other measures) first
and then observer reports on the HEXACO-100 (and, in
some cases, additional measures). For all HEXACO-100
items, a 1-to-5 response scale was used, with response
options given as 1 = strongly disagree, 2 = disagree, 3 =
neutral (neither agree nor disagree), 4 = agree, and 5 =
strongly agree. Within each facet-level scale, between one
and three of the four items are reverse-scored; within each
factor-level scale, between 7 and 10 of the 16 items are
10. reverse-scored. A respondent’s scale score is computed as
the average of his or her responses across all items belong-
ing to the scale, after recoding of reverse-scored items.
For the online questionnaire, the order of items was the
same as that of the paper-and-pencil version; the items were
presented one at a time, with the next item presented imme-
diately after the participants submitted a response to an
item. The three attentiveness-check items (see above) were
inserted after Items 24, 49, and 74. After completing the
HEXACO-100, the online participants were asked to
answer optional research-related and demographic ques-
tions. Each online participant’s HEXACO-100 scale scores
were provided to that person along with some distributional
data and some background information about personality
measurement in the form of FAQs.
Results
Descriptive Statistics and Alpha Reliabilities
Table 1 shows means, standard deviations, and alpha reli-
abilities of the HEXACO-100 scales from the two samples.
Alpha reliabilities of the self- and observer reports of the
HEXACO-100 factor-level scales all fell in the .80s. At the
facet level, alpha reliabilities of the self-report scales (in the
order of the student and online samples) ranged from .52
and .59 for Unconventionality to .81 and .83 for Greed
Avoidance, with a mean of .70 and .73. Alpha reliabilities of
the observer report facet scales ranged from .45
(Unconventionality) to .82 (Fairness), with a mean of .72.
Table 1 also provides means and standard deviations
for self- and observer report scales in the student sample
and for the self-report scales in the online sample. The
means and standard deviations are also reported sepa-
11. rately for each sex within each sample, and d statistics
indicate the sex differences in standardized units. Mean
scale scores were in most cases fairly close to the scale
midpoint of 3.0, but ranged as high as about 3.7 (for
Openness in the online sample). Scale standard deviations
were typically around 0.60 for factor-level scales and
around 0.80 for facet-level scales, and thus equaled about
15% and 20%, respectively, of the possible range of
scores (i.e., 4.0). Within the student sample, self-reports
averaged slightly higher than did observer reports
for Emotionality (d = 0.20) and Openness to Experience
(d = 0.31), but observer reports averaged slightly higher
than did self-reports for Agreeableness (d = 0.24).
With regard to the differences between the online and
student samples (within self-report data), the former sample
546
T
a
b
le
1
.
M
ea
ns
, S
ta
121. differences may reflect a combination of some demographic
differences between the two samples, such as their mean
age and sex composition, as well as true personality differ-
ences and response style differences; however, detailed
consideration of the sources of these score differences is
beyond the scope of this article.
Consistent with the findings of previous studies, apprecia-
ble gender differences were found for self-reports
on Honesty–Humility (women higher than men, with
ds = 0.49 and 0.42 for the student and online samples, respec-
tively) and Emotionality (women higher than men, with ds =
1.23 and 0.92 for the student and online samples, respectively)
as well as, in the student sample, observer reports on Honesty–
Humility (d = 0.45) and on Emotionality (d = 1.28).
Factor Structure of the HEXACO-100
Within each sample, we conducted principal components
analyses both at the facet level (with the aim of recovering
the six broad factors) and at the item level (with the aim of
recovering the 25 narrower facets). With regard to the latter
analyses, we are not aware of any previous studies in which
the items of an omnibus personality inventory have been
analyzed with the aim of recovering separate factors for
each of the facets of the inventory.
Facet-Level Analysis. Three principal components analyses
involving the 25 facet scales were conducted: self-reports
from the student sample, observer reports from the student
sample, and self-reports from the online sample. (The cor-
relation matrices for the three data sets are shown in
Supplementary Tables 1-3; all supplementary materials
available online at http://asm.sagepub.com/content/by/sup-
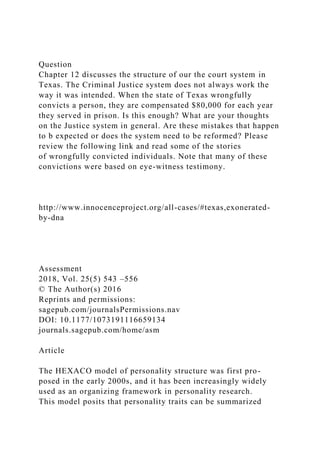
plemental-data.) The scree plots of eigenvalues in all three
data sets clearly suggested a break between the seventh and
122. sixth dimensions (see Figure 1). Table 2 shows the results of
the six-component solution after varimax rotation as
obtained in each of the three data sets. Within each analysis,
all of the 24 facets that are assigned to a single dimension
showed their highest loadings on their designated compo-
nents. As expected, the Altruism scale divided its loadings
on Honesty–Humility, Emotionality, and Agreeableness in
all three analyses, with loadings in the .30s and .40s on
those dimensions. We should also note that many of the
other 24 facet scales showed one or more appreciable and
theoretically meaningful secondary loadings. As seen in
Table 2, the pattern of secondary loadings was found to be
very similar across three analyses.
Item-Level Analysis. We conducted a principal components
analysis at the item level separately for each of the three
data sets. The scree plots obtained from the two self-report
Figure 1. Eigenvalues from the three principal components
analyses.
samples showed a clear elbow after the first seven factors,
whereas the scree plot from observer report sample showed
it after the first six factors.2
Given that the primary purpose of the item-level analyses
was to assess the empirical distinctness of the 25 facet scales in
the HEXACO-100, we first rotated the 25 components using
the varimax criterion. In these varimax-rotated solutions, the
large majority of the 25 components were defined primarily by
the designated items, but a few components were jointly
defined by items from two facets in the same factor domain.
We then rotated the 25 compon-ents using the orthogonal
Procrustes–targeted rotation (Paunonen, 1997; Schönemann,
1966), with the four items of each facet being targeted on their
own component. The Procrustes-rotated solutions produced
123. components that corresponded very closely to the 25 facets
(see Supplementary Tables 4-6): In the two self-report data
sets, all 100 items showed their strongest loadings on their
intended components, typically ranging from the .50s to the
.70s. The average loadings shown by the constituent items of
the facets on their intended components ranged from .49
(Altruism) to .73 (Greed Avoidance) in the online sample, and
from .50 (Altruism) to .74 (Greed Avoidance) in the student
sample. In observer report data, 97 of 100 items showed their
highest loadings on the intended components; one item in
Unconventionality and two items in Altruism showed their
highest loadings on other components. The average loadings
of the constituent items for the 25 facets in observer reports
ranged from .50 (Altruism) to .74 (Greed Avoidance). The
item-level principal components analyses therefore support the
distinctness of the 25 facet scales.
http://asm.sagepub.com/content/by/supplemental-data
http://asm.sagepub.com/content/by/supplemental-data
548
T
a
b
le
2
.
Lo
ad
in
210. 1.
00
550 Assessment 25(5)
Table 4. Self/Observer Agreement for HEXACO-100 Factor and
Facet Scales.
r r
Honesty–Humility .46 Agreeableness .47
Sincerity .20 Forgivingness .35
Fairness .45 Gentleness .35
Greed Avoidance .47 Flexibility .35
Modesty .30 Patience .43
Mean WFCC/mean WFDC .36/.19 Mean WFCC/mean WFDC
.37/.25
Emotionality .61 Conscientiousness .52
Fearfulness .51 Organization .52
Anxiety .40 Diligence .37
Dependence .44 Perfectionism .42
Sentimentality .47 Prudence .33
Mean WFCC/mean WFDC .46/.30 Mean WFCC/mean WFDC
.41/.25
Extraversion .56 Openness to Experience .56
Social Self-Esteem .38 Aesthetic Appreciation .49
Social Boldness .53 Inquisitiveness .45
Sociability .45 Creativity .50
Liveliness .45 Unconventionality .36
Mean WFCC/mean WFDC .45/.28 Mean WFCC/mean WFDC
.45/.26
Interstitial facet
Altruism .36
211. Note. N = 2,863. WFCC = within-factor convergent correlation
(self/observer correlation for same facet scale); WFDC =
within-factor discriminant
correlation (self/observer correlation for different facet scales
within same factor).
Correlations Between the HEXACO Factor
Scales
Consistent with the findings from previous studies, the cor-
relations between the HEXACO factor scales were gener-
ally low (see Table 3). Within the student sample, the
strongest correlation was that between Honesty–Humility
and Agreeableness, both in self-reports (r = .30) and in
observer reports (r = .39). In self-reports from the student
sample, no other correlation between factor scales had an
absolute value exceeding .20. With respect to observer
reports in the student sample, three other correlations had
absolute values exceeding .20, but none reaching .30. In
the online sample (based on self-reports), the highest cor-
relation was again that between Honesty–Humility and
Agreeableness (r = .42); all other correlations had absolute
values below .20. Interestingly, the correlation between
Honesty–Humility and Agreeableness in the online sample
was found to be noticeably higher than that in the student
sample self-reports (.42 vs. .30).
One possible reason for the difference in correlations
involves the way by which many of the online participants
found the HEXACO website. Many of the early participants in
the online sample had likely visited the HEXACO-PI-R web-
site with an intrinsic interest in learning about their personality
profile. However, beginning on June 9, 2014, an article about
Machiavellianism appeared in a popular science magazine,
and that article included a link to the online HEXACO-PI-R.
212. Shortly thereafter, several online newspapers, including
mass-market tabloids, published articles with eye-catching
headlines (e.g., How Machiavellian Are You?) and links to the
online HEXACO-PI-R. Such publicity resulted in a mas-
sive influx of persons who provided self-reports on the
HEXACO-100: about 78,129 persons responded during the 2
weeks from June 9 to June 23. Given the results reported else-
where in this article, it appears that this influx of respondents
did not in general compromise the psychometric properties of
the HEXACO-100. However, the participants who responded
on or after June 9 differed from those who responded before
that date. Specifically, the “posttabloid article” participants
tended to show lower means than the earlier participants in
Honesty–Humility (d = −0.23), Agreeableness (d = −0.37), and
Openness to Experience (d = −0.16), as well as a higher
standard
deviation in Honesty–Humility (by 10%) and lower standard
deviations in Extraversion (by 10%) and Conscientiousness (by
7%).3 Also, the correlations between Honesty–Humility
facets, and the correlation between Honesty–Humility and
Agreeableness, were clearly higher among the later partici-
pants. When we calculated the correlations among the
HEXACO factor scales using only the sample of 8,233 respon-
dents who completed the inventory before the massive influx
of the media-directed respondents (see Table 3), the correlation
between Honesty–Humility and Agreeableness was only .28,
which is very similar to what was observed in the student self-
report data. The correlation between self-reports of Honesty–
Humility and Agreeableness was thus around .30 for the online
pretabloid article participants and the student participants, but
increased to around .40 for online participants who mainly
Lee and Ashton 551
213. were attracted by tabloid newspaper articles about assessing
one’s manipulative tendencies.4 In the Discussion section, we
consider explanations for the increased correlation within the
latter group of participants.
Self/Observer Agreement
The student sample includes 2,863 pairs of well-acquainted
persons who provided self- and observer reports on the
HEXACO-100, and we examined self/observer agreement
in the HEXACO-100 variables among these persons.5 As
shown in Table 4, the self/observer agreement correla-
tions for the factor scales were .61 for Emotionality, .56
for Extraversion and Openness to Experience, .52 for
Conscientiousness, .47 for Agreeableness, and .46 for
Honesty–Humility. In contrast, the self/observer discrim-
inant correlations between factor scales all fell below .20
except for that between self-report Emotionality and
observer report Conscientiousness (r = .20). Table 4 also
shows self/observer agreement correlations for the 25 facet
scales. These values ranged from .20 (Sincerity) to .53
(Social Boldness) with a mean of .42. Note that the Sincerity
scale showed a noticeably lower agreement relative to other
facet scales, as the next two lowest self/observer agreement
correlations were .30 and .33, for Modesty and Prudence,
respectively. In the Discussion section, we comment further
on the findings for Sincerity.
The mean of self/observer agreement correlations for
facets within the same factor (referred as mean within-
factor convergent correlation) were much stronger than the
mean self/observer correlations between different facets in
the same factor (referred as mean within-factor discrimi-
nant correlation), a finding that supports the empirical dis-
tinctness of the facets within the same factor. (The self/
214. observer correlations between different facets from the dif-
ferent factor domains—that is, cross-factor discriminant
correlations—were expectedly lower than were within-
factor discriminant correlations, with a mean absolute cor-
relation of .07.)
Discussion
Summary of Results
In this report, we examined the psychometric properties of
self- and observer report forms of the HEXACO-100 using
two large data sets, one of which includes data consisting of
reciprocal self- and observer reports in close acquaintances.
The results showed that across data sets and sources, the scales
showed appropriate score distributions, with mean scores not
far from scale midpoints and with the standard deviations
about 15% (factor scales) or 20% (facet scales) of the possible
range of scores. Alpha reliabilities were in the .80s for factor-
level scales and averaged above .70 for the facet-level scales.
Principal components analyses of the 25 facet-level scales
produced six components that were clearly interpretable as the
HEXACO dimensions; also, principal components analyses of
the 100 items produced 25 components that corresponded
quite closely to the facets. Self/observer agreement between
closely acquainted persons averaged in the .50s for factor-level
scales and above .40 for the facet-level scales; moreover, self/
observer correlations for the same facet averaged at least 50%
higher than self/observer correlations for different facets from
the same factor-level scale. Thus, the results supported the con-
struct validity of both factor- and facet-level scales in the
HEXACO-100. Below, we discuss some of the results in
detail.
Alpha Reliabilities
215. As noted above, we obtained alpha reliabilities in the .80s
for the factor-level scales and averaging above .70 (but
ranging from the .50s to the .80s) for the facet-level scales.
It is sometimes claimed, without explanation, that an alpha
of .70 represents a minimally acceptable level of alpha reli-
ability. We note, however, for the brief (four-item) facet-
level scales of the HEXACO-100, even a moderately high
mean interitem correlation of .30 would produce an alpha
reliability of only .63.6 In our opinion, it would be unwise to
achieve an arbitrarily determined level of alpha reliability
by (a) making the items very similar, with corresponding
loss of content validity or (b) exploiting response style vari-
ance (such as by excluding reverse-scored items and/or by
making items more extreme in social desirability), thereby
weakening the discriminant validity of the scales (see
Ashton et al., in press).
We think that even the HEXACO-100 facets having rela-
tively low reliability are useful for research purposes, given
the evidence of their convergent and discriminant validity
as shown in Table 4. In a similar way, McCrae, Kurtz,
Yamagata, and Terracciano (2011) have demonstrated that
for the NEO-PI-R, facet scales with lower alpha reliability
(i.e., α < .60) tend to show similar levels of validity to those
of other facet scales with higher alpha reliability. However,
because of the brevity of the HEXACO-100 facet scales, a
considerable fraction of the scale variance will be attribut-
able to the individual items; therefore, we recommend that
researchers who examine the associations of these scales
with various external criteria also check the item-level asso-
ciations with those criteria, to ensure that the facet-level
associations are not due to the variance of a particular item.
Correlations Between the HEXACO Factor-Level
Scales
216. As with the findings from the previous studies (e.g., Ashton,
Lee, Goldberg, & de Vries, 2009), the correlations between the
HEXACO factor scales were found to be much lower than
what has typically been observed for Big Five measures.
Within self-report data, an absolute correlation exceeding .20
552 Assessment 25(5)
was observed for only one pair of scales, Honesty–Humility
and Agreeableness. In contrast, correlations between self-
report scales measuring the Big Five are typically much higher,
with about half of the 10 scale intercorrelations falling between
.20 and .40 (or higher) for widely used Big Five measures such
as the NEO Five-Factor Inventory and the NEO-PI-R (Costa &
McCrae, 1992), the Big Five Inventory (John & Srivastava,
1999), and the Big Five Aspect Scales (DeYoung, Quilty, &
Peterson, 2007). (See, e.g., Table 2 in Lee & Ashton, 2013;
Table 6 in DeYoung et al., 2007; Appendix F in Costa &
McCrae, 1992.) We note that the relatively weak correlations
between HEXACO-100 factor-level scales, as compared with
the correlations between Big Five scales, would leave little
room for any higher-order factor(s) of considerable size,
regardless of whether such factors were to reflect real person-
ality variation or merely response biases (see Ashton et al.,
2009, for a discussion of higher-order personality factors).
Within observer report data, correlations between factor-
level scales tended to be higher than in self-reports but were
still modest, with only one correlation in the .30s, and three
in the .20s. The higher correlations in observer report data
are consistent with previous results suggesting that observer
reports of personality provide a less differentiated descrip-
tion than do self-reports (e.g., Ashton & Lee, 2010; Beer &
217. Watson, 2008).
In each of our samples, the highest correlating pair of fac-
tor-level scales was Honesty–Humility and Agree-ableness.
We believe that the modest positive correlation between these
two scales can be understood in relation to our interpretation of
their underlying dimensions as representing the personality
bases of reciprocally altruistic tendencies (e.g., Ashton & Lee,
2007). That is, although Honesty–Humility and Agreeableness
represent two different forms of reciprocal-altruistic tenden-
cies, the combination of high Honesty–Humility and high
Agreeableness (vs. low Honesty–Humility and low
Agreeableness) is of particular importance in everyday interac-
tions with others because it is this blend that determines an
overall tendency to cooperate with (vs. defect against) others.
For this reason, coherent personality traits (or single personal-
ity descriptors) tend to be densely located in this region,
whereas opposite-signed blends are scarce. As a result, mea-
sures of Honesty–Humility and Agreeableness tend to be mod-
estly positively correlated (see detailed discussion in Ashton,
Lee, & de Vries, 2014). But even for Honesty–Humility and
Agreeableness, some of the correlations between facets are
only slightly above zero: in the most extreme case, the Sincerity
facet of Honesty–Humility correlated only .10, .15, and .11
with the Patience facet of Agreeableness in the student self-
report, student observer report, and online self-report data sets,
respectively (with the last value dropping to only .07 if based
only on the “pretabloid” respondents).
As noted in the Results section, the correlation between
Honesty–Humility and Agreeableness was noticeably higher
(r = .42) when calculated from the sample of respondents who
were mostly attracted through tabloid newspaper articles
describing Machiavellian tendencies. Although a detailed
analysis of the reason for this relatively high correlation is
218. beyond the scope of this article, we suspect that it resulted
partly from increased variance among the “posttabloid”
respondents in an underlying Honesty–Humility factor. That
is, the tabloid articles could have increased the variance in an
underlying Honesty–Humility factor, both by attracting more
respondents with lower levels of Honesty–Humility and also
by priming respondents to choose consistently high- or low-
Honesty-Humility response options. To the extent that the vari-
ance in an underlying Agreeableness factor was not increased,
and to the extent that Agreeableness facets tend to have modest
positive secondary loadings on the underlying Honesty–
Humility factor, increased variance in the latter factor would
also increase the proportion of Agreeableness scale variance
that overlaps with Honesty–Humility.
Self/Observer Agreement of the Factor-Level
Scales
As we have reported elsewhere for subsamples of the cur-
rent sample, the levels of self/observer agreement of the
HEXACO-100 scales are rather high, ranging from the mid-
dle .40s to the low .60s. It is of some interest that the two
factor-level scales having self/observer correlations below
.50—Honesty–Humility and Agreeableness—are those that
we interpret as being relevant to reciprocal-altruistic or
cooperative tendencies. We suspect that observer reports on
these dimensions will tend to be influenced by the current
level of harmony or conflict in the relationship between the
observer and the target person, and thus will often tend to
overestimate or underestimate the target person’s levels of
these dimensions. This possibility is consistent with the
finding that the correlations between these two scales are
higher within observer reports than within self-reports, but
we cannot test this possibility directly in the current data.
Self/observer agreement for the HEXACO-PI-R scales
219. is typically slightly higher than is found for Big Five or
FFM scales of comparable length (see, e.g., Lee & Ashton,
2013). This fact, in combination with the typically lower
scale intercorrelations within each source, means that self-
reports on HEXACO-PI-R scales are able to equal self-
reports on Big Five scales in the prediction of observer reports
on the latter, whereas self-reports on HEXACO-PI-R scales
substantially exceed self-reports on Big Five scales in the
prediction of observer reports on the former. Such results
imply that measures of the HEXACO factors capture essen-
tially all of the valid variance in measures of the Big Five,
but that measures of the Big Five miss much of the valid
variance in measures of the HEXACO factors.
Distinctness of the Facet-Level Scales
Many omnibus personality inventories are organized hierar-
chically such that many narrow facet scales are subsumed in
Lee and Ashton 553
a few broad factors (e.g., the NEO-PI-R; Costa & McCrae,
1992). The factor structure of these personality inventories
has frequently been examined through analyses in which
the few broad factors are extracted from the facet scales (or
occasionally, from the items), but never through analyses in
which the many narrower facet-level factors are extracted
from items. That is, the conceptualized differences among
the facet scales have been assumed, but have not been
empirically evaluated.
In the present research, we conducted a principal compo-
nents analysis involving 100 items and examined 25 com-
ponents defined by those items. The 25 components rotated
220. to a predetermined target structure showed a fairly close
correspondence to that target structure. That is, nearly all of
the components were loaded most strongly by the four
items making up the facet scale. These results were recov-
ered across online and student samples as well as across
self- and observer reports within the latter sample, and
thereby strongly support the empirical distinctness of the
HEXACO-100 facet scales.
In addition, results involving self/observer correlations
also support the empirical distinctness of the facet scales.
When we compare convergent correlations of facet scales
(i.e., self/observer agreement) with the “semidiscriminant”
correlations between facet scales within the same factor, no
convergent correlation other than that of the Sincerity facet
was exceeded by any of the within-factor discriminant cor-
relations, and even Sincerity had a convergent correlation
exceeding its own semidiscriminant correlations. (Low
cross-source agreement has previously been observed for
other personality traits involving interpersonal manipulation
[e.g., “social adroitness”; Jackson, 1978], and this suggests
that even closely acquainted individuals have somewhat lim-
ited accuracy in judging this aspect of each other’s personali-
ties.) Likewise, the mean within-factor convergent
correlations were at least 50% larger than the mean within-
factor discriminant correlations. These results thus support
the conceptual distinctness of the HEXACO-100 facet scales.
One potential explanation for the variation across facet
scales in self/observer agreement correlations is that the
scales are differentially influenced by socially desirable
responding. Recent analyses by de Vries, Realo, and Allik
(2016) showed that across HEXACO items, self/observer
agreement showed a modest negative correlation with the
absolute value of item evaluativeness (r = −.21), and thus
suggest at least some role of scale (un)desirability in self/
221. observer agreement.
Relations With the HEXACO-60 and
HEXACO-200
The HEXACO-60 has been described elsewhere (Ashton &
Lee, 2009). We recommend this shorter version of the
inventory (i.e., 10 items for each scale) for research in
which time constraints do not allow administration of the
HEXACO-100. The HEXACO-60, whose items are a sub-
set of the HEXACO-100 (but not simply the first 60 such
items), shows very high correlations at the factor-scale level
with the HEXACO-100: in the present online sample, all six
convergent correlations exceeded .95. When we compute the
convergent correlations of the HEXACO-60 scales with the
corresponding ad hoc scales consisting of the remaining six
items from the HEXACO-100, the convergent correlations
ranged from .67 (Conscientiousness) to .81 (Honesty–
Humility) with a mean of .74 (see Supplementary Table 7 for
the full results).
The present findings support the validity of the
HEXACO-100 facet scales, and as explained earlier, we rec-
ommend this inventory for many contexts in which researchers
are interested in facet-level as well as factor-level measure-
ment. To examine the relationships of the facet scales of the
HEXACO-100 with the corresponding longer scales of the
HEXACO-200, we computed convergent correlations using a
previously collected self-report data set in which the latter
inventory was administered (N = 877 undergraduate students).
The convergent correlations between the two sets of facet
scales ranged from .90 (Unconventionality) to .96
(Organization). We also computed the correlations of the
HEXACO-100 facet scales with the corresponding alternative
facet scales comprising the four items from the HEXACO-200
222. not chosen for the HEXACO-100. The convergent correlations
ranged from .58 (Creativity) to .83 (Organization) with a mean
of .70 (see Supplementary Table 8 for the full results). These
results suggest that the HEXACO-100 is adequate for facet-
and factor-level assessments for research purposes. The
HEXACO-200 is preferable when the researcher wants to
measure the facets with high reliability and when a long
administration time is available. This would be the case in
some applied contexts and in pure research focusing on vari-
ous specific facets.
Finally, we should note that the Altruism scale that is
located interstitially among Honesty–Humility, Emotionality,
and Agreeableness is not included in the HEXACO-60.
Researchers who wish to use the HEXACO-60 but who are
interested in measuring this aspect of personality are advised
to add the items of the four-item Altruism scale included in
the HEXACO-100.
Other Inventories Measuring Similar Sets of Six
Personality Factors
There are currently some other measures of six factors similar
to those of the HEXACO-PI-R. The Brief HEXACO Inventory
(de Vries, 2013) has been developed with the express aim of
providing a shorter measure of the six HEXACO constructs.
The 24-item Brief HEXACO Inventory was found to show
strong psychometric properties for such a brief instrument,
including an adequate factor structure as well as good conver-
gent validity with the personality dimensions included in the
original HEXACO-PI-R. This instrument is suitable when
554 Assessment 25(5)
223. administration time is extremely limited but approximate indi-
cations of the broad factors are satisfactory.
Thalmayer, Saucier, and Eigenhuis (2011) developed the
Questionnaire Big Six Scale (QB6) to operationalize the
lexical six factors that are broadly similar to the six
HEXACO constructs. A recent report by Thielmann, Hilbig,
Zettler, and Moshagen (2016) showed that the six factors
assessed by the QB6 and the HEXACO-60 were broadly
similar to each other. The factor similarities were higher
for Emotionality, Extraversion, Agreeableness, and Consci-
entiousness (rs >|.63|) than for Honesty–Humility and
Openness to Experience (rs <|.46|). The QB6 appears to be
a psychometrically sound short measure, but researchers
should note the conceptual differences between the two
models in relation to the latter two personality dimensions.
Finally, there is a measure known as the Mini-IPIP6
(Sibley et al., 2011), which adds an Honesty–Humility scale
to the Mini-IPIP5 previously developed by Donnellan,
Oswald, Baird, and Lucas (2006) to measure the classic Big
Five. We should note that the factors assessed by the Mini-
IPIP6 are not isomorphic to the six HEXACO constructs.
First, Agreeableness and Neuroticism of the Mini-IPIP6 are
two of the Big Five factors, and therefore, do not align
directly with Agreeableness and Emotionality in the
HEXACO model. In addition, the Honesty–Humility scale
included in the Mini-IPIP6 is fairly narrow in that it includes
only “humility” aspects (greed avoidance and modesty) and
not “honesty” aspects (sincerity and fairness). The Mini-
IPIP6 appears to be a psychometrically sound short mea-
sure, but researchers should note these differences between
the constructs it assesses and those assessed by the
HEXACO-PI-R.
Future Research Directions
224. Below, we discuss some future research directions. First,
no studies yet have been conducted to examine to the extent
that psychometric properties of the HEXACO-PI-R gener-
alize across various demographic groups (e.g., sex, age,
nationality, etc.), across rating conditions (e.g., supervised
face-to-face administration vs. unsupervised online admin-
istration, or low-stakes research conditions vs. high-stakes
job application conditions, etc.), and across different lan-
guage versions. As such, investigating measurement invari-
ance issues would be desirable. Exploratory structural
equation modeling might be particularly useful for this
purpose (see Marsh, Morin, Parker, & Kaur, 2014). Second,
in the years to come, we may attempt to improve the valid-
ity of the inventory by identifying and replacing items that
are culturally less generalizable or are outdated. Third, it is
important to continue to assess to what extent and in what
ways the HEXACO-PI-R can add to personality invento-
ries widely used in the literature. Although studies have
shown that the Honesty–Humility, Emotionality, and
Agreeableness dimensions contain much valid variance not
captured by the Big Five factors (e.g., Lee & Ashton,
2013), it is of interest to identify important criterion vari-
ables and personality phenomena (e.g., age trends, similar-
ity between social partners, etc.) that are associated with
that variance. Thus far, such studies have been primarily
focusing on the Honesty–Humility dimension (Ashton &
Lee, 2008; Hilbig & Zettler, 2015), with some attention to
Emotionality (Ashton et al., 2008; Gaughan et al., 2012),
but future research might examine Emotionality and
Agreeableness in more detail.
Conclusion
Our results showed strong psychometric properties for the
225. 100-item version of the HEXACO-PI-R, as examined in
self-reports from an online sample and in both self- and
observer reports from a student sample. Descriptive statis-
tics and alpha reliabilities were appropriate. The 25 facets
showed the expected pattern of loadings on six broad
dimensions, and the 100 items also defined their intended
25 facet-level dimensions. Correlations between the factor-
level scales were rather weak. Strong convergent correla-
tions and weak discriminant correlations were obtained
between self-reports and observer reports from closely
acquainted persons. We recommend the HEXACO-100 for
use in research settings whenever a measure of the major
personality dimensions is desired.
Acknowledgments
The authors thank Mike Edmonds for developing and launching
the HEXACO-PI-R online survey site.
Declaration of Conflicting Interests
The author(s) declared the following potential conflicts of
interest
with respect to the research, authorship, and/or publication of
this
article: The authors have received royalties for non-academic
use
of the HEXACO-PI-R.
Funding
The author(s) disclosed receipt of the following financial
support
for the research, authorship, and/or publication of this article:
This
research was supported by Social Sciences and Humanities
226. Research Council of Canada grant 410-2011-0089.
Notes
1. The cutoff values used for the latter two procedures were
deliberately chosen to be very conservative, because the pur-
pose of this procedure was to screen out obviously invalid
responses, ones that could be detected by visual inspection
(e.g., 3333333333, 1234512345, etc.). Consequently, only
a very small number of responses were excluded by these
Lee and Ashton 555
criteria, and including these responses did not make any dis-
cernible differences in the present results.
2. The varimax-rotated six-component solutions all showed
dimensions clearly interpretable as the six HEXACO factors.
When we examined the varimax-rotated seven-component
solution in the analyses involving self-report items, the sev-
enth component did not have any substantive meaning but
the pattern of loadings on this component corresponded fairly
closely with the item direction of keying. As such, the emer-
gence of the small seventh component in self-reports reflects
acquiescence response bias. This small factor did not emerge
in the analysis involving observer reports, a finding consis-
tent with a recently reported result indicating that acquies-
cence bias is more prominent in self-reports than in observer
reports (Ashton, de Vries, & Lee, in press).
3. We include in the “posttabloid article” sample all persons
who responded on or after June 9th, because the effect of the
tabloid articles appeared to have persisted for months, with
traffic to the hexaco.org website remaining two or three times
227. higher than before the articles appeared.
4. The pretabloid and posttabloid article samples differed in
some demographic variables. Specifically, the posttabloid
article participants were on average older (37.8 years vs. 29.8
years), slightly more likely to be men (50.4% vs. 48.4%), and
more likely to have postgraduate degrees (33.6% vs. 22.9%).
None of these differences in demographic variables could
explain the difference in the correlation between Honesty–
Humility and Agreeableness across the two samples.
5. We have previously reported self/observer agreement for the
factor scales within a large subset of this sample (see, e.g.,
Ashton et al., 2014, Table 4).
6. Item-total facet correlations as observed in the online sam-
ple are provided in the appendix found in the supplementary
materials.
References
Aghababaei, N., Wasserman, J. A., & Nannini, D. (2014). The
religious person revisited: Cross-cultural evidence from the
HEXACO model of personality structure. Mental Health,
Religion, & Culture, 17, 24-29.
Ashton, M. C., de Vries, R. E., & Lee, K. (in press). Trait
variance and
response style variance in the scales of the Personality
Inventory
for DSM-5 (PID-5). Journal of Personality Assessment.
Ashton, M. C., & Lee, K. (2001). A theoretical basis for the
major
dimensions of personality. European Journal of Personality,
15, 327-353.
228. Ashton, M. C., & Lee, K. (2007). Empirical, theoretical, and
prac-
tical advantages of the HEXACO model of personality struc-
ture. Personality and Social Psychology Review, 11, 150-166.
Ashton, M. C., & Lee, K. (2008). The prediction of honesty-
humility-related criteria by the HEXACO and five-factor
models of personality. Journal of Research in Personality,
42, 1216-1228.
Ashton, M. C., & Lee, K. (2009). The HEXACO-60: A short
measure of the major dimensions of personality. Journal of
Personality Assessment, 91, 340-345.
Ashton, M. C., & Lee, K. (2010). Trait and source factors in
HEXACO-PI-R self- and observer reports. European Journal
of Personality, 24, 278-289.
Ashton, M. C., Lee, K., & de Vries, R. E. (2014). The HEXACO
Honesty-Humility, Agreeableness, and Emotionality Factors:
A review of research and theory. Personality and Social
Psychology Review, 18, 139-152.
Ashton, M. C., Lee, K., Goldberg, L. R., & de Vries, R. E.
(2009). Higher-order factors of personality: Do they exist?
Personality and Social Psychology Review, 13, 79-91.
Ashton, M. C., Lee, K., Perugini, M., Szarota, P., de Vries, R.
E.,
Di Blas, L., . . . De Raad, B. (2004). A six-factor structure
of personality-descriptive adjectives:
229. Solution
s from psycho-
lexical studies in seven languages. Journal of Personality and
Social Psychology, 86, 356-366.
Ashton, M. C., Lee, K., Pozzebon, J. A., Visser, B. A., &
Worth,
N. C. (2010). Status-driven risk taking and the major dimen-
sions of personality. Journal of Research in Personality, 44,
734-737.
Ashton, M. C., Lee, K., Visser, B. A., & Pozzebon, J. A. (2008).
Phobic tendency within the Five-Factor and HEXACO models
of personality structure. Journal of Research in Personality,
42, 734-746.
Beer, A., & Watson, D. (2008). Asymmetry in judgments of per-
sonality: Others are less differentiated than the self. Journal
of Personality, 76, 535-560.
Bourdage, J. S., Wiltshire, J., & Lee, K. (2015). Personality and
workplace impression management: Correlates and implica-
230. tions. Journal of Applied Psychology, 100, 537-546.
Chirumbolo, A., & Leone, L. (2010). Personality and politics:
The
role of the HEXACO model of personality in predicting ide-
ology and voting. Personality and Individual Differences, 49,
43-48.
Cohen, T. R., Panter, A. T., Turan, N., Morse, L., & Kim, Y.
(2014).
Moral character in the workplace. Journal of Personality and
Social Psychology, 107, 943-963.
Cohen, T. R., Wolf, S. T., Panter, A. T., & Insko, C. A. (2011).
Introducing the GASP scale: A new measure of guilt
and shame proneness. Journal of Personality and Social
Psychology, 100, 947-966.
Costa, P. T., Jr., & McCrae, R. R. (1992). Revised NEO
Personality
Inventory (NEO-PI-R) and NEO Five-Factor Inventory
(NEO-FFI) professional manual. Odessa, FL: Psychological
Assessment Resources.
De Raad, B., Barelds, D. P., Timmerman, M. E., De Roover, K.,
231. Mlačić, B., & Church, A. T. (2014). Towards a pan-cultural
personality structure: Input from 11 psycholexical studies.
European Journal of Personality, 28, 497-510.
De Vries, R. E. (2013). The 24-item brief HEXACO Inventory
(BHI). Journal of Research in Personality, 47, 871-880.
De Vries, R. E., Realo, A., & Allik, J. (2016). Using personality
item characteristics to predict single-item reliability, retest
reliability, and self-other agreement. Manuscript submitted
for publication.
DeYoung, C. G., Quilty, L. C., & Peterson, J. B. (2007).
Between
facets and domains: 10 Aspects of the Big Five. Journal of
Personality and Social Psychology, 93, 880-896.
556 Assessment 25(5)
Donnellan, M. B., Oswald, F. L., Baird, B. M., & Lucas, R. E.
(2006). The mini-IPIP scales: Tiny-yet-effective measures of
the Big Five factors of personality. Psychological Assessment,
18, 192-203.
232. Gaughan, E. T., Miller, J. D., & Lynam, D. R. (2012).
Examining
the utility of general models of personality in the study of
psychopathy: A comparison of the HEXACO-PI-R and NEO
PI-R. Journal of Personality Disorders, 26, 513-523.
Hilbig, B. E., & Zettler, I. (2009). Pillars of cooperation:
Honesty–
Humility, social value orientations, and economic behavior.
Journal of Research in Personality, 43, 516-519.
Hilbig, B. E., & Zettler, I. (2015). When the cat’s away, some
mice will play: A basic trait account of dishonest behavior.
Journal of Research in Personality, 57, 72-88.
Jackson, D. N. (1978). Interpreter’s guide to the Jackson
Personality Inventory. In P. McReynolds (Ed.), Advances in
psychological assessment (Vol. 4, pp. 55-102). San Francisco,
CA: Jossey-Bass.
John, O. P., & Srivastava, S. (1999). The Big Five trait taxon-
omy: History, measurement, and theoretical perspectives. In
L. A. Pervin & O. P. John (Eds.), Handbook of personality:
Theory and research (2nd ed., pp. 102-138). New York, NY:
233. Guilford Press.
Lee, K., & Ashton, M. C. (2004). Psychometric properties of the
HEXACO Personality Inventory. Multivariate Behavioral
Research, 39, 329-358.
Lee, K., & Ashton, M. C. (2006). Further assessment of the
HEXACO Personality Inventory: Two new facet scales and
an observer report form. Psychological Assessment, 18,
182-191.
Lee, K., & Ashton, M. C. (2008). The HEXACO personality
factors in the indigenous personality lexicons of English
and 11 other languages. Journal of Personality, 76,
1001-1053.
Lee, K., & Ashton, M. C. (2012a). Getting mad and getting
even: Agreeableness and Honesty-Humility as predictors of
revenge intentions. Personality and Individual Differences,
52, 596-600.
Lee, K., & Ashton, M. C. (2012b). The H factor of personality:
Why some people are manipulative, self-entitled, materi-
alistic, and exploitive—And why it matters for everyone.
Waterloo, Ontario, Canada: Wilfrid Laurier University
234. Press.
Lee, K., & Ashton, M. C. (2013). Prediction of self- and
observer
report scores on HEXACO-60 and NEO-FFI scales. Journal
of Research in Personality, 47, 668-675.
Lee, K., Ashton, M. C., Wiltshire, J., Bourdage, J. S., Visser, B.
A., & Gallucci, A. (2013). Sex, power, and money: Prediction
from the Dark Triad and Honesty–Humility. European
Journal of Personality, 27, 169-184.
Marsh, H. W., Morin, A. J., Parker, P. D., & Kaur, G. (2014).
Exploratory structural equation modeling: An integration
of the best features of exploratory and confirmatory fac-
tor analysis. Annual Review of Clinical Psychology, 10,
85-110.
McCrae, R. R., Kurtz, J. E., Yamagata, S., & Terracciano, A.
(2011). Internal consistency, retest reliability, and their impli-
cations for personality scale validity. Personality and Social
Psychology Review, 15, 28-50.
McKay, D. A., & Tokar, D. M. (2012). The HEXACO and
five-factor models of personality in relation to RIASEC
235. vocational interests. Journal of Vocational Behavior, 81,
138-149.
Noftle, E. E., & Robins, R. W. (2007). Personality predictors of
academic outcomes: Big Five correlates of GPA and SAT
scores. Journal of Personality and Social Psychology, 93,
116-130.
Paunonen, S. V. (1997). On chance and factor congruence fol-
lowing orthogonal Procrustes rotation. Educational and
Psychological Measurement, 57, 33-59.
Romero, E., Villar, P., & López-Romero, L. (2015). Assessing
six factors in Spain: Validation of the HEXACO-100 in rela-
tion to the Five Factor Model and other conceptually rel-
evant criteria. Personality and Individual Differences, 76,
75-81.
Saroglou, V., Pichon, I., Trompette, L., Verschueren, M., &
Dernelle, R. (2005). Prosocial behavior and religion: New
evidence based on projective measures and peer ratings.
Journal for the Scientific Study of Religion, 44, 323-348.
Schönemann, P. H. (1966). A generalized solution of the
orthogo-
236. nal Procrustes problem. Psychometrika, 31, 1-10.
Sibley, C. G., Luyten, N., Purnomo, M., Mobberley, A.,
Wootton,
L. W., Hammond, M. D., . . . West-Newman, T. (2011). The
Mini-IPIP6: Validation and extension of a short measure
of the Big-Six factors of personality in New Zealand. New
Zealand Journal of Psychology, 40, 142-159.
Thalmayer, A. G., Saucier, G., & Eigenhuis, A. (2011).
Comparative validity of brief to medium-length Big
Five and Big Six personality questionnaires. Psychological
Assessment, 23, 995-1009.
Thielmann, I., Hilbig, B. E., Zettler, I., & Moshagen, M. (2016).
On measuring the sixth basic personality dimension: A com-
parison between HEXACO Honesty-Humility and Big Six
Honesty-Propriety. Assessment. Advance online publication.
doi:10.1177/1073191116638411
Weller, J. A., & Thulin, E. W. (2012). Do honest people take
fewer risks? Personality correlates of risk-taking to achieve
gains and avoid losses in HEXACO space. Personality and
Individual Differences, 53, 923-926.
237. Winterstein, B. P., Silvia, P. J., Kwapil, T. R., Kaufman, J. C.,
Reiter-
Palmon, R., & Wigert, B. (2011). Brief assessment of schizo-
typy: Developing short forms of the Wisconsin Schizotypy
Scales. Personality and Individual Differences, 51, 920-924.
Zettler, I., Hilbig, B. E., & Haubrich, J. (2011). Altruism at the
ballots: Predicting political attitudes and behavior. Journal of
Research in Personality, 45, 130-133.
Zettler, I., Hilbig, B. E., & Heydasch, T. (2013). Two sides of
one coin: Honesty-Humility and social factors mutually shape
social dilemma decision making. Journal of Research in
Personality, 47, 286-295.
Qual Quant (2013) 47:2025–2047
DOI 10.1007/s11135-011-9640-9
Determinants of social desirability bias in sensitive
surveys: a literature review
Ivar Krumpal
239. survey designers could generate
more valid data by selecting appropriate data collection
strategies that reduce respondents’
discomfort when answering to a sensitive question.
Keywords Sensitive questions · Social desirability bias · Survey
design ·
Survey Methodology · Measurement error
1 Introduction
An increasing number of survey statisticians and social
scientists focus on the investigation
of social taboos, illegal behavior and extreme opinions.
Different national surveys contain
item batteries asking about sensitive information. For example,
the German General Social
Survey (ALLBUS) 2000 asked interviewees to self-report on
following four minor offences:
(1) using public transportation without buying a valid ticket, (2)
driving a car with more
than the permitted level of blood alcohol, (3) taking goods from
a department store without
paying, and (4) deliberately making false statements on tax
forms in order to pay less. Other
240. I. Krumpal (B)
Department of Sociology, University of Leipzig, Beethovenstr.
15, 04107 Leipzig, Germany
e-mail: [email protected]
123
2026 I. Krumpal
surveys, like the US National Crime Victimization Survey
(NCVS) or the European Crime
and Safety Survey (EU ICS), ask questions on sensitive topics
like experiences with criminal
victimization. Recently, a national study on right-wing
extremism was conducted in Ger-
many, collecting data on socially undesirable attitudes like anti-
Semitism, xenophobia, and
chauvinism (Decker and Brähler 2006). In Switzerland, the
Swiss Multicenter Adolescent
Survey on Health (SMASH) 2002 asked 16–20 years old youths
about their use of illicit
drugs, and their drinking and smoking habits. To cite a last
example, the US General Social
241. Survey (GSS) monitors the sexual activity of the population and
also asks about very sen-
sitive topics like prostitution (‘Thinking about the time since
your 18th birthday, have you
ever had sex with a person you paid or who paid you for sex?’)
or infidelity (‘Have you ever
had sex with someone other than your husband or wife while
you were married?’). Obtain-
ing valid and reliable data on the basis of such items has proven
to be a difficult business
and the possibilities of doing so continues to be a lively
research activity. Survey method-
ologists’ state-of-the-art knowledge suggests that answers to
sensitive questions are often
distorted by social desirability bias. The first section of this
article reviews the main theoret-
ical explanations regarding the process of self-reporting in
sensitive surveys. ‘Sensitivity’ is
a complex theoretical concept whose dimensions are identified
and discussed. Next, psycho-
logical mechanisms are presented, relating ‘sensitivity’ to other
theoretical constructs and to
different aspects of data quality. The review focuses on the
behavior of both main actors of
a survey interview, the respondent and the interviewer, and
242. discusses how survey response
is affected by (a) perceived gains, risks and losses of the
respondent and (b) the behavior
of the interviewer. The second section reviews empirical
findings on the effectiveness of
different survey methods (such as randomized response or the
unmatched count technique)
on the respondent’s propensity to misreport in sensitive surveys
and outlines future research
perspectives.
2 Sensitivity and social desirability: defining the concepts
For the term ‘sensitivity’ different conceptualizations can be
observed in the survey literature
(Lee 1993). One approach is post hoc assessment of sensitivity
via empirical indicators of
survey quality (Lensvelt-Mulders 2008; Tourangeau and Yan
2007). For example, questions
that are supposed to be sensitive are often associated with
comparatively higher item non-
response rates than non-sensitive questions. Table 1 summarizes
item nonresponse rates for
selected items, taken from the German General Social Survey
(ALLBUS). The questions
243. were administered to a national random sample from all German
speaking persons who
resided in private households in Germany and were 18 years old
or older:
Table 1 shows that some items (household net income and
voting intention) have consis-
tently more missing data than other items (religious
denomination, educational attainment,
membership of a trade union, employment status and age).
Against the background of the
assumption ‘the more sensitive the item is the higher item
nonresponse will be’ it seems
apparent that the income question has the highest sensitivity of
all items with nonresponse
rates ranging from 20.7 to 26.2%. In contrast, questions asking
about employment status and
age seem to have the lowest sensitivity with proportions of
missing data ranging from 0.0 to
0.4% for age and from 0.1 to 0.2% for employment status
respectively.
Other empirical approaches ask respondents to assess the
sensitivity of survey items on
specific rating-scales (Bradburn and Sudman 1979; Coutts and
244. Jann 2011). Recently, Coutts
and Jann (2011, p. 184) carried out an online survey study that
asked 2,075 respondents
from a German access panel to rate several petty offences
(keeping to much change, freerid-
123
Determinants of social desirability bias in sensitive surveys
2027
Table 1 Rates of item nonresponse (%) for the German general
social survey ALLBUS, selected years and
items
Topic ALLBUS 1990 (%) ALLBUS 2000 (%) ALLBUS 2006
(%)
Household net-income 26.2 23.5 20.7
Voting intentiona 14.4 22.7 14.2
Religious denomination 0.4 0.7 0.5
245. Educational attainment 0.8 0.3 0.2
Membership of a trade union 1.7 0.2 0.4
Employment status 0.1 0.2 0.1
Age 0.4 0.0 0.3
Data was either collected by PAPI—paper and pencil
interviewing (ALLBUS 1990 and 2000), CAPI—com-
puter assisted personal interviewing (ALLBUS 2000 and 2006),
or CASI—computer assisted self interviewing
(ALLBUS 2006)
a Statistic includes answer category ‘don’t know’
ing, shoplifting, marihuana use and drunk driving) and immoral
activities (to cheat on one’s
partner). For each item, a total sensitivity score was calculated
by adding the proportions of
interviewees who stated (1) that the behavior in question is not
alright, and (2) that admitting
it would be uncomfortable for most. The most sensitive topics
turned out to be shoplifting
(79%) and infidelity (73%). These were followed by drunk
246. driving (53%) and marijuana use
(43%), both with medium sensitivity scores. In contrast,
freeriding (22%) and keeping too
much change (20%) were considered as topics with lower
sensitivity.
Theory-driven approaches try to distinguish different aspects of
the theoretical construct
‘sensitivity’. According to Lee and Renzetti a topic labeled
‘sensitive’ is one that “potentially
poses for those involved a substantial threat, the emergence of
which renders problematic for
the researcher and/or the researched, the collection, holding,
and/or dissemination of research
data” (Lee and Renzetti 1993, p. 5). They argue that research on
sensitive topics seems to be
linked with risks and costs, such as negative feelings of shame
and embarrassment or nega-
tive consequences, such as the possibility of sanctions. Finally,
they strongly emphasize the
social dimension of sensitivity: “In other words, the sensitive
character of a piece of research
seemingly inheres less in the topic itself and more in the
relationship between that topic and
the social context within which the research is conducted” (Lee
247. and Renzetti 1993, p. 5).
Another useful specification of the concept ‘sensitivity’ is
introduced by Tourangeau and
Yan (2007). They distinguish between three distinct aspects of
the term ‘sensitivity’:
1. The first dimension is ‘intrusiveness’ and refers to the fact
that within a given culture
certain questions per se may be perceived as too private or
taboo, independent of the
respondents’ true status on the variable of interest. Questions
asking about the respon-
dents’ sexual preferences, health status or income are often
perceived as too intrusive.
2. The second dimension is ‘threat of disclosure’, pertaining to
respondents’ concerns about
possible risks, costs or negative consequences of truthfully
reporting a sensitive behavior
should the sensitive answers become known to third persons or
institutions beyond the
survey setting. Such negative consequences could be: job loss,
family upset or even pros-
ecution. Questions asking the respondent to self-report illegal
248. behavior (e.g. employee
theft, tax fraud or illegal entry in surveys of immigrants) may
fall into this category.
3. The third dimension is ‘social desirability’. This dimension
refers to truthfully reporting
an attitude or behavior that clearly violates existing social
norms and thus is deemed unac-
ceptable by society. To conform to social norms, respondents
may present themselves in a
123
2028 I. Krumpal
positive light, independent of their actual attitudes and true
behaviors respectively. More
specifically, ‘social desirability’ refers to the respondents’
tendency to admit to socially
desirable traits and behaviors and to deny socially undesirable
ones. Finally, socially
desirable answers could also be conceptualized as respondents’
temporary social strate-
249. gies coping with the different situational factors in surveys (e.g.
presence of interviewer,
topic of question, etc.).
Unlike ‘intrusiveness’, the problem associated with ‘social
desirability’ is not the sen-
sitivity of a question but the sensitivity of an answer. Fowler
(1995, p. 29) summarizes
this issue as follows: “Questions tend to be categorized as
‘sensitive’ if a ‘yes’ answer is
likely to be judged by society as undesirable behaviour.
However, for those for whom the
answer is ‘no’ questions about any particular behaviour are not
sensitive.” Whereas answers
suggesting deviations from social norms are seen socially
undesirable, self-reports suggest-
ing norm-conforming behaviors are considered socially
desirable associated with expected
gains such as social approval of the interviewer. Given that,
respondents tend to underre-
port socially undesirable behavior and overreport socially
desirable behavior. They distort
their answers towards the social norm in order to maintain a
socially favorable self-presen-
tation (an overview of the literature of social norms can be
250. found in Rauhut and Krumpal
2008).
Two sub-dimensions of the concept ‘social desirability’ are
often distinguished (Randall
and Fernandes 1991): One sub-dimension refers to social
desirability as a stable personality
characteristic, such as a constant need for social approval and
impression management, to
cause socially desirable misreporting (Crowne and Marlowe
1960, 1964; DeMaio 1984).
A strong approval motive and an invariant desire to generate a
positive image may thus
reduce the interviewee’s willingness to disclose self-
stigmatizing information. By contrast,
the second sub-dimension refers to social desirability as an item
characteristic, considering
various activities or attitudes to be more or less socially
undesirable and thus relates perceived
desirability of a behavior to particular items. Thus, effects of
social desirability are strongly
influenced by characteristics of a specific item (Groves 1989).
Social desirability refers to making oneself look good in terms
of prevailing cultural
251. norms when answering to specific survey questions. However,
the general need for social
approval and impression management may vary with specific
subgroup norms (Johnson and
van de Vijver 2002; Lee and Renzetti 1993). Furthermore, the
tendency to give socially
desirable responses may vary across cultural orientations like
collectivistic cultures that
emphasize good relationships with other group members versus
individualistic orientations
that set value on the pursuit of one’s personal values, attitudes
and goals (Lalwani et al.
2006).
3 Response error and other types of survey errors
Questions asking about sensitive topics are assumed to generate
response errors thus hav-
ing a negative impact on data quality. Before investigating how
sensitive questions increase
the likelihood of response errors, especially response bias, it is
important to define the terms
‘response error’ and ‘response bias’ and distinguish these
concepts from other types of survey
errors. Useful typologies of survey errors can be seen in Fox
252. and Tracy (1986) and Groves
et al. (2004). One fundamental distinction classifies survey
errors as either sampling errors
or nonsampling errors.
The first class of survey error, sampling error, arises from the
fact that only a subset of
all potential respondents in the sampling frame is actually
measured. The survey methodol-
123
Determinants of social desirability bias in sensitive surveys
2029
ogy literature distinguishes two types of sampling errors:
sampling variance and sampling
bias (Groves et al. 2004, p. 57). Sampling variance arises from
the fact that by a random
process many different samples each with different subsets of
elements could be drawn from
the population under investigation. Each possible sample will
produce different estimates on
253. the survey statistic. Sampling bias can result from the
possibility that certain subgroups in the
target population are not represented (or underrepresented) in
the sampling frame thus the
selection process excluding them systematically. To the extent
that excluded members differ
from included members on key variables of the survey, the
survey statistics will systematically
deviate from the true parameters of the target population.
The second class of error, nonsampling error, is much more
relevant in sensitive sur-
veys (Fox and Tracy 1986, p. 8). One type of error in this class
is nonresponse error, which
refers to differences between the values of statistics computed
on the basis of the entire
sample and statistical estimates based only on the actual
respondent subset of the sample.
Another type of nonsampling error is response error. This kind
of error arises from an obser-
vational gap between the true score of a respondent and the
actual answer provided (Marquis
et al. 1981, pp. 2–8). Response error is derived from the
observation process itself, the term
‘response error’ is often used synonymously with ‘measurement
254. error’. Each specific type
of nonsampling error can be separated into a random part, which
reduces the reliability of
measurements and a nonrandom part introducing bias into
survey estimates. The system-
atic part of nonresponse error is often labeled ‘nonresponse
bias’ representing systematic
differences between respondents and nonrespondents.
Technically, nonresponse bias for the
sample mean is defined as the product of the nonresponse rate
and the difference between
the nonrespondent and the respondent mean. The nonresponse
rate is “the proportion of eli-
gible sample elements for which data are not collected” (Groves
et al. 2004, p. 59). When
nonresponse (e.g. refusals to answer a sensitive question) is
related to key variables of the
survey (e.g. sensitive behavior to be measured) the results may
be no longer valid. Addi-
tionally, the standard error of the estimates becomes greater as
the sample size becomes
smaller.
The basic distinction between random and systematic error can
also be applied to response
255. error, the best documented source of error in sensitive surveys.
The formal notation of
response error on an individual level decomposes an answer Ai t
of respondent i on occasion
t into three components (Tourangeau et al. 2000, pp. 266–267):
1. The first is the true score Ti , which represents the
respondent’s actual status on the var-
iable in question. Respondents’ true scores can sometimes be
determined via external
data sources like medical or administrative records.
2. The second reflects any general directional tendency across
respondents to misreport,
more specifically to underreport socially undesirable activities
and to overreport socially
desirable activities respectively. This component is called bias
b. Response bias is “a
systematic tendency to respond to a range of questionnaire
items on some other basis
than the specific item content” (Paulhus 1991, p. 17).
3. The third component, random error ei t , is directionless with
an expected value assumed
to be zero: E (ei t ) = 0. This error component varies between
256. respondents and between
occasions within a single respondent:
Ai t = Ti + b + ei t
If b �= 0, survey measurements of the respondent’s true status
are no longer valid. Whereas
random error cancels out over repeated measurements, response
bias does not. Rather, the
systematic difference between observed scores and true scores
persists.
123
2030 I. Krumpal
There is ample empirical evidence that respondents
systematically overreport socially
desirable behaviors and attitudes and systematically underreport
socially undesirable ones
(Barnett 1998; Lee 1993; Tourangeau et al. 2000; Beyer and
Krumpal 2010). For example,
underreporting is quite common for socially undesirable