SlideShare a Scribd company logo
1 of 45
· Select one ethical marketing issue suggested by a review, of
any recent article from a non-academic periodical (e.g. LA
Times, Wall St. Journal, Business Week, etc.).
· In the 2-page paper, briefly:
· describe the ethical issue (2-3 sentences),
· discuss the implications for one marketing decision (target
market, product, pricing, promotion, distribution)
· include the full article upon which your paper is based. Staple
to the back of the paper.
https://www.entrepreneur.com/article/314011
Personality impression formation: a correlational-
experimental design*
JOHN T. PARTINGTON
Brock University
LOUISE CLARKE
University of Western Ontario
ABSTRACT
A correlational-experimental design was used to study
personality impression forma-
tion. Subjects rated how they would accept a number of
hypothetical stimulus people
represented by combinations of self-referent statements
denoting opposite poles of
four personality dimensions. They also gave self-endorsement
responses to a person-
ality battery which sampled the same four dimensions.
Perceivers were classified into
personality types defining levels of a subject's factor which
together with four
stimulus cue factors comprised a complete factorial design for
analyzing l i e accep-
tance ratings. Although the main experimental results suggested
that stimulus cue
integration may be more linear than configural, the nature of
subject-cue interactions
illustrated the need for more representative design in social
perception research.
The present investigation focussed on how people form
impressions of
others based on limited stimulus information. Asch's (1946)
pioneering
studies on this problem suggested that people appear to combine
stimulus
cues configurally and that certain traits are more central than
others in
determining impressions. However, subsequent work within the
Asch
paradigm yielded conflicting findings regarding trait centrality
(e.g.,
Kelley, 1950; Wishner, 1960). In addition, considerable
evidence favouring
more parsimonious linear models of impression formation has
also been
obtained (Anderson, 1962; Triandis & Fishbein, 1963;
Goldberg, 1968),
even under widely varied stimulus conditions (Partington,
1967). Not-
withstanding this, it is conceivable that die "fit" between such
simple
models and obtained impression formation data may be a design
artifact.
That is, the predictive power of these simple linear models may
have
been a function of "rigorous" experimental paradigms which
varied
stimulus cues in a controlled manner while holding constant
other poten-
tially important covariates such as perceiver characteristics,
nature of the
responses obtained, and situational effects (cf., Bieri, Atkins,
Briar, Lea-
man, Miller, & Tripodi, 1966).
The purpose of the present study was to determine how different
types
of perceivers would utilize and integrate information when
forming im-
" This research was supported by Canada Council Grant 68-
0667 and by the
University of Western Ontario Research Fund. Thanks are also
due D. N. Jackson
for granting permission to use subscales from the Personality
Research Form.
CANAD. J. BEHAV. SCI./REV. CANAD. SCI. OOMF., 3 ( 1 ) ,
1971
4 8 J . T. PARTINGTON & L. CLARKE
pressions of different types of stimulus people. A combined
correlational-
experimental design was used (cf., Owens, 1968). Correlational
proce-
dures were required to classify perceivers into personality types
(Nunally,
1967). These types were then included as levels of a "subjects"
factor in
a complete factorial ANOVA design developed for studying cue
utilization
in social and clinical judgments (Anderson, 1962, 1969;
Hoffman, Slovic,
& Rorer, 1968). Since the sets of cues representing the
experimental
stimuli were selected from the same personality dimensions
used to clas-
sify the perceivers, this design made it possible to evaluate the
relative
effects of perceiver-stimuli interactions, as well as the effects
of stimulus
cues separately and in combination.
METHOD
Subjects
Sixty-two University of Western Ontario undergraduates
comprised the original
sample. They were selected from the introductory psychology
subject pool to avoid
possible contamination due to familiarity with measures used in
die study. Males
and females were equally represented.
Materials
A paper and pencil questionnaire was developed which included
demographic items,
a personality battery, and a social judgment section. The
personality battery com-
prised three 20 item scales, Dominance, Order, and Affiliation,
from the Personality
Research Form A (Jackson, 1967), plus a 10 item Masculinity
(mf) scale from the
MMPI. The social judgment section required Ss to indicate the
degree to which they
themselves, and others, would accept each of a number of
hypothetical stimulus people.
Stimulus People
Each hypothetical stimulus person was described in terms of
four self-referent state-
ments. These statements represented the same four personality
dimensions sampled
by the personality battery described above. These dimensions
are not only representa-
tive but also relatively independent (Lay & Jackson, 1969).
Table 1 lists the stimulus
items together with their operating characteristics. It may be
seen that the items
were selected according to high denotative relevance, moderate
evaluative connota-
tions (Mean absolute deviation from neutral: Denotation x =
2.1; Connotation
X = 0.75; t = 6.83, p < 0.001), and moderate endorsement
frequencies. The hypo-
thetical stimulus people were represented by all possible
combinations of the stimulus
items in a completely crossed factorial design. Thus there was a
set of 16 stimuli
(2*) since each pole of the four personality dimensions was
represented (e.g.,
Dominance-Submission). Two example stimuli are given below:
1. I go out of my way to meet people; I enjoy reading love
stories; I think it is
better to be quiet than assertive; I often decide ahead of time
exactly what I
will do on a certain day.
2. Most of the dungs I do have no system to them; I have
relatively few friends;
I like adventure stories better than romantic stories; I am quite
good at keeping
others in line.
PERSONALITY IMPRESSION FORMATION 49
TABLE 1
Operating characteristics of the stimulus items
Characteristics
Dimensions
Masculinity
Order
Dominance
Affiliation
Items
I like adventure stories
better than romantic stories
I enjoy reading love stories
I often decide ahead of time
exactly what I will do on a
certain day
Most of the things I do have
no system to them
I am quite good at keeping
others in line
I think it is better to be
quiet than assertive
I go out of my way to meet
people
I have relatively few friends
Denotative
1.7
6.6
6.3
1.7
6.1
2.4
6.0
2.3
Connotative
4.6
3.9
2.9
5.0
3.4
4.2
2.6
5.0
Endorsement
frequency
.59
.56
.63
.78
.50
.55
.37
.55
Note. Denotative and connotative item weights are 7-point scale
averages. Denotative
values reported in Partington (1966). Connotative values and
endorsement frequencies
compiled by D. N. Jackson and A. Conger based on University
of Western Ontario
samples.
Careful counterbalancing was undertaken to avoid possible
intrastimulus and inter-
stimulus order effects. The former was accomplished by taking
a stratified sample of
16 permutations from the 24 possible permutations of the four
personality dimen-
sions to be represented. These 16 were then reviewed to ensure
that each pole of
each personality dimension would occur first and last exactly
twice in the person
descriptions. Interstimulus order effects were counterbalanced
by creating two dif-
ferent orderings of the 16 stimuli and nesting one within the
other. This resulted in
a total of 32 stimuli-to-be-judged.
Dependent Measures
Subjects were required to indicate on a 7-point scale how they
themselves (Own-ac-
ceptance) and how others in general (Others-acceptance) would
accept each of die
hypothetical stimulus people. The poles of the acceptance scale
were defined as fol-
lows: "This person would be readily acceptable as a friend;"
"This person would be
completely rejected." This social distance continuum was used
because of its poten-
tial for involving Ss personally in the judgment task. Own-
acceptance was die pri-
mary dependent measure. The Others-acceptance set was
included to provide Ss with
the opportunity to express their conception of a "normative"
and/or desirable response.
This multi-set response format was designed to enhance the
probability of obtaining
idiosyncratic Own-acceptance judgments relatively free from
response styles.
5 0 J . T. PABTINGTON tc L. CLABKE
Procedure
Subjects were tested in groups of 10-20 each. Several steps
were incorporated to re-
duce the possibility that Ss might be alienated by die
standardized testing procedure
(cf., Argyris, 1968) and to lessen possible boredom, fatigue, and
defensiveness (cf.,
Loevinger, 1957). First, instructions were in the form of a client
contract (LoveH,
1967) which emphasized reciprocal openness between the £ and
S. A realistic set was
attempted by encouraging Ss to consider the stimulus people as
potentially real, and
by requiring Ss to indicate how they themselves would accept
each stimulus person
"as a friend." Finally, personal involvement was fostered by
requiring Ss to respond
to the personality battery before undertaking the social
judgments. In addition, to
insure optimum freedom for Ss to communicate to the E how
they felt about their
social judgments, a "Certainty" scale and a space for
"Comments" was provided beside
each stimulus-to-be-judged.
BESULTS
Subjects were classified into types based on similarities in their
own per-
sonality profiles, and their impression responses toward a
number of
hypothetical stimulus people represented in terms of die same
dimensions
of personality were analyzed.
Classification of subjects' personality profiles was
accomplished by
"obverse" principal components of sums of squares and cross-
products
between subjects (Nunally, 1967). Examination of the
distribution of re-
sulting eigenvalues revealed a marked drop after the second
value. This
suggested that the first two "Subjects" factors adequately
represented
covariation in the original matrix. These factors were rotated to
simple
structure according to die Varimax criteria (Harman, 1960).
Subjects with
high loadings (above the median) on the first rotated factor and
low
loadings (below the median) on the second rotated factor were
classified
as Type i. Subjects with a reverse pattern of loadings were
classified as
Type n. Those with approximately equal loadings on each factor
were
eliminated from further analysis. This procedure resulted in 25
Type i
and 24 Type n subjects. Results of a discriminant analysis
(Anderson,
1958) confirmed that Types I and n were clearly separable (D2
= 21.9,
p < 0.001), especially in terms of their Dominance and
Orderliness (per
cent Contribution to D* = 65 and 23 respectively). Separate
analysis of
demographic items showed that these subsamples also differed
in sex
representation (Males: Type i = 40 per cent, Type n = 83 per
cent, x2
= 5.2, p< 0.05).
To determine how subjects formed impressions of the stimulus
people,
a five-way ANOVA was performed on the Own acceptance data.
The nested
replications were combined and processed on the University of
Western
Ontario BBM 7040 system according to BALANOVA using the
approximate
unweighted means method (Winer, 1962, pp. 224-227). The
independent
PERSONALITY IMPRESSION FORMATION 5 1
variables under consideration were represented by die following
two-level
fixed factors: Affiliation (Friendly-Unfriendly); Orderliness
(Orderly-
Disorderly); Dominance (Dominant-Submissive); Masculinity
(Male
interest-Female interest); and Subjects (Type i-Type n ) . Main
effects of
all stimulus cues for the total sample were significant and
variance esti-
mates (Hays, 1963) indicated the following rank order of
salience: Affilia-
tion ( F = 82.30, df = 1,1536, p < 0.01, to2 = 0.31); Orderliness
( F =
72.17, df = 1,1536, p < 0.01, to2 = 0.27); Dominance ( F =
29.07, df =
1,1536, p < 0.01, to2 = 0.10; and Masculinity ( F = 18.49, df =
1,1536, p <
0.01, ttf2 = 0.05). Most noteworthy, however, was the complete
absence of
significant interactions among the stimulus cues.
Main effects were significant for the Subjects factor with Type i
sub-
jects indicating relatively greater acceptance of the stimulus
people ( F =
24.00, df = 1,1536, p < 0.01). The major source of this
difference was a
subject type-by-Masculinity cue interaction (F = 12.77, df =
1,1536, p
< 0.01), cell means of which suggest that Type i subjects
expressed
greater acceptance of those represented with a Feminine interest
cue than
did Type n subjects.
Validity of these results was inferred from a comparison of
correlations
between sum totals of the connotative values of die items
representing
each stimulus person and the average "Own" and "Others"
acceptance
judgments of each group. The following values clearly indicate
that the
Own acceptance judgments of both groups were significantly
less asso-
ciated with item connotation than were the Others acceptance
judgments:
Type i - O w n (0.75), Others (0.90) (t = 7.38, p < 0.01); Type n
- O w n
(0.43), Others (0.82) (t = 9.59,p < 0.01). This suggests that the
findings
in this study may be considered representative of subjects'
idiosyncratic
Own acceptance judgments. It also confirms die utility of a
multi-set
response procedure for social perception studies.
DISCUSSION
This investigation of personality impression formation involved
a corre-
lational-experimental design in which subjects were classified
in terms of
the same personality dimensions as those used to represent the
experi-
mental stimuli. Results suggested that subjects' impression
responses were
determined by individual stimulus cues rather than by
combinations of
cues. That is, they appeared to operate as though traits in other
people
function independently. Moreover, subjects seemed to be
relatively more
influenced by some cues, for example those denoting
friendliness, than by
other cues. Such findings are consistent with a growing body of
evidence
which points toward "weighted linear" as opposed to
"configural" inter-
52 J . T. FART1NGTON & L. CLARKE
pretations of impression formation (Anderson, 1968; Goldberg,
1968).
They also confirm previous evidence concerning the centrality
of the
warm-cold dimension for social perception (Asch, 1946; Kelley,
1950).
In addition to these experimental effects, a subject type-by-
Masculinity
cue interaction was evident. Cell means indicated that
submissive, orderly
Type i subjects appeared more willing to accept those
represented as
enjoying reading love stories than did the dominant, less orderly
Type n
subjects. This interaction, while understandable in terms of the
measured
personality differences between the two groups, may have been
mediated
by significant differences in actual sex representation in the
groups since
there were 40 per cent males in the Type i classification and 83
per cent
in Type n. Certainly it makes just as much sense to think of
male and
female groups expressing different acceptance toward someone
who likes
to read love stories as it does to consider the same finding in
terms of
differences in dominance and/or orderliness between the groups.
In any
event, this interpretation is consistent with the observation that
sex has
frequently been found to be a potent moderator variable in
person per-
ception (Schrauger & Altrocchi, 1964).
The absence of other possible perceiver-perceived interactions
invites
comment even at the risk of Type n error: For example, why
were not
the dominant Type n subjects relatively more attracted to the
submissive
stimulus people? Or, why did not the orderly Type i subjects
respond
more favourably to the orderly stimulus people than did the less
orderly
Type n subjects? Both substantive and methodological
explanations may
be considered. On the one hand, it is possible that models of
interpersonal
attraction involving need-complementarity or similarity (e.g.
Winch, 1958;
Newcomb, 1961) simply may not be tenable. However, the
scope of the
present study precludes such a firm conclusion. An alternative
explanation
concerns the nature of the information used to represent
stimulus people,
and the kinds of measures used to differentiate perceiver types.
Specific-
ally, it is an open question whether such items as, I often decide
ahead of
time exactly what I will do on a certain day, and, I am quite
good at
keeping others in line, are sufficiently potent to transmit a
satisfactory
image of Orderly and Dominant people respectively. Equally
questionable
is the representativeness of information about subjects yielded
by true-
false psychometric devices which purport to reflect basic
personality traits.
This line of reasoning raises the possibility that the obtained
interaction
might have been different in degree had the actual sex of the
stimulus
people been represented. Other possibilities also come to mind.
For ex-
ample, would a "complementary-needs" interaction have
occurred had the
dominance of the perceivers and the submissiveness of those
perceived
PERSONALITY IMPRESSION FORMATION 53
been assessed and described in other than psychometric terms,
such as
demographically or via audio-visual channels?
In closing, it is suggested that Brunswick's (1947) conception of
repre-
sentative design be reincarnated for studying impression
formation. It is
conceivable that with richer stimulus information subsequent
investiga-
tions may obtain quite different results, just as more general
conditions of
social judgment have yielded less simple impression strategies
(Partington
& Jackson, 1968).
RESUME
Etude corr61ationnelle-experimentale sur la maniere dont on se
forme une impression
sur la personnalite d'autnd. Les sujets doivent estimer comment
ils accepteraient
certaines personnes-stunuli hypothetiques representees par des
constellations d'enonces
auto-descriptifs denotant les poles opposes de quatre
dimensions de la personnalite.
Us doivent egalement dormer des reponses d'auto-acceptation
aux item d'une batterie
de personnalite cemant les memes quatre dimensions. Les sujets
sont repartis en
types de personnalite constituant les differents niveaux d'un
facteur lie au sujet: les
relations de ce facteur avec les quatre faeteurs lies aux indices
stimuli donnent lieu
a un plan factoriel complet servant a l'analyse des jugements
d'acceptation. Meme si
les principaux resultats expenmentaux suggerent que
l'integration des indices stimuli
soit plus lineaire que configurationnelle, la nature des
interactions sujet-indices illustre
la necessite d'un modele plus representatif dans les recherches
en perception sociale.
REFERENCES
ANDERSON, N.H. Application of an additive model to
impression formation. Science,
1962, 138, 817-818.
ANDERSON, N.H. A simple model for information integration.
In R. P. Ableson,
E. Aronson, W. J. McGuire, T. M. Newcomb, M. J. Rosenberg,
and P. H. Tannen-
baum (eds.), Theories of Cognitive Consistency: A Sourcebook.
Chicago: Rand
McNally, 1968.
ANDEBSON, N.H. Comment on "An analysis of variance model
for die assessment of
configural cue utilization in clinical judgment.'' Psychological
Bulletin, 1969, 72,
63-65.
ANDERSON, T.W. An introduction to muttivariate statistical
analysis. New York:
Wiley, 1958, pp. 126-138.
ARGYRIS, c. Some unintended consequences of rigorous
research. Psychological
Bulletin, 1968, 70, 185-197.
ASCH, s.E. Forming impressions of personality. Journal of
Abnormal and Social
Psychology, 1946, 41, 258-290.
BIER], J . , ATKINS, A X . , BRIAR, S., LEAMAN, R.L.,
MILLER, H., & TRIPODI, T.
and social judgment. New York: Wiley, 1966.
BRUNSWICK, E. Systematic and representative design of
psychological experiments.
Berkeley, California: University of California Press, 1947.
CATTELL, R.B. The scientific analysis of personality.
Harmondsworth: Penguin Books,
1965.
5 4 J . T. PARTINGTON & L. CLARKE
GOLDBERG, L.R. Simple models or simple processes? Some
research on clinical judg-
ments. American Psychologist, 1968, 23, 483-496.
HAYS, W.L. Statistics for Psychologists. New York: Holt,
Rinehart, and Winston, 1963.
HAHMAN, H.H. Modern factor analysis. Chicago: The
University of Chicago Press,
1960.
BOFFMAN, F.J., SLOVIC, P., * BORER, L.G. An analysis-of-
variance model for the
assessment of configured cue utilization in clinical judgment
Psychological Bulletin,
1968, 69, 338-349.
JACKSON, D.N. Personality Research Form Manual. Goshen,
New York: Research
Psychologists Press, 1967.
KELLJEY, H.H. The warm-cold variable in first impressions of
persons. Journal of
Personality, 1950, 18, 431-439.
LAY, C H . , & JACKSON, D.N. An analysis of the generality
of trait inferential networks.
Journal of Personality and Social Psychology, 1969,12,12-21.
LOEVINGER, j . Objective tests as instruments of
psychological theory. Psychological
Reports, 1957, 3, 638-694.
LOVEIX, V.R. The human use of personality tests; a dissenting
view. American
Psychologist, 1967, 22, 383-393.
NEWCOMB, T.M. The acquaintance process. New York: Holt,
Rinehart, and Winston,
Inc. 1961.
NUNAIXT, j . Psychometric Theory. New York: McGraw-Hill,
1967.
OWENS, W.A. Toward one discipline of scientific psychology.
American Psychologist,
1968, 23, 782-785.
PARTINGTON, J.T. A test of averaging, adding, and dynamic
models in personality
impression formation. Unpublished Doctoral Dissertation,
University of Western
Ontario, 1966.
PARTINGTON, J.T. Generality of the simple averaging model
in personality impression
formation. Psychonomic Science, 1967,8,339-340.
PARTINGTON, J.T. Dr. JekyD and Mr. High: Multidimensional
scaling of Alcoholics'
self-evaluations. Journal of Abnormal Psychology, 1970,
75,131-138.
PARTINGTON, J.T., * JACKSON, D.N. A multidimensional
scaling evaluation of alter-
native models in personality impression formation.
Psychonomic Science, 1968,10,
331-332.
SCHRAUGER, s., & ALTROCCHi, j . The personality of the
perceiver as a factor in
person perception. Psychological Bulletin, 1964,62,289-308.
TRIANDIS, H.C., & FisHBEiN, M. Cognitive interaction in
person perception. Journal
of Abnormal and Social Psychology, 1963, 67,446-453.
WINCH, H J . Mate-selection: A study of complementary needs.
New York: Harper
and Row, Publishers, Incorporated, 1958.
WINER, B. Statistical Principles in Experimental Design. New
York: McGraw-Hill,
1962.
WISMNKH, j . Reanalysis of Impressions of personality."
Psychological Review, I960,
67, 96-112.
First recetoed 22 January 1970
Journal of Vocational Rehabilitation 20 (2004) 143–150 143
IOS Press
Perspectives on Scientific Inquiry
Correlational designs in rehabilitation
research
Shawn M. Fitzgerald∗ , Phillip D. Rumrill, Jr. and Jason D.
Schenker
Kent State University, Department of Educational Foundations
and Special Services, 413 White Hall, PO Box
5190, Kent, OH 44242-0001, USA
Tel.: +1 330 672 00583; Fax: +1 330 672 2512; E-mail:
[email protected]
Abstract. The article describes correlational research designs as
a method for testing relationships between or among variables
of interest in the lives of people with disabilities. The authors
describe conceptual aspects of correlational research, discuss
the
methods by which researchers select variables for this type of
inquiry, explain the primary purposes of correlational studies,
and
overview data analytic strategies. These discussions are
illustrated with examples from the contemporary vocational
rehabilitation
literature.
Keywords: Correlational research, research design, data
analysis
1. Introduction
Investigating relationships among variables in the
lives of people with disabilities is one of the most ba-
sic and important aspects of rehabilitation research [2].
In fact, gaining a deeper understanding of the connec-
tions that exist among human phenomena is an abid-
ing impetus for scientific inquiry in all of the social
science disciplines, and that impetus transcends even
the most polarized paradigmatic distinctions between
various research methods (e.g., qualitative vs. quan-
titative, descriptive vs. inferential, experimental vs.
non-experimental).
Rather than attempting to infer causality by system-
atically manipulating the independent variable (as is
done in experimental research), correlational studies
assess the strength of relationships as they occur or have
occurred without experimental manipulation. Based
on the observed relationships, statistical significance
tests are then applied to determine the predictive or
explanatory power of those relationships under study.
∗ Corresponding author.
In this article, we describe issues related to using and
interpreting data from correlational designs in contem-
porary rehabilitation research. The purposes, assump-
tions, and limitations that inhere to correlational re-
search are presented, illustrated with examples from
existing literature.
1.1. Purpose of correlational designs
Correlational designs are typically used by re-
searchers for the purpose of exploring relationships
among variables that are not manipulated or cannot be
manipulated. For example, Boschen [5] used a cor-
relational design to study the relationship between in-
come and life satisfaction among people with disabili-
ties. Capella [6] used a correlational design to study the
relationships among age, case costs, and income within
a sample of participants with visual impairments. Cor-
relational designs were appropriate in these studies be-
cause it is not possible to manipulate variables such as
income, life satisfaction, age, and case costs. Although
participants in these types of studies are assumed to
possess the characteristics of interest prior to the study,
1052-2263/04/$17. – IOS Press and the authors. All
rights reserved
144 S.M. Fitzgerald et al. / Correlational designs in
rehabilitation research
Table 1
Typical data requirements for correlational designs and analysis
Subject Life-Satisfaction Income
1 85 45,000
2 66 32,000
3 42 48,000
4 78 42,000
5 25 22,000
and they are measured on those characteristics dur-
ing the study, no attempt is made by the researcher to
change them. In correlational research studies, it is
important to note that researchers often use terms such
as predictor and criterion instead of independent and
dependent to discuss variables because this is the ap-
propriate terminology to use when conducting studies
that do not experimentally manipulate variables under
investigation.
Because variables are not manipulated, causation
is difficult to infer using correlational designs. Al-
though variables may be chosen as predictors because
they are theoretically expected to explain differences
in the criterion variable, a significant statistical rela-
tionship between these variables does not prove causal-
ity. However, a statistically significant relationship be-
tween variables is a precondition of causality. Research
consumers may draw causal inferences based on the
total evidence generated in a number of correlational
studies. Theory-based hypotheses used in correlational
studies propose the direction and/or temporal sequence
of variables, which is another necessary but not suffi-
cient precondition for establishing causality.
1.2. Interpreting relationships in correlational
designs
To understand the nature of various relationships that
could be examined in conducting correlational studies,
consider the data presented in Table 1. Note that with
correlational designs at least two points of data related
to variables of interest must be collected for each in-
dividual. In this example, every individual has pro-
vided data on income level and life satisfaction. To
understand how variables co-vary (i.e., are related) re-
searchers use scatterplots, which require data from one
variable to be plotted against data from another variable
for each individual in the study. Scores for one variable
are plotted on a horizontal axis, referred to as the x
axis, and scores from the other variable are plotted on
a vertical axis, called the y axis. To plot a data point
on the scatterplot for an individual, a researcher would
locate scores on each axis for each variable and then
Table 2
Guidelines for interpreting correlation coefficients
Range of values Interpretation
+0.75 to+1.00 Strong positive relationship
+0.50 to+0.75 Moderate to strong positive relationship
+0.25 to+0.50 Weak to moderate positive relationship
0.00 to+0.25 Zero to weak positive relationship
0.00 to−0.25 Zero to weak negative relationship
−0.25 to−0.50 Weak to moderate negative relationship
−0.50 to−0.75 Moderate to strong negative relationship
−0.75 to−1.00 Strong negative relationship
mark a spot on the graph where these two scores would
meet. Figures 1, 2, and 3 present scatterplots of three
types of relationships that might exist among variables.
If there is a positive relationship among two variables,
higher scores on one variable would tend to be associ-
ated with higher scores on another variable. This type
of relationship is illustrated in Fig. 1. If a negative re-
lationship exists between two variables, higher scores
on one variable would tend to be associated with lower
scores on another variable. This type of relationship is
illustrated in Fig. 2. If there is no relationship between
variables a pattern of scores similar to those illustrated
in Fig. 3 would be observed.
Scatterplots are not only useful for understanding
the direction of a relationship between two variables;
they are also useful for understanding the magnitude
or strength of the relationship between two variables.
To estimate the strength of a relationship, a researcher
would consider the closeness of data points plotted
on the scatterplot. Points that cluster closely together
indicate strong relationships, such as those illustrated
in Figs 1 and 2, whereas points that are not tightly
clustered indicate weak or no relationships. Figure 3
presents data representing a weak relationship between
two variables.
The calculations for determining correlational statis-
tics result in both positive and negative values that range
from −1 to +1. Negative values are associated with
negative relationships between variables and positive
values are associated with positive relationships. The
closer the correlational statistic (also known as a coef-
ficient) is to−1 or +1, the stronger the relationship.
Correlational statistics close to 0 indicate weak rela-
tionships. If there were no relationship at all between
two variables, a value of 0 would be reported. Al-
though there are no binding rules for determining what
constitutes a strong, moderate, or weak relationship,
Table 2 provides a guide for interpretating corelational
statistics.
S.M. Fitzgerald et al. / Correlational designs in rehabilitation
research 145
Variable A (X axis)
4.03.53.02.52.0
V
ar
ia
b
le
B
(
Y
a
xi
s)
700
600
500
400
Fig. 1. Scatterplot of a positive relationship between two
variables.
Variable A (X axis)
6050403020
V
ar
ia
b
le
B
(
Y
a
xi
s)
10
8
6
4
2
0
Fig. 2. Scatterplot of a negative relationship between two
variables.
1.3. Variables in correlational designs
Correlational designs are prevalent in the social sci-
ences and rehabilitation research primarily because
they can be used for any research study in which it is
not necessary (or possible) to manipulate the indepen-
dent variable of interest. The versatility of this type
of research design is borne in the multitude of correla-
tional analyses that exist for investigating relationships
between or among variables.
146 S.M. Fitzgerald et al. / Correlational designs in
rehabilitation research
Variable A (X axis)
2.722.702.682.662.642.622.602.582.562.54
V
ar
ia
b
le
B
(
Y
a
xi
s)
510
500
490
480
470
Fig. 3. Scatterplot of no relationship between two variables.
Table 3
A summary of the hierarchy of measurement scales used in the
social sciences
Properties Scale Examples
One category is different from another Nominal Gender, race
Categories are different and ranked in order Ordinal Supervisor
rankings, letter grades
Categories are different and ranked in order plus
differences between points are equal
Interval Standardized tests
Categories are different, ranked in order, differ-
ences between points are equal and a true zero
Ratio Height, weight
As with all statistical analyses, deciding on the ap-
propriate correlational analysis is dependent on the
measurement properties of the variables under consid-
eration [2]. In general, measurement refers to the pro-
cess of assigning numbers to the responses of individ-
uals according to a specific set of rules [3]. In other
words, measurement is a process that involves quan-
tifying or assigning numbers to the different charac-
teristics or levels of the variables in a research study.
Stevens [14] suggested a four-level hierarchy of mea-
surement, and Table 3 summarizes this hierarchy.
It is important to note that the specific rules used in
assigning numbers to responses of individuals should
not be taken lightly by those conducting research in the
social sciences. The types of measurements ultimately
determine the mathematical manipulations that could
appropriately be applied to the data generated from a
variable, thereby limiting the type of statistical tests
that might also be applied to those data. For example,
mathematically, it is inappropriate to calculate an aver-
age (i.e., mean) score when variables are measured on
either the nominal or ordinal scales. This is limiting
because most parametric statistics utilize a mathemat-
ical average or mean as the basis for analyzing data.
However, means can be calculated for variables that
are measured on either interval or ratio scales. Be-
cause the distances between scale points are equal dis-
tances for both of these scales, most mathematical ma-
nipulations that are required when applying parametric
statistics are possible. Measurements taken using these
scales, for example, allow for meaningful calculations
of averages, standard deviations, and variances – which
form the essential “building blocks” for most paramet-
ric statistics, including most correlational analyses.
1.4. Overview of data analytic strategies in
correlational designs
Data from correlational designs are often analyzed
using a variety of bi-variate correlational statistics, as
S.M. Fitzgerald et al. / Correlational designs in rehabilitation
research 147
Measurement of
the Variable is
Interval/Ratio
Measurement of
the Variable is
Ordinal
Measurement of
the Variable is
Nominal
How is the One Variable
Measured ?
How is the Other Variable
Measured ?
What is the Appropriate Correlational
Analysis ?
Pearson’s r,
Biserial
Point-Biserial
Biserial
Spearman
Rank Biserial
Point-Biserial
Rank Biserial,
Phi, Chi-Square, C Coefficient
Interval or Ratio
Ordinal
Nominal
Interval or Ratio
Ordinal
Nominal
Interval or Ratio
Ordinal
Nominal
Fig. 4. Correlational analyses for assessing relationships or
associations between variables.
well as both simple regression and multiple regres-
sion. Correlational statistics characterize both the na-
ture and magnitude of the relationship between two
variables [2]. Bi-variate correlation coefficients and
simple regression analyses are used to demonstrate the
relationship between one predictor variable and one
criterion variable. When researchers are interested in
determining the relationship of several predictor vari-
ables as they relate to one criterion variable, multiple
regression analyses are typically used. Data from more
complex correlational designs may be analyzed using
canonical correlations or path analysis when multiple
criterion variables and multiple predictor variables are
assessed simultaneously or when complex theoretical
models are analyzed. Figure 4 presents various correla-
tional analyses that are commonly used in rehabilitation
research for investigating relationships, whereas Fig. 5
presents the most commonly used regression analyses.
1.5. Using correlational designs for the purposes of
prediction or explanation
Although the two are not mutually exclusive, corre-
lational studies can be conducted for either predictive
or explanatory purposes [11,12]. In predictive studies,
researchers gather data on one or more predictor vari-
able and one criterion variable that is hypothesized to
occur after the predictor variable(s). For example, a
researcher might investigate the relationship between
intelligence and academic success – here, intelligence
is hypothesized to predict academic success, not vice-
versa. A graduate program in rehabilitation counsel-
ing might use Graduate Record Examination (GRE)
scores and undergraduate grade-point average to pre-
dict graduate-level academic performance. Another
researcher might consider the number of disability-
related worksite barriers as a predictor of job satisfac-
tion.
Explanatory studies make use of theoretically cho-
sen predictor variables that are hypothesized to account
for the variance in the criterion variable [12]. Here,
the emphasis is placed on illuminating the theoretical
nature, direction, and sequence of the relationship be-
tween or among study variables. Although a researcher
who conducts a predictive study would be concerned
about choosing variables that accurately predict scores
on the criterion variable regardless of their theoretical
relevance,a researcher conducting an explanatorystudy
would be concerned about choosing predictor variables
that are theoretically expected to explain, or account
for, variance in the criterion variable. For example, the
graduate programmentioned previously would not nec-
essarily be concerned about the theoretical relevance of
their predictor variables, only their accuracy in predict-
148 S.M. Fitzgerald et al. / Correlational designs in
rehabilitation research
Criterion
Variable is
Interval/Ratio
Criterion
Variable is
Ordinal
Criterion
Variable is
Nominal
How is the Criterion Variable
Measures ?
How are the Predictor Variables
Measured ?
What is the Appropriate Analysis?
Simple/Multiple Linear Regression
Log-Linear Analysis or
Multinomial Analysis
Simple/MultipleLogistic Regression
Interval or Ratio
Ordinal
Nominal
Interval or Ratio
Ordinal
Nominal
Interval or Ratio
Ordinal
Nominal
Fig. 5. Regression analyses for assessing relationships or
associations among variables.
ing graduate-level academic performance. However, if
a researcher wanted to conduct an explanatory study of
graduate-level academic performance, he or she might
include socioeconomic, personality, and motivational
variables that previous research has shown to be rele-
vant to success in graduate school. Most often, corre-
lational studies published in rehabilitation journals are
explanatory in nature.
1.6. Issues in interpreting data from correlational
designs
Correlational studies present a number of concerns
for the researcher as he or she attempts to interpret data.
For example, multicollinearity becomes a concern with
predictive as well as explanatory studies when multiple
predictor variables are included in the regression equa-
tion. Multicollinearity occurs when two or more of the
predictor variables are highly correlated with one an-
other. This presents a problem because the researcher
cannot ascertain the unique predictive or explanatory
influence of each predicator variable because those
variables are too similar as evidenced by their high cor-
relation with one another. However, researchers who
conduct correlational studies generally wish to achieve
the highest degree of accuracy in prediction or expla-
nation with the fewest predictor variables. Therefore,
predictor variables that are highly correlated with other
predictor variables are considered redundant and often
eliminated from the regression equation.
Other concerns that face rehabilitation researchers
who use correlational designs include the quality and
consistency of data collection and recording activities
(especially in ex post facto studies where data have
been collected for a purpose other than the research
study being conducted), the tendency to rely primarily
on self-report data, and the specification of directional
aspects of observed relationships (i.e., which comes
first, the independent or dependent variable).
1.7. Examples of correlational studies
Bolton et al. [4] used hierarchical multiple regres-
sion analysis to examine the predictive utility of several
independent variables vis-à-vis the dependent variables
of competitive employment status and weekly salary for
successful rehabilitants. Specifically, the authors ex-
amined the predictive power of personal history (demo-
graphic variables), functional limitations (adaptive be-
havior, cognition, physical condition, motor function,
communication, and vocational qualification), and re-
habilitation services (placement, personal adjustment,
training, restoration, maintenance, time in active sta-
tus, and total costs). The study included data from
S.M. Fitzgerald et al. / Correlational designs in rehabilitation
research 149
VR clients (N = 4, 603) from five disability groups:
orthopedic, chronic medical, psychiatric, mental retar-
dation, and learning disabilities. The authors found
that the three independent variables combined to ac-
count for approximately one-third of the variability in
competitive employment status (25% to 40% depend-
ing on disability group) and approximately one-eighth
of the variability in weekly salary (9% to 17% depend-
ing on disability group). Personal history accounted
for approximately five percent of the variability in both
competitive employment and weekly salary.
Capella [6] conducted a correlational study designed
to predict the earnings of former VR clients. The au-
thor examined the relationship between education, age,
services, case costs, and months of services (predic-
tor variables) and earnings (criterion variable) among
a sample of participants (N = 16, 270) with visual im-
pairments. The author found that age had the strongest,
although negative, relationship to earnings, followed
by education and cost of case services. Number of ser-
vices and months the case was open were both found to
be significantly related to earnings, but they accounted
for little variance beyond that attributable to age, edu-
cation, and case costs.
Strauser and Ketz [13] used multiple regression to
test Hershenson’s theory of work adjustment, examin-
ing the relationships among job-readiness self-efficacy,
work locus of control, and work personality within a
sample (N = 104) of participants diagnosed with men-
tal retardation, mental illness, or substance abuse dis-
orders. Work personality was defined by the authors
as the person’s self-concept as a worker, motivation for
work, and work-related needs and values. The authors
also examined work competencies, which were defined
as work habits, physical and mental skills, and inter-
personal skills. The authors found that work person-
ality (acceptance of work role, ability to profit from
instruction and correction, work persistence, and work
tolerance combined) significantly predicted internal lo-
cus of control and job-readiness self-efficacy. How-
ever, only work persistence provided a unique predic-
tive contribution beyond the other subscales in the work
personality inventory with regard to locus of control.
Also, ability to profit from instruction and correction
provided a unique contribution to job-readiness self-
efficacy. In addition, the authors examined the correla-
tions between demographic variables (number of jobs
held, number of days since last worked, and number of
times fired or asked to leave a job) and work person-
ality, locus of control, and self-efficacy. Strauser and
Ketz found a significant positive correlation between
the number of jobs held and work personality.
Wilson et al. [15] provided an example of the use
of binary logistic regression, using VR acceptance rate
as the criterion variable and race, gender, education,
work status at application, and primary source of sup-
port at application as the predictor variables. The origi-
nal sample consisted of 599,444 consumers who sought
VR services. The authors then chose 2,476 participants
from each of four racial categories, and coded them on
whether they were accepted for VR services. The au-
thors found that African Americans and Native Ameri-
cans were more likely than European Americans to be
accepted for VR services, whereas Asians or Pacific
Islanders were less likely than European Americans to
be accepted for VR services. In addition, participants
with more available resources were less likely to be
accepted for VR. Finally, the researchers found that as
a participant’s education increased, the likelihood that
he or she was accepted for VR services decreased.
Numerous other correlational studies can be found
in recent rehabilitation research. Horton and Wal-
lander [9] examined the relationship between care-
giver disability-related stress, social support, and hope
(predictor variables) and distress (criterion variable).
Hampton [8] examined the relationships between (a)
various demographic predictor variables and self-
efficacy and (b) a quality of life criterion variable
among Chinese individuals with spinal cord injuries,
finding that self-efficacy, health status, income, educa-
tional level, and time spent on voluntary work were sig-
nificantly correlated with quality of life. Bellini [1] ex-
amined the relationship between several demographic
predictor variables and multicultural counseling com-
petencies on the part of VR counselors, reporting that
females, members of ethnic minority groups, and those
who have attended a greater number of multicultural
counseling workshops exhibited greater multicultural
counseling competencies. Chase et al. [7] studied per-
ceived control, verbal communication skills, satisfac-
tion with personal assistance, marital status, and hand-
icap as predictors of life satisfaction among persons
with spinal cord injuries. They found that perceived
control and marital status were the strongest predictors
of life satisfaction. Finally, Mullins et al. [10] con-
ducted a hierarchical multiple regression analysis to ex-
amine the relationship between the predictor variables
of illness intrusiveness and illness uncertainty and the
criterion variable of severity of psychological distress
among individuals diagnosed with multiple sclerosis.
Results indicated that the two independent variables
significantly predicted severity of distress beyond the
predictive power of various demographic and illness
variables.
150 S.M. Fitzgerald et al. / Correlational designs in
rehabilitation research
2. Conclusion
Correlational research investigations comprise a sub-
stantial proportionof the empirical literature in the field
of vocational rehabilitation. Utilized primarily for the
purposes of prediction and explanation, correlational
designs enable researchers to test the magnitude and
direction of relationships between and among impor-
tant variables in the lives of people with disabilities and
rehabilitation professionals. These studies test rela-
tionships as they occur or as they have occurred, rather
than manipulating independent variables or introduc-
ing an intervention as is commonly done in experimen-
tal research. Therefore, the demonstration or verifi-
cation of causal linkages between or among variables
is not the objective of correlational research. By un-
derstanding the most common applications of correla-
tional research, by being able to identify appropriate
variables for relationship-testing, and by familiarizing
themselves with procedures used to predict or explain
outcomes of interest in the field of vocational rehabil-
itation, rehabilitation professionals can gain a deeper
appreciation of the manner in which variable relation-
ships express themselves in the rehabilitation process,
as well as in the lives of people with disabilities.
References
[1] J. Bellini, Correlates of multicultural counseling
competencies
of vocational rehabilitation counselors,Rehabilitation Coun-
seling Bulletin 45(2) (2002), 66–75.
[2] J. Bellini and P. Rumrill,Research in rehabilitation counsel-
ing, Springfield, IL: Charles C. Thomas, 1999.
[3] B. Bolton, Rehabilitation counseling research, Baltimore:
University Park Press, 1979.
[4] B.F. Bolton, J.L. Bellini and J.B. Brookings, Predicting
client
employment outcomes from personal history, functional limi-
tations, and rehabilitation services,Rehabilitation Counseling
Bulletin 44(1) (2000), 10–21.
[5] K. Boschen, Correlates of life satisfaction, residential satis-
faction, and locus of control among adults with spinal cord in-
juries,Rehabilitation Counseling Bulletin 39(4) (1996), 230–
243.
[6] M.E. Capella, Predicting earnings of vocational rehabilita-
tion clients with visual impairments,Journal of Rehabilitation
67(4) (2001), 43–47.
[7] B.W. Chase, T.A. Cornille and R.W. English, Life
satisfaction
among persons with spinal cord injuries,Journal of Rehabili-
tation 66(3) (2000), 14–20.
[8] N.Z. Hampton, Self-efficacy and quality of life in people
with
spinal cord injuries in China,Rehabilitation Counseling Bul-
letin 43(2) (2000), 66–74.
[9] T.V. Horton and J.L. Wallander, Hope and social support as
re-
silience factors against psychological distress of mothers who
care for children with chronic physical conditions,Rehabili-
tation Psychology 46(4) (2001), 382–399.
[10] L.L. Mullins, M.P. Cote, B.F. Fuemmeler, V.M. Jean,
W.W.
Beatty and R.H. Paul, Illness intrusiveness, uncertainty, and
distress in individuals with multiple sclerosis,Rehabilitation
Psychology 46(2) (2001), 139–153.
[11] E. Pedhazur,Multiple regression in behavioral research,
New
York, NY: Harcourt Brace, 2002.
[12] E.J. Pedhazur and L.P. Schmelkin,Measurement, design,
and
analysis: An integrated approach, Hillsdale, NJ: Erlbaum,
1991.
[13] D.R. Strauser and K. Ketz, The relationship between self-
efficacy, locus of control and work personality,Journal of
Rehabilitation 68(1) (2002), 20–26.
[14] S.S. Stevens, Mathematics, measurement, and
psychophysics,
in: Handbook of experimental psychology, S.S. Stevens, ed.,
New York: Wiley, 1951, pp. 1–49.
[15] K.B. Wilson, R.J. Alston, D.A. Harley and N.A. Mitchell,
Predicting VR acceptance based on race, gender, education,
work status at application, and primary source of support at
application,Rehabilitation Counseling Bulletin 45(3) (2002),
132–142.
· Select one ethical marketing issue suggested by a review, of
any recent article from a non-academic periodical (e.g. LA
Times, Wall St. Journal, Business Week, etc.).
· In the 2-page paper, briefly:
· describe the ethical issue (2-3 sentences),
· discuss the implications for one marketing decision (target
market, product, pricing, promotion, distribution)
· include the full article upon which your paper is based. Staple
to the back of the paper.

More Related Content

Similar to · Select one ethical marketing issue suggested by a review, of any.docx

PERSONALITY AND VOCATIONAL IN AN ADULT SAMPLE (JOHN HOLLAND'S)
PERSONALITY AND VOCATIONAL IN AN ADULT SAMPLE (JOHN HOLLAND'S)PERSONALITY AND VOCATIONAL IN AN ADULT SAMPLE (JOHN HOLLAND'S)
PERSONALITY AND VOCATIONAL IN AN ADULT SAMPLE (JOHN HOLLAND'S)Nur Arifaizal Basri
 
PSY 294 RESEARCH DESIGN &ANALYSIS IILECTURE 4Research Pr.docx
PSY 294 RESEARCH DESIGN &ANALYSIS IILECTURE 4Research Pr.docxPSY 294 RESEARCH DESIGN &ANALYSIS IILECTURE 4Research Pr.docx
PSY 294 RESEARCH DESIGN &ANALYSIS IILECTURE 4Research Pr.docxwoodruffeloisa
 
NO PLAGERISM, DO NOT TURN IN PAPERS USED ONLINE OR SOLD TO SOMEONE.docx
NO PLAGERISM, DO NOT TURN IN PAPERS USED ONLINE OR SOLD TO SOMEONE.docxNO PLAGERISM, DO NOT TURN IN PAPERS USED ONLINE OR SOLD TO SOMEONE.docx
NO PLAGERISM, DO NOT TURN IN PAPERS USED ONLINE OR SOLD TO SOMEONE.docxcurwenmichaela
 
1609182308Mediation.pdf
1609182308Mediation.pdf1609182308Mediation.pdf
1609182308Mediation.pdfJoshuaLau29
 
AsthmaYour NameWalden UniversityCourse number an.docx
AsthmaYour NameWalden UniversityCourse number an.docxAsthmaYour NameWalden UniversityCourse number an.docx
AsthmaYour NameWalden UniversityCourse number an.docxikirkton
 
Philosophy and theory in practice (Dls line9)
Philosophy and theory in practice (Dls line9)Philosophy and theory in practice (Dls line9)
Philosophy and theory in practice (Dls line9)Tim Rogers
 
Personality in Psychology chapter 13_personality
Personality in Psychology chapter 13_personalityPersonality in Psychology chapter 13_personality
Personality in Psychology chapter 13_personalityWaqar Abbasi
 
A SOCIAL NETWORK PERSPECTIVE ON HUMAN RESOURCES MANAGEMENT
A SOCIAL NETWORK PERSPECTIVE ON HUMAN RESOURCES MANAGEMENTA SOCIAL NETWORK PERSPECTIVE ON HUMAN RESOURCES MANAGEMENT
A SOCIAL NETWORK PERSPECTIVE ON HUMAN RESOURCES MANAGEMENTScott Faria
 
Assessing Attachment In Young Adulthood A Validational Study
Assessing Attachment In Young Adulthood  A Validational StudyAssessing Attachment In Young Adulthood  A Validational Study
Assessing Attachment In Young Adulthood A Validational StudyCassie Romero
 
Intergroup Bias and Dual ProcessingResearch on stereotypes is re.docx
Intergroup Bias and Dual ProcessingResearch on stereotypes is re.docxIntergroup Bias and Dual ProcessingResearch on stereotypes is re.docx
Intergroup Bias and Dual ProcessingResearch on stereotypes is re.docxdoylymaura
 

Similar to · Select one ethical marketing issue suggested by a review, of any.docx (18)

PERSONALITY AND VOCATIONAL IN AN ADULT SAMPLE (JOHN HOLLAND'S)
PERSONALITY AND VOCATIONAL IN AN ADULT SAMPLE (JOHN HOLLAND'S)PERSONALITY AND VOCATIONAL IN AN ADULT SAMPLE (JOHN HOLLAND'S)
PERSONALITY AND VOCATIONAL IN AN ADULT SAMPLE (JOHN HOLLAND'S)
 
Twenty two qualitative data methods
Twenty two qualitative data methodsTwenty two qualitative data methods
Twenty two qualitative data methods
 
Twenty Two Qualitative Data Methods
Twenty Two Qualitative Data MethodsTwenty Two Qualitative Data Methods
Twenty Two Qualitative Data Methods
 
PSY 294 RESEARCH DESIGN &ANALYSIS IILECTURE 4Research Pr.docx
PSY 294 RESEARCH DESIGN &ANALYSIS IILECTURE 4Research Pr.docxPSY 294 RESEARCH DESIGN &ANALYSIS IILECTURE 4Research Pr.docx
PSY 294 RESEARCH DESIGN &ANALYSIS IILECTURE 4Research Pr.docx
 
NO PLAGERISM, DO NOT TURN IN PAPERS USED ONLINE OR SOLD TO SOMEONE.docx
NO PLAGERISM, DO NOT TURN IN PAPERS USED ONLINE OR SOLD TO SOMEONE.docxNO PLAGERISM, DO NOT TURN IN PAPERS USED ONLINE OR SOLD TO SOMEONE.docx
NO PLAGERISM, DO NOT TURN IN PAPERS USED ONLINE OR SOLD TO SOMEONE.docx
 
Case Studies
Case StudiesCase Studies
Case Studies
 
1609182308Mediation.pdf
1609182308Mediation.pdf1609182308Mediation.pdf
1609182308Mediation.pdf
 
AsthmaYour NameWalden UniversityCourse number an.docx
AsthmaYour NameWalden UniversityCourse number an.docxAsthmaYour NameWalden UniversityCourse number an.docx
AsthmaYour NameWalden UniversityCourse number an.docx
 
Philosophy and theory in practice (Dls line9)
Philosophy and theory in practice (Dls line9)Philosophy and theory in practice (Dls line9)
Philosophy and theory in practice (Dls line9)
 
Positivism Vs Interpretivism Essay
Positivism Vs Interpretivism EssayPositivism Vs Interpretivism Essay
Positivism Vs Interpretivism Essay
 
Personality in Psychology chapter 13_personality
Personality in Psychology chapter 13_personalityPersonality in Psychology chapter 13_personality
Personality in Psychology chapter 13_personality
 
A SOCIAL NETWORK PERSPECTIVE ON HUMAN RESOURCES MANAGEMENT
A SOCIAL NETWORK PERSPECTIVE ON HUMAN RESOURCES MANAGEMENTA SOCIAL NETWORK PERSPECTIVE ON HUMAN RESOURCES MANAGEMENT
A SOCIAL NETWORK PERSPECTIVE ON HUMAN RESOURCES MANAGEMENT
 
Assessing Attachment In Young Adulthood A Validational Study
Assessing Attachment In Young Adulthood  A Validational StudyAssessing Attachment In Young Adulthood  A Validational Study
Assessing Attachment In Young Adulthood A Validational Study
 
Raymond Ppt
Raymond PptRaymond Ppt
Raymond Ppt
 
Raymond Ppt
Raymond PptRaymond Ppt
Raymond Ppt
 
Intergroup Bias and Dual ProcessingResearch on stereotypes is re.docx
Intergroup Bias and Dual ProcessingResearch on stereotypes is re.docxIntergroup Bias and Dual ProcessingResearch on stereotypes is re.docx
Intergroup Bias and Dual ProcessingResearch on stereotypes is re.docx
 
Free Choice
Free ChoiceFree Choice
Free Choice
 
1 Project doc
1 Project doc1 Project doc
1 Project doc
 

More from alinainglis

· Present a discussion of what team is. What type(s) of team do .docx
· Present a discussion of what team is. What type(s) of team do .docx· Present a discussion of what team is. What type(s) of team do .docx
· Present a discussion of what team is. What type(s) of team do .docxalinainglis
 
· Presentation of your project. Prepare a PowerPoint with 8 slid.docx
· Presentation of your project. Prepare a PowerPoint with 8 slid.docx· Presentation of your project. Prepare a PowerPoint with 8 slid.docx
· Presentation of your project. Prepare a PowerPoint with 8 slid.docxalinainglis
 
· Prepare a research proposal, mentioning a specific researchabl.docx
· Prepare a research proposal, mentioning a specific researchabl.docx· Prepare a research proposal, mentioning a specific researchabl.docx
· Prepare a research proposal, mentioning a specific researchabl.docxalinainglis
 
· Previous professional experiences that have had a profound.docx
· Previous professional experiences that have had a profound.docx· Previous professional experiences that have had a profound.docx
· Previous professional experiences that have had a profound.docxalinainglis
 
· Please select ONE of the following questions and write a 200-wor.docx
· Please select ONE of the following questions and write a 200-wor.docx· Please select ONE of the following questions and write a 200-wor.docx
· Please select ONE of the following questions and write a 200-wor.docxalinainglis
 
· Please use Firefox for access to cronometer.com16 ye.docx
· Please use Firefox for access to cronometer.com16 ye.docx· Please use Firefox for access to cronometer.com16 ye.docx
· Please use Firefox for access to cronometer.com16 ye.docxalinainglis
 
· Please share theoretical explanations based on social, cultural an.docx
· Please share theoretical explanations based on social, cultural an.docx· Please share theoretical explanations based on social, cultural an.docx
· Please share theoretical explanations based on social, cultural an.docxalinainglis
 
· If we accept the fact that we may need to focus more on teaching.docx
· If we accept the fact that we may need to focus more on teaching.docx· If we accept the fact that we may need to focus more on teaching.docx
· If we accept the fact that we may need to focus more on teaching.docxalinainglis
 
· How many employees are working for youtotal of 5 employees .docx
· How many employees are working for youtotal of 5 employees  .docx· How many employees are working for youtotal of 5 employees  .docx
· How many employees are working for youtotal of 5 employees .docxalinainglis
 
· How should the risks be prioritized· Who should do the priori.docx
· How should the risks be prioritized· Who should do the priori.docx· How should the risks be prioritized· Who should do the priori.docx
· How should the risks be prioritized· Who should do the priori.docxalinainglis
 
· How does the distribution mechanism control the issues address.docx
· How does the distribution mechanism control the issues address.docx· How does the distribution mechanism control the issues address.docx
· How does the distribution mechanism control the issues address.docxalinainglis
 
· Helen Petrakis Identifying Data Helen Petrakis is a 5.docx
· Helen Petrakis Identifying Data Helen Petrakis is a 5.docx· Helen Petrakis Identifying Data Helen Petrakis is a 5.docx
· Helen Petrakis Identifying Data Helen Petrakis is a 5.docxalinainglis
 
· Global O365 Tenant Settings relevant to SPO, and recommended.docx
· Global O365 Tenant Settings relevant to SPO, and recommended.docx· Global O365 Tenant Settings relevant to SPO, and recommended.docx
· Global O365 Tenant Settings relevant to SPO, and recommended.docxalinainglis
 
· Focus on the identified client within your chosen case.· Analy.docx
· Focus on the identified client within your chosen case.· Analy.docx· Focus on the identified client within your chosen case.· Analy.docx
· Focus on the identified client within your chosen case.· Analy.docxalinainglis
 
· Find current events regarding any issues in public health .docx
· Find current events regarding any issues in public health .docx· Find current events regarding any issues in public health .docx
· Find current events regarding any issues in public health .docxalinainglis
 
· Explore and assess different remote access solutions.Assig.docx
· Explore and assess different remote access solutions.Assig.docx· Explore and assess different remote access solutions.Assig.docx
· Explore and assess different remote access solutions.Assig.docxalinainglis
 
· FASB ASC & GARS Login credentials LinkUser ID AAA51628Pas.docx
· FASB ASC & GARS Login credentials LinkUser ID AAA51628Pas.docx· FASB ASC & GARS Login credentials LinkUser ID AAA51628Pas.docx
· FASB ASC & GARS Login credentials LinkUser ID AAA51628Pas.docxalinainglis
 
· Due Sat. Sep. · Format Typed, double-spaced, sub.docx
· Due Sat. Sep. · Format Typed, double-spaced, sub.docx· Due Sat. Sep. · Format Typed, double-spaced, sub.docx
· Due Sat. Sep. · Format Typed, double-spaced, sub.docxalinainglis
 
· Expectations for Power Point Presentations in Units IV and V I.docx
· Expectations for Power Point Presentations in Units IV and V I.docx· Expectations for Power Point Presentations in Units IV and V I.docx
· Expectations for Power Point Presentations in Units IV and V I.docxalinainglis
 
· Due Friday by 1159pmResearch Paper--IssueTopic Ce.docx
· Due Friday by 1159pmResearch Paper--IssueTopic Ce.docx· Due Friday by 1159pmResearch Paper--IssueTopic Ce.docx
· Due Friday by 1159pmResearch Paper--IssueTopic Ce.docxalinainglis
 

More from alinainglis (20)

· Present a discussion of what team is. What type(s) of team do .docx
· Present a discussion of what team is. What type(s) of team do .docx· Present a discussion of what team is. What type(s) of team do .docx
· Present a discussion of what team is. What type(s) of team do .docx
 
· Presentation of your project. Prepare a PowerPoint with 8 slid.docx
· Presentation of your project. Prepare a PowerPoint with 8 slid.docx· Presentation of your project. Prepare a PowerPoint with 8 slid.docx
· Presentation of your project. Prepare a PowerPoint with 8 slid.docx
 
· Prepare a research proposal, mentioning a specific researchabl.docx
· Prepare a research proposal, mentioning a specific researchabl.docx· Prepare a research proposal, mentioning a specific researchabl.docx
· Prepare a research proposal, mentioning a specific researchabl.docx
 
· Previous professional experiences that have had a profound.docx
· Previous professional experiences that have had a profound.docx· Previous professional experiences that have had a profound.docx
· Previous professional experiences that have had a profound.docx
 
· Please select ONE of the following questions and write a 200-wor.docx
· Please select ONE of the following questions and write a 200-wor.docx· Please select ONE of the following questions and write a 200-wor.docx
· Please select ONE of the following questions and write a 200-wor.docx
 
· Please use Firefox for access to cronometer.com16 ye.docx
· Please use Firefox for access to cronometer.com16 ye.docx· Please use Firefox for access to cronometer.com16 ye.docx
· Please use Firefox for access to cronometer.com16 ye.docx
 
· Please share theoretical explanations based on social, cultural an.docx
· Please share theoretical explanations based on social, cultural an.docx· Please share theoretical explanations based on social, cultural an.docx
· Please share theoretical explanations based on social, cultural an.docx
 
· If we accept the fact that we may need to focus more on teaching.docx
· If we accept the fact that we may need to focus more on teaching.docx· If we accept the fact that we may need to focus more on teaching.docx
· If we accept the fact that we may need to focus more on teaching.docx
 
· How many employees are working for youtotal of 5 employees .docx
· How many employees are working for youtotal of 5 employees  .docx· How many employees are working for youtotal of 5 employees  .docx
· How many employees are working for youtotal of 5 employees .docx
 
· How should the risks be prioritized· Who should do the priori.docx
· How should the risks be prioritized· Who should do the priori.docx· How should the risks be prioritized· Who should do the priori.docx
· How should the risks be prioritized· Who should do the priori.docx
 
· How does the distribution mechanism control the issues address.docx
· How does the distribution mechanism control the issues address.docx· How does the distribution mechanism control the issues address.docx
· How does the distribution mechanism control the issues address.docx
 
· Helen Petrakis Identifying Data Helen Petrakis is a 5.docx
· Helen Petrakis Identifying Data Helen Petrakis is a 5.docx· Helen Petrakis Identifying Data Helen Petrakis is a 5.docx
· Helen Petrakis Identifying Data Helen Petrakis is a 5.docx
 
· Global O365 Tenant Settings relevant to SPO, and recommended.docx
· Global O365 Tenant Settings relevant to SPO, and recommended.docx· Global O365 Tenant Settings relevant to SPO, and recommended.docx
· Global O365 Tenant Settings relevant to SPO, and recommended.docx
 
· Focus on the identified client within your chosen case.· Analy.docx
· Focus on the identified client within your chosen case.· Analy.docx· Focus on the identified client within your chosen case.· Analy.docx
· Focus on the identified client within your chosen case.· Analy.docx
 
· Find current events regarding any issues in public health .docx
· Find current events regarding any issues in public health .docx· Find current events regarding any issues in public health .docx
· Find current events regarding any issues in public health .docx
 
· Explore and assess different remote access solutions.Assig.docx
· Explore and assess different remote access solutions.Assig.docx· Explore and assess different remote access solutions.Assig.docx
· Explore and assess different remote access solutions.Assig.docx
 
· FASB ASC & GARS Login credentials LinkUser ID AAA51628Pas.docx
· FASB ASC & GARS Login credentials LinkUser ID AAA51628Pas.docx· FASB ASC & GARS Login credentials LinkUser ID AAA51628Pas.docx
· FASB ASC & GARS Login credentials LinkUser ID AAA51628Pas.docx
 
· Due Sat. Sep. · Format Typed, double-spaced, sub.docx
· Due Sat. Sep. · Format Typed, double-spaced, sub.docx· Due Sat. Sep. · Format Typed, double-spaced, sub.docx
· Due Sat. Sep. · Format Typed, double-spaced, sub.docx
 
· Expectations for Power Point Presentations in Units IV and V I.docx
· Expectations for Power Point Presentations in Units IV and V I.docx· Expectations for Power Point Presentations in Units IV and V I.docx
· Expectations for Power Point Presentations in Units IV and V I.docx
 
· Due Friday by 1159pmResearch Paper--IssueTopic Ce.docx
· Due Friday by 1159pmResearch Paper--IssueTopic Ce.docx· Due Friday by 1159pmResearch Paper--IssueTopic Ce.docx
· Due Friday by 1159pmResearch Paper--IssueTopic Ce.docx
 

Recently uploaded

Explore beautiful and ugly buildings. Mathematics helps us create beautiful d...
Explore beautiful and ugly buildings. Mathematics helps us create beautiful d...Explore beautiful and ugly buildings. Mathematics helps us create beautiful d...
Explore beautiful and ugly buildings. Mathematics helps us create beautiful d...christianmathematics
 
Key note speaker Neum_Admir Softic_ENG.pdf
Key note speaker Neum_Admir Softic_ENG.pdfKey note speaker Neum_Admir Softic_ENG.pdf
Key note speaker Neum_Admir Softic_ENG.pdfAdmir Softic
 
IGNOU MSCCFT and PGDCFT Exam Question Pattern: MCFT003 Counselling and Family...
IGNOU MSCCFT and PGDCFT Exam Question Pattern: MCFT003 Counselling and Family...IGNOU MSCCFT and PGDCFT Exam Question Pattern: MCFT003 Counselling and Family...
IGNOU MSCCFT and PGDCFT Exam Question Pattern: MCFT003 Counselling and Family...PsychoTech Services
 
Russian Escort Service in Delhi 11k Hotel Foreigner Russian Call Girls in Delhi
Russian Escort Service in Delhi 11k Hotel Foreigner Russian Call Girls in DelhiRussian Escort Service in Delhi 11k Hotel Foreigner Russian Call Girls in Delhi
Russian Escort Service in Delhi 11k Hotel Foreigner Russian Call Girls in Delhikauryashika82
 
Kisan Call Centre - To harness potential of ICT in Agriculture by answer farm...
Kisan Call Centre - To harness potential of ICT in Agriculture by answer farm...Kisan Call Centre - To harness potential of ICT in Agriculture by answer farm...
Kisan Call Centre - To harness potential of ICT in Agriculture by answer farm...Krashi Coaching
 
Activity 01 - Artificial Culture (1).pdf
Activity 01 - Artificial Culture (1).pdfActivity 01 - Artificial Culture (1).pdf
Activity 01 - Artificial Culture (1).pdfciinovamais
 
Beyond the EU: DORA and NIS 2 Directive's Global Impact
Beyond the EU: DORA and NIS 2 Directive's Global ImpactBeyond the EU: DORA and NIS 2 Directive's Global Impact
Beyond the EU: DORA and NIS 2 Directive's Global ImpactPECB
 
Grant Readiness 101 TechSoup and Remy Consulting
Grant Readiness 101 TechSoup and Remy ConsultingGrant Readiness 101 TechSoup and Remy Consulting
Grant Readiness 101 TechSoup and Remy ConsultingTechSoup
 
Paris 2024 Olympic Geographies - an activity
Paris 2024 Olympic Geographies - an activityParis 2024 Olympic Geographies - an activity
Paris 2024 Olympic Geographies - an activityGeoBlogs
 
Sports & Fitness Value Added Course FY..
Sports & Fitness Value Added Course FY..Sports & Fitness Value Added Course FY..
Sports & Fitness Value Added Course FY..Disha Kariya
 
1029 - Danh muc Sach Giao Khoa 10 . pdf
1029 -  Danh muc Sach Giao Khoa 10 . pdf1029 -  Danh muc Sach Giao Khoa 10 . pdf
1029 - Danh muc Sach Giao Khoa 10 . pdfQucHHunhnh
 
Z Score,T Score, Percential Rank and Box Plot Graph
Z Score,T Score, Percential Rank and Box Plot GraphZ Score,T Score, Percential Rank and Box Plot Graph
Z Score,T Score, Percential Rank and Box Plot GraphThiyagu K
 
Accessible design: Minimum effort, maximum impact
Accessible design: Minimum effort, maximum impactAccessible design: Minimum effort, maximum impact
Accessible design: Minimum effort, maximum impactdawncurless
 
Disha NEET Physics Guide for classes 11 and 12.pdf
Disha NEET Physics Guide for classes 11 and 12.pdfDisha NEET Physics Guide for classes 11 and 12.pdf
Disha NEET Physics Guide for classes 11 and 12.pdfchloefrazer622
 
The basics of sentences session 2pptx copy.pptx
The basics of sentences session 2pptx copy.pptxThe basics of sentences session 2pptx copy.pptx
The basics of sentences session 2pptx copy.pptxheathfieldcps1
 
1029-Danh muc Sach Giao Khoa khoi 6.pdf
1029-Danh muc Sach Giao Khoa khoi  6.pdf1029-Danh muc Sach Giao Khoa khoi  6.pdf
1029-Danh muc Sach Giao Khoa khoi 6.pdfQucHHunhnh
 
General AI for Medical Educators April 2024
General AI for Medical Educators April 2024General AI for Medical Educators April 2024
General AI for Medical Educators April 2024Janet Corral
 
Sanyam Choudhary Chemistry practical.pdf
Sanyam Choudhary Chemistry practical.pdfSanyam Choudhary Chemistry practical.pdf
Sanyam Choudhary Chemistry practical.pdfsanyamsingh5019
 
Software Engineering Methodologies (overview)
Software Engineering Methodologies (overview)Software Engineering Methodologies (overview)
Software Engineering Methodologies (overview)eniolaolutunde
 

Recently uploaded (20)

Explore beautiful and ugly buildings. Mathematics helps us create beautiful d...
Explore beautiful and ugly buildings. Mathematics helps us create beautiful d...Explore beautiful and ugly buildings. Mathematics helps us create beautiful d...
Explore beautiful and ugly buildings. Mathematics helps us create beautiful d...
 
Key note speaker Neum_Admir Softic_ENG.pdf
Key note speaker Neum_Admir Softic_ENG.pdfKey note speaker Neum_Admir Softic_ENG.pdf
Key note speaker Neum_Admir Softic_ENG.pdf
 
IGNOU MSCCFT and PGDCFT Exam Question Pattern: MCFT003 Counselling and Family...
IGNOU MSCCFT and PGDCFT Exam Question Pattern: MCFT003 Counselling and Family...IGNOU MSCCFT and PGDCFT Exam Question Pattern: MCFT003 Counselling and Family...
IGNOU MSCCFT and PGDCFT Exam Question Pattern: MCFT003 Counselling and Family...
 
Russian Escort Service in Delhi 11k Hotel Foreigner Russian Call Girls in Delhi
Russian Escort Service in Delhi 11k Hotel Foreigner Russian Call Girls in DelhiRussian Escort Service in Delhi 11k Hotel Foreigner Russian Call Girls in Delhi
Russian Escort Service in Delhi 11k Hotel Foreigner Russian Call Girls in Delhi
 
Kisan Call Centre - To harness potential of ICT in Agriculture by answer farm...
Kisan Call Centre - To harness potential of ICT in Agriculture by answer farm...Kisan Call Centre - To harness potential of ICT in Agriculture by answer farm...
Kisan Call Centre - To harness potential of ICT in Agriculture by answer farm...
 
Activity 01 - Artificial Culture (1).pdf
Activity 01 - Artificial Culture (1).pdfActivity 01 - Artificial Culture (1).pdf
Activity 01 - Artificial Culture (1).pdf
 
Beyond the EU: DORA and NIS 2 Directive's Global Impact
Beyond the EU: DORA and NIS 2 Directive's Global ImpactBeyond the EU: DORA and NIS 2 Directive's Global Impact
Beyond the EU: DORA and NIS 2 Directive's Global Impact
 
Grant Readiness 101 TechSoup and Remy Consulting
Grant Readiness 101 TechSoup and Remy ConsultingGrant Readiness 101 TechSoup and Remy Consulting
Grant Readiness 101 TechSoup and Remy Consulting
 
INDIA QUIZ 2024 RLAC DELHI UNIVERSITY.pptx
INDIA QUIZ 2024 RLAC DELHI UNIVERSITY.pptxINDIA QUIZ 2024 RLAC DELHI UNIVERSITY.pptx
INDIA QUIZ 2024 RLAC DELHI UNIVERSITY.pptx
 
Paris 2024 Olympic Geographies - an activity
Paris 2024 Olympic Geographies - an activityParis 2024 Olympic Geographies - an activity
Paris 2024 Olympic Geographies - an activity
 
Sports & Fitness Value Added Course FY..
Sports & Fitness Value Added Course FY..Sports & Fitness Value Added Course FY..
Sports & Fitness Value Added Course FY..
 
1029 - Danh muc Sach Giao Khoa 10 . pdf
1029 -  Danh muc Sach Giao Khoa 10 . pdf1029 -  Danh muc Sach Giao Khoa 10 . pdf
1029 - Danh muc Sach Giao Khoa 10 . pdf
 
Z Score,T Score, Percential Rank and Box Plot Graph
Z Score,T Score, Percential Rank and Box Plot GraphZ Score,T Score, Percential Rank and Box Plot Graph
Z Score,T Score, Percential Rank and Box Plot Graph
 
Accessible design: Minimum effort, maximum impact
Accessible design: Minimum effort, maximum impactAccessible design: Minimum effort, maximum impact
Accessible design: Minimum effort, maximum impact
 
Disha NEET Physics Guide for classes 11 and 12.pdf
Disha NEET Physics Guide for classes 11 and 12.pdfDisha NEET Physics Guide for classes 11 and 12.pdf
Disha NEET Physics Guide for classes 11 and 12.pdf
 
The basics of sentences session 2pptx copy.pptx
The basics of sentences session 2pptx copy.pptxThe basics of sentences session 2pptx copy.pptx
The basics of sentences session 2pptx copy.pptx
 
1029-Danh muc Sach Giao Khoa khoi 6.pdf
1029-Danh muc Sach Giao Khoa khoi  6.pdf1029-Danh muc Sach Giao Khoa khoi  6.pdf
1029-Danh muc Sach Giao Khoa khoi 6.pdf
 
General AI for Medical Educators April 2024
General AI for Medical Educators April 2024General AI for Medical Educators April 2024
General AI for Medical Educators April 2024
 
Sanyam Choudhary Chemistry practical.pdf
Sanyam Choudhary Chemistry practical.pdfSanyam Choudhary Chemistry practical.pdf
Sanyam Choudhary Chemistry practical.pdf
 
Software Engineering Methodologies (overview)
Software Engineering Methodologies (overview)Software Engineering Methodologies (overview)
Software Engineering Methodologies (overview)
 

· Select one ethical marketing issue suggested by a review, of any.docx

  • 1. · Select one ethical marketing issue suggested by a review, of any recent article from a non-academic periodical (e.g. LA Times, Wall St. Journal, Business Week, etc.). · In the 2-page paper, briefly: · describe the ethical issue (2-3 sentences), · discuss the implications for one marketing decision (target market, product, pricing, promotion, distribution) · include the full article upon which your paper is based. Staple to the back of the paper. https://www.entrepreneur.com/article/314011 Personality impression formation: a correlational- experimental design* JOHN T. PARTINGTON Brock University LOUISE CLARKE University of Western Ontario ABSTRACT A correlational-experimental design was used to study personality impression forma- tion. Subjects rated how they would accept a number of hypothetical stimulus people represented by combinations of self-referent statements denoting opposite poles of four personality dimensions. They also gave self-endorsement responses to a person- ality battery which sampled the same four dimensions. Perceivers were classified into
  • 2. personality types defining levels of a subject's factor which together with four stimulus cue factors comprised a complete factorial design for analyzing l i e accep- tance ratings. Although the main experimental results suggested that stimulus cue integration may be more linear than configural, the nature of subject-cue interactions illustrated the need for more representative design in social perception research. The present investigation focussed on how people form impressions of others based on limited stimulus information. Asch's (1946) pioneering studies on this problem suggested that people appear to combine stimulus cues configurally and that certain traits are more central than others in determining impressions. However, subsequent work within the Asch paradigm yielded conflicting findings regarding trait centrality (e.g., Kelley, 1950; Wishner, 1960). In addition, considerable evidence favouring more parsimonious linear models of impression formation has also been obtained (Anderson, 1962; Triandis & Fishbein, 1963; Goldberg, 1968), even under widely varied stimulus conditions (Partington, 1967). Not- withstanding this, it is conceivable that die "fit" between such simple models and obtained impression formation data may be a design artifact. That is, the predictive power of these simple linear models may
  • 3. have been a function of "rigorous" experimental paradigms which varied stimulus cues in a controlled manner while holding constant other poten- tially important covariates such as perceiver characteristics, nature of the responses obtained, and situational effects (cf., Bieri, Atkins, Briar, Lea- man, Miller, & Tripodi, 1966). The purpose of the present study was to determine how different types of perceivers would utilize and integrate information when forming im- " This research was supported by Canada Council Grant 68- 0667 and by the University of Western Ontario Research Fund. Thanks are also due D. N. Jackson for granting permission to use subscales from the Personality Research Form. CANAD. J. BEHAV. SCI./REV. CANAD. SCI. OOMF., 3 ( 1 ) , 1971 4 8 J . T. PARTINGTON & L. CLARKE pressions of different types of stimulus people. A combined correlational- experimental design was used (cf., Owens, 1968). Correlational proce- dures were required to classify perceivers into personality types (Nunally,
  • 4. 1967). These types were then included as levels of a "subjects" factor in a complete factorial ANOVA design developed for studying cue utilization in social and clinical judgments (Anderson, 1962, 1969; Hoffman, Slovic, & Rorer, 1968). Since the sets of cues representing the experimental stimuli were selected from the same personality dimensions used to clas- sify the perceivers, this design made it possible to evaluate the relative effects of perceiver-stimuli interactions, as well as the effects of stimulus cues separately and in combination. METHOD Subjects Sixty-two University of Western Ontario undergraduates comprised the original sample. They were selected from the introductory psychology subject pool to avoid possible contamination due to familiarity with measures used in die study. Males and females were equally represented. Materials A paper and pencil questionnaire was developed which included demographic items, a personality battery, and a social judgment section. The personality battery com- prised three 20 item scales, Dominance, Order, and Affiliation, from the Personality Research Form A (Jackson, 1967), plus a 10 item Masculinity (mf) scale from the
  • 5. MMPI. The social judgment section required Ss to indicate the degree to which they themselves, and others, would accept each of a number of hypothetical stimulus people. Stimulus People Each hypothetical stimulus person was described in terms of four self-referent state- ments. These statements represented the same four personality dimensions sampled by the personality battery described above. These dimensions are not only representa- tive but also relatively independent (Lay & Jackson, 1969). Table 1 lists the stimulus items together with their operating characteristics. It may be seen that the items were selected according to high denotative relevance, moderate evaluative connota- tions (Mean absolute deviation from neutral: Denotation x = 2.1; Connotation X = 0.75; t = 6.83, p < 0.001), and moderate endorsement frequencies. The hypo- thetical stimulus people were represented by all possible combinations of the stimulus items in a completely crossed factorial design. Thus there was a set of 16 stimuli (2*) since each pole of the four personality dimensions was represented (e.g., Dominance-Submission). Two example stimuli are given below: 1. I go out of my way to meet people; I enjoy reading love stories; I think it is better to be quiet than assertive; I often decide ahead of time exactly what I will do on a certain day. 2. Most of the dungs I do have no system to them; I have
  • 6. relatively few friends; I like adventure stories better than romantic stories; I am quite good at keeping others in line. PERSONALITY IMPRESSION FORMATION 49 TABLE 1 Operating characteristics of the stimulus items Characteristics Dimensions Masculinity Order Dominance Affiliation Items I like adventure stories better than romantic stories I enjoy reading love stories I often decide ahead of time exactly what I will do on a certain day Most of the things I do have no system to them
  • 7. I am quite good at keeping others in line I think it is better to be quiet than assertive I go out of my way to meet people I have relatively few friends Denotative 1.7 6.6 6.3 1.7 6.1 2.4 6.0 2.3 Connotative 4.6 3.9 2.9
  • 8. 5.0 3.4 4.2 2.6 5.0 Endorsement frequency .59 .56 .63 .78 .50 .55 .37 .55 Note. Denotative and connotative item weights are 7-point scale averages. Denotative values reported in Partington (1966). Connotative values and endorsement frequencies compiled by D. N. Jackson and A. Conger based on University of Western Ontario samples.
  • 9. Careful counterbalancing was undertaken to avoid possible intrastimulus and inter- stimulus order effects. The former was accomplished by taking a stratified sample of 16 permutations from the 24 possible permutations of the four personality dimen- sions to be represented. These 16 were then reviewed to ensure that each pole of each personality dimension would occur first and last exactly twice in the person descriptions. Interstimulus order effects were counterbalanced by creating two dif- ferent orderings of the 16 stimuli and nesting one within the other. This resulted in a total of 32 stimuli-to-be-judged. Dependent Measures Subjects were required to indicate on a 7-point scale how they themselves (Own-ac- ceptance) and how others in general (Others-acceptance) would accept each of die hypothetical stimulus people. The poles of the acceptance scale were defined as fol- lows: "This person would be readily acceptable as a friend;" "This person would be completely rejected." This social distance continuum was used because of its poten- tial for involving Ss personally in the judgment task. Own- acceptance was die pri- mary dependent measure. The Others-acceptance set was included to provide Ss with the opportunity to express their conception of a "normative" and/or desirable response. This multi-set response format was designed to enhance the probability of obtaining
  • 10. idiosyncratic Own-acceptance judgments relatively free from response styles. 5 0 J . T. PABTINGTON tc L. CLABKE Procedure Subjects were tested in groups of 10-20 each. Several steps were incorporated to re- duce the possibility that Ss might be alienated by die standardized testing procedure (cf., Argyris, 1968) and to lessen possible boredom, fatigue, and defensiveness (cf., Loevinger, 1957). First, instructions were in the form of a client contract (LoveH, 1967) which emphasized reciprocal openness between the £ and S. A realistic set was attempted by encouraging Ss to consider the stimulus people as potentially real, and by requiring Ss to indicate how they themselves would accept each stimulus person "as a friend." Finally, personal involvement was fostered by requiring Ss to respond to the personality battery before undertaking the social judgments. In addition, to insure optimum freedom for Ss to communicate to the E how they felt about their social judgments, a "Certainty" scale and a space for "Comments" was provided beside each stimulus-to-be-judged. BESULTS Subjects were classified into types based on similarities in their own per-
  • 11. sonality profiles, and their impression responses toward a number of hypothetical stimulus people represented in terms of die same dimensions of personality were analyzed. Classification of subjects' personality profiles was accomplished by "obverse" principal components of sums of squares and cross- products between subjects (Nunally, 1967). Examination of the distribution of re- sulting eigenvalues revealed a marked drop after the second value. This suggested that the first two "Subjects" factors adequately represented covariation in the original matrix. These factors were rotated to simple structure according to die Varimax criteria (Harman, 1960). Subjects with high loadings (above the median) on the first rotated factor and low loadings (below the median) on the second rotated factor were classified as Type i. Subjects with a reverse pattern of loadings were classified as Type n. Those with approximately equal loadings on each factor were eliminated from further analysis. This procedure resulted in 25 Type i and 24 Type n subjects. Results of a discriminant analysis (Anderson, 1958) confirmed that Types I and n were clearly separable (D2 = 21.9, p < 0.001), especially in terms of their Dominance and Orderliness (per
  • 12. cent Contribution to D* = 65 and 23 respectively). Separate analysis of demographic items showed that these subsamples also differed in sex representation (Males: Type i = 40 per cent, Type n = 83 per cent, x2 = 5.2, p< 0.05). To determine how subjects formed impressions of the stimulus people, a five-way ANOVA was performed on the Own acceptance data. The nested replications were combined and processed on the University of Western Ontario BBM 7040 system according to BALANOVA using the approximate unweighted means method (Winer, 1962, pp. 224-227). The independent PERSONALITY IMPRESSION FORMATION 5 1 variables under consideration were represented by die following two-level fixed factors: Affiliation (Friendly-Unfriendly); Orderliness (Orderly- Disorderly); Dominance (Dominant-Submissive); Masculinity (Male interest-Female interest); and Subjects (Type i-Type n ) . Main effects of all stimulus cues for the total sample were significant and variance esti- mates (Hays, 1963) indicated the following rank order of salience: Affilia-
  • 13. tion ( F = 82.30, df = 1,1536, p < 0.01, to2 = 0.31); Orderliness ( F = 72.17, df = 1,1536, p < 0.01, to2 = 0.27); Dominance ( F = 29.07, df = 1,1536, p < 0.01, to2 = 0.10; and Masculinity ( F = 18.49, df = 1,1536, p < 0.01, ttf2 = 0.05). Most noteworthy, however, was the complete absence of significant interactions among the stimulus cues. Main effects were significant for the Subjects factor with Type i sub- jects indicating relatively greater acceptance of the stimulus people ( F = 24.00, df = 1,1536, p < 0.01). The major source of this difference was a subject type-by-Masculinity cue interaction (F = 12.77, df = 1,1536, p < 0.01), cell means of which suggest that Type i subjects expressed greater acceptance of those represented with a Feminine interest cue than did Type n subjects. Validity of these results was inferred from a comparison of correlations between sum totals of the connotative values of die items representing each stimulus person and the average "Own" and "Others" acceptance judgments of each group. The following values clearly indicate that the Own acceptance judgments of both groups were significantly less asso- ciated with item connotation than were the Others acceptance judgments:
  • 14. Type i - O w n (0.75), Others (0.90) (t = 7.38, p < 0.01); Type n - O w n (0.43), Others (0.82) (t = 9.59,p < 0.01). This suggests that the findings in this study may be considered representative of subjects' idiosyncratic Own acceptance judgments. It also confirms die utility of a multi-set response procedure for social perception studies. DISCUSSION This investigation of personality impression formation involved a corre- lational-experimental design in which subjects were classified in terms of the same personality dimensions as those used to represent the experi- mental stimuli. Results suggested that subjects' impression responses were determined by individual stimulus cues rather than by combinations of cues. That is, they appeared to operate as though traits in other people function independently. Moreover, subjects seemed to be relatively more influenced by some cues, for example those denoting friendliness, than by other cues. Such findings are consistent with a growing body of evidence which points toward "weighted linear" as opposed to "configural" inter- 52 J . T. FART1NGTON & L. CLARKE
  • 15. pretations of impression formation (Anderson, 1968; Goldberg, 1968). They also confirm previous evidence concerning the centrality of the warm-cold dimension for social perception (Asch, 1946; Kelley, 1950). In addition to these experimental effects, a subject type-by- Masculinity cue interaction was evident. Cell means indicated that submissive, orderly Type i subjects appeared more willing to accept those represented as enjoying reading love stories than did the dominant, less orderly Type n subjects. This interaction, while understandable in terms of the measured personality differences between the two groups, may have been mediated by significant differences in actual sex representation in the groups since there were 40 per cent males in the Type i classification and 83 per cent in Type n. Certainly it makes just as much sense to think of male and female groups expressing different acceptance toward someone who likes to read love stories as it does to consider the same finding in terms of differences in dominance and/or orderliness between the groups. In any event, this interpretation is consistent with the observation that sex has frequently been found to be a potent moderator variable in person per-
  • 16. ception (Schrauger & Altrocchi, 1964). The absence of other possible perceiver-perceived interactions invites comment even at the risk of Type n error: For example, why were not the dominant Type n subjects relatively more attracted to the submissive stimulus people? Or, why did not the orderly Type i subjects respond more favourably to the orderly stimulus people than did the less orderly Type n subjects? Both substantive and methodological explanations may be considered. On the one hand, it is possible that models of interpersonal attraction involving need-complementarity or similarity (e.g. Winch, 1958; Newcomb, 1961) simply may not be tenable. However, the scope of the present study precludes such a firm conclusion. An alternative explanation concerns the nature of the information used to represent stimulus people, and the kinds of measures used to differentiate perceiver types. Specific- ally, it is an open question whether such items as, I often decide ahead of time exactly what I will do on a certain day, and, I am quite good at keeping others in line, are sufficiently potent to transmit a satisfactory image of Orderly and Dominant people respectively. Equally questionable is the representativeness of information about subjects yielded by true-
  • 17. false psychometric devices which purport to reflect basic personality traits. This line of reasoning raises the possibility that the obtained interaction might have been different in degree had the actual sex of the stimulus people been represented. Other possibilities also come to mind. For ex- ample, would a "complementary-needs" interaction have occurred had the dominance of the perceivers and the submissiveness of those perceived PERSONALITY IMPRESSION FORMATION 53 been assessed and described in other than psychometric terms, such as demographically or via audio-visual channels? In closing, it is suggested that Brunswick's (1947) conception of repre- sentative design be reincarnated for studying impression formation. It is conceivable that with richer stimulus information subsequent investiga- tions may obtain quite different results, just as more general conditions of social judgment have yielded less simple impression strategies (Partington & Jackson, 1968). RESUME Etude corr61ationnelle-experimentale sur la maniere dont on se
  • 18. forme une impression sur la personnalite d'autnd. Les sujets doivent estimer comment ils accepteraient certaines personnes-stunuli hypothetiques representees par des constellations d'enonces auto-descriptifs denotant les poles opposes de quatre dimensions de la personnalite. Us doivent egalement dormer des reponses d'auto-acceptation aux item d'une batterie de personnalite cemant les memes quatre dimensions. Les sujets sont repartis en types de personnalite constituant les differents niveaux d'un facteur lie au sujet: les relations de ce facteur avec les quatre faeteurs lies aux indices stimuli donnent lieu a un plan factoriel complet servant a l'analyse des jugements d'acceptation. Meme si les principaux resultats expenmentaux suggerent que l'integration des indices stimuli soit plus lineaire que configurationnelle, la nature des interactions sujet-indices illustre la necessite d'un modele plus representatif dans les recherches en perception sociale. REFERENCES ANDERSON, N.H. Application of an additive model to impression formation. Science, 1962, 138, 817-818. ANDERSON, N.H. A simple model for information integration. In R. P. Ableson, E. Aronson, W. J. McGuire, T. M. Newcomb, M. J. Rosenberg, and P. H. Tannen- baum (eds.), Theories of Cognitive Consistency: A Sourcebook. Chicago: Rand McNally, 1968.
  • 19. ANDEBSON, N.H. Comment on "An analysis of variance model for die assessment of configural cue utilization in clinical judgment.'' Psychological Bulletin, 1969, 72, 63-65. ANDERSON, T.W. An introduction to muttivariate statistical analysis. New York: Wiley, 1958, pp. 126-138. ARGYRIS, c. Some unintended consequences of rigorous research. Psychological Bulletin, 1968, 70, 185-197. ASCH, s.E. Forming impressions of personality. Journal of Abnormal and Social Psychology, 1946, 41, 258-290. BIER], J . , ATKINS, A X . , BRIAR, S., LEAMAN, R.L., MILLER, H., & TRIPODI, T. and social judgment. New York: Wiley, 1966. BRUNSWICK, E. Systematic and representative design of psychological experiments. Berkeley, California: University of California Press, 1947. CATTELL, R.B. The scientific analysis of personality. Harmondsworth: Penguin Books, 1965. 5 4 J . T. PARTINGTON & L. CLARKE GOLDBERG, L.R. Simple models or simple processes? Some research on clinical judg- ments. American Psychologist, 1968, 23, 483-496. HAYS, W.L. Statistics for Psychologists. New York: Holt, Rinehart, and Winston, 1963. HAHMAN, H.H. Modern factor analysis. Chicago: The University of Chicago Press, 1960.
  • 20. BOFFMAN, F.J., SLOVIC, P., * BORER, L.G. An analysis-of- variance model for the assessment of configured cue utilization in clinical judgment Psychological Bulletin, 1968, 69, 338-349. JACKSON, D.N. Personality Research Form Manual. Goshen, New York: Research Psychologists Press, 1967. KELLJEY, H.H. The warm-cold variable in first impressions of persons. Journal of Personality, 1950, 18, 431-439. LAY, C H . , & JACKSON, D.N. An analysis of the generality of trait inferential networks. Journal of Personality and Social Psychology, 1969,12,12-21. LOEVINGER, j . Objective tests as instruments of psychological theory. Psychological Reports, 1957, 3, 638-694. LOVEIX, V.R. The human use of personality tests; a dissenting view. American Psychologist, 1967, 22, 383-393. NEWCOMB, T.M. The acquaintance process. New York: Holt, Rinehart, and Winston, Inc. 1961. NUNAIXT, j . Psychometric Theory. New York: McGraw-Hill, 1967. OWENS, W.A. Toward one discipline of scientific psychology. American Psychologist, 1968, 23, 782-785. PARTINGTON, J.T. A test of averaging, adding, and dynamic models in personality impression formation. Unpublished Doctoral Dissertation, University of Western Ontario, 1966. PARTINGTON, J.T. Generality of the simple averaging model in personality impression formation. Psychonomic Science, 1967,8,339-340.
  • 21. PARTINGTON, J.T. Dr. JekyD and Mr. High: Multidimensional scaling of Alcoholics' self-evaluations. Journal of Abnormal Psychology, 1970, 75,131-138. PARTINGTON, J.T., * JACKSON, D.N. A multidimensional scaling evaluation of alter- native models in personality impression formation. Psychonomic Science, 1968,10, 331-332. SCHRAUGER, s., & ALTROCCHi, j . The personality of the perceiver as a factor in person perception. Psychological Bulletin, 1964,62,289-308. TRIANDIS, H.C., & FisHBEiN, M. Cognitive interaction in person perception. Journal of Abnormal and Social Psychology, 1963, 67,446-453. WINCH, H J . Mate-selection: A study of complementary needs. New York: Harper and Row, Publishers, Incorporated, 1958. WINER, B. Statistical Principles in Experimental Design. New York: McGraw-Hill, 1962. WISMNKH, j . Reanalysis of Impressions of personality." Psychological Review, I960, 67, 96-112. First recetoed 22 January 1970 Journal of Vocational Rehabilitation 20 (2004) 143–150 143 IOS Press Perspectives on Scientific Inquiry Correlational designs in rehabilitation
  • 22. research Shawn M. Fitzgerald∗ , Phillip D. Rumrill, Jr. and Jason D. Schenker Kent State University, Department of Educational Foundations and Special Services, 413 White Hall, PO Box 5190, Kent, OH 44242-0001, USA Tel.: +1 330 672 00583; Fax: +1 330 672 2512; E-mail: [email protected] Abstract. The article describes correlational research designs as a method for testing relationships between or among variables of interest in the lives of people with disabilities. The authors describe conceptual aspects of correlational research, discuss the methods by which researchers select variables for this type of inquiry, explain the primary purposes of correlational studies, and overview data analytic strategies. These discussions are illustrated with examples from the contemporary vocational rehabilitation literature. Keywords: Correlational research, research design, data analysis 1. Introduction Investigating relationships among variables in the lives of people with disabilities is one of the most ba- sic and important aspects of rehabilitation research [2]. In fact, gaining a deeper understanding of the connec- tions that exist among human phenomena is an abid- ing impetus for scientific inquiry in all of the social science disciplines, and that impetus transcends even the most polarized paradigmatic distinctions between various research methods (e.g., qualitative vs. quan-
  • 23. titative, descriptive vs. inferential, experimental vs. non-experimental). Rather than attempting to infer causality by system- atically manipulating the independent variable (as is done in experimental research), correlational studies assess the strength of relationships as they occur or have occurred without experimental manipulation. Based on the observed relationships, statistical significance tests are then applied to determine the predictive or explanatory power of those relationships under study. ∗ Corresponding author. In this article, we describe issues related to using and interpreting data from correlational designs in contem- porary rehabilitation research. The purposes, assump- tions, and limitations that inhere to correlational re- search are presented, illustrated with examples from existing literature. 1.1. Purpose of correlational designs Correlational designs are typically used by re- searchers for the purpose of exploring relationships among variables that are not manipulated or cannot be manipulated. For example, Boschen [5] used a cor- relational design to study the relationship between in- come and life satisfaction among people with disabili- ties. Capella [6] used a correlational design to study the relationships among age, case costs, and income within a sample of participants with visual impairments. Cor- relational designs were appropriate in these studies be- cause it is not possible to manipulate variables such as income, life satisfaction, age, and case costs. Although participants in these types of studies are assumed to
  • 24. possess the characteristics of interest prior to the study, 1052-2263/04/$17. – IOS Press and the authors. All rights reserved 144 S.M. Fitzgerald et al. / Correlational designs in rehabilitation research Table 1 Typical data requirements for correlational designs and analysis Subject Life-Satisfaction Income 1 85 45,000 2 66 32,000 3 42 48,000 4 78 42,000 5 25 22,000 and they are measured on those characteristics dur- ing the study, no attempt is made by the researcher to change them. In correlational research studies, it is important to note that researchers often use terms such as predictor and criterion instead of independent and dependent to discuss variables because this is the ap- propriate terminology to use when conducting studies that do not experimentally manipulate variables under investigation. Because variables are not manipulated, causation is difficult to infer using correlational designs. Al- though variables may be chosen as predictors because they are theoretically expected to explain differences in the criterion variable, a significant statistical rela-
  • 25. tionship between these variables does not prove causal- ity. However, a statistically significant relationship be- tween variables is a precondition of causality. Research consumers may draw causal inferences based on the total evidence generated in a number of correlational studies. Theory-based hypotheses used in correlational studies propose the direction and/or temporal sequence of variables, which is another necessary but not suffi- cient precondition for establishing causality. 1.2. Interpreting relationships in correlational designs To understand the nature of various relationships that could be examined in conducting correlational studies, consider the data presented in Table 1. Note that with correlational designs at least two points of data related to variables of interest must be collected for each in- dividual. In this example, every individual has pro- vided data on income level and life satisfaction. To understand how variables co-vary (i.e., are related) re- searchers use scatterplots, which require data from one variable to be plotted against data from another variable for each individual in the study. Scores for one variable are plotted on a horizontal axis, referred to as the x axis, and scores from the other variable are plotted on a vertical axis, called the y axis. To plot a data point on the scatterplot for an individual, a researcher would locate scores on each axis for each variable and then Table 2 Guidelines for interpreting correlation coefficients Range of values Interpretation +0.75 to+1.00 Strong positive relationship
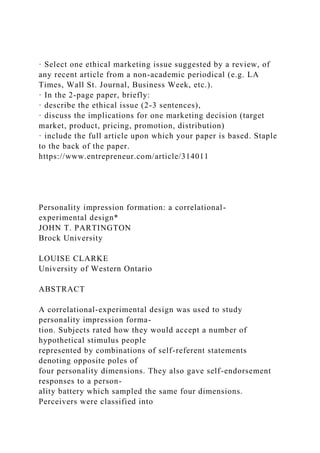
  • 26. +0.50 to+0.75 Moderate to strong positive relationship +0.25 to+0.50 Weak to moderate positive relationship 0.00 to+0.25 Zero to weak positive relationship 0.00 to−0.25 Zero to weak negative relationship −0.25 to−0.50 Weak to moderate negative relationship −0.50 to−0.75 Moderate to strong negative relationship −0.75 to−1.00 Strong negative relationship mark a spot on the graph where these two scores would meet. Figures 1, 2, and 3 present scatterplots of three types of relationships that might exist among variables. If there is a positive relationship among two variables, higher scores on one variable would tend to be associ- ated with higher scores on another variable. This type of relationship is illustrated in Fig. 1. If a negative re- lationship exists between two variables, higher scores on one variable would tend to be associated with lower scores on another variable. This type of relationship is illustrated in Fig. 2. If there is no relationship between variables a pattern of scores similar to those illustrated in Fig. 3 would be observed. Scatterplots are not only useful for understanding the direction of a relationship between two variables; they are also useful for understanding the magnitude or strength of the relationship between two variables. To estimate the strength of a relationship, a researcher would consider the closeness of data points plotted on the scatterplot. Points that cluster closely together indicate strong relationships, such as those illustrated in Figs 1 and 2, whereas points that are not tightly clustered indicate weak or no relationships. Figure 3 presents data representing a weak relationship between two variables.
  • 27. The calculations for determining correlational statis- tics result in both positive and negative values that range from −1 to +1. Negative values are associated with negative relationships between variables and positive values are associated with positive relationships. The closer the correlational statistic (also known as a coef- ficient) is to−1 or +1, the stronger the relationship. Correlational statistics close to 0 indicate weak rela- tionships. If there were no relationship at all between two variables, a value of 0 would be reported. Al- though there are no binding rules for determining what constitutes a strong, moderate, or weak relationship, Table 2 provides a guide for interpretating corelational statistics. S.M. Fitzgerald et al. / Correlational designs in rehabilitation research 145 Variable A (X axis) 4.03.53.02.52.0 V ar ia b le B ( Y
  • 28. a xi s) 700 600 500 400 Fig. 1. Scatterplot of a positive relationship between two variables. Variable A (X axis) 6050403020 V ar ia b le B ( Y a xi s)
  • 29. 10 8 6 4 2 0 Fig. 2. Scatterplot of a negative relationship between two variables. 1.3. Variables in correlational designs Correlational designs are prevalent in the social sci- ences and rehabilitation research primarily because they can be used for any research study in which it is not necessary (or possible) to manipulate the indepen- dent variable of interest. The versatility of this type of research design is borne in the multitude of correla- tional analyses that exist for investigating relationships between or among variables. 146 S.M. Fitzgerald et al. / Correlational designs in rehabilitation research Variable A (X axis) 2.722.702.682.662.642.622.602.582.562.54
  • 30. V ar ia b le B ( Y a xi s) 510 500 490 480 470 Fig. 3. Scatterplot of no relationship between two variables. Table 3 A summary of the hierarchy of measurement scales used in the social sciences Properties Scale Examples One category is different from another Nominal Gender, race
  • 31. Categories are different and ranked in order Ordinal Supervisor rankings, letter grades Categories are different and ranked in order plus differences between points are equal Interval Standardized tests Categories are different, ranked in order, differ- ences between points are equal and a true zero Ratio Height, weight As with all statistical analyses, deciding on the ap- propriate correlational analysis is dependent on the measurement properties of the variables under consid- eration [2]. In general, measurement refers to the pro- cess of assigning numbers to the responses of individ- uals according to a specific set of rules [3]. In other words, measurement is a process that involves quan- tifying or assigning numbers to the different charac- teristics or levels of the variables in a research study. Stevens [14] suggested a four-level hierarchy of mea- surement, and Table 3 summarizes this hierarchy. It is important to note that the specific rules used in assigning numbers to responses of individuals should not be taken lightly by those conducting research in the social sciences. The types of measurements ultimately determine the mathematical manipulations that could appropriately be applied to the data generated from a variable, thereby limiting the type of statistical tests that might also be applied to those data. For example, mathematically, it is inappropriate to calculate an aver- age (i.e., mean) score when variables are measured on either the nominal or ordinal scales. This is limiting
  • 32. because most parametric statistics utilize a mathemat- ical average or mean as the basis for analyzing data. However, means can be calculated for variables that are measured on either interval or ratio scales. Be- cause the distances between scale points are equal dis- tances for both of these scales, most mathematical ma- nipulations that are required when applying parametric statistics are possible. Measurements taken using these scales, for example, allow for meaningful calculations of averages, standard deviations, and variances – which form the essential “building blocks” for most paramet- ric statistics, including most correlational analyses. 1.4. Overview of data analytic strategies in correlational designs Data from correlational designs are often analyzed using a variety of bi-variate correlational statistics, as S.M. Fitzgerald et al. / Correlational designs in rehabilitation research 147 Measurement of the Variable is Interval/Ratio Measurement of the Variable is Ordinal Measurement of the Variable is Nominal
  • 33. How is the One Variable Measured ? How is the Other Variable Measured ? What is the Appropriate Correlational Analysis ? Pearson’s r, Biserial Point-Biserial Biserial Spearman Rank Biserial Point-Biserial Rank Biserial, Phi, Chi-Square, C Coefficient Interval or Ratio Ordinal Nominal Interval or Ratio
  • 34. Ordinal Nominal Interval or Ratio Ordinal Nominal Fig. 4. Correlational analyses for assessing relationships or associations between variables. well as both simple regression and multiple regres- sion. Correlational statistics characterize both the na- ture and magnitude of the relationship between two variables [2]. Bi-variate correlation coefficients and simple regression analyses are used to demonstrate the relationship between one predictor variable and one criterion variable. When researchers are interested in determining the relationship of several predictor vari- ables as they relate to one criterion variable, multiple regression analyses are typically used. Data from more complex correlational designs may be analyzed using canonical correlations or path analysis when multiple criterion variables and multiple predictor variables are assessed simultaneously or when complex theoretical models are analyzed. Figure 4 presents various correla- tional analyses that are commonly used in rehabilitation research for investigating relationships, whereas Fig. 5 presents the most commonly used regression analyses. 1.5. Using correlational designs for the purposes of prediction or explanation Although the two are not mutually exclusive, corre-
  • 35. lational studies can be conducted for either predictive or explanatory purposes [11,12]. In predictive studies, researchers gather data on one or more predictor vari- able and one criterion variable that is hypothesized to occur after the predictor variable(s). For example, a researcher might investigate the relationship between intelligence and academic success – here, intelligence is hypothesized to predict academic success, not vice- versa. A graduate program in rehabilitation counsel- ing might use Graduate Record Examination (GRE) scores and undergraduate grade-point average to pre- dict graduate-level academic performance. Another researcher might consider the number of disability- related worksite barriers as a predictor of job satisfac- tion. Explanatory studies make use of theoretically cho- sen predictor variables that are hypothesized to account for the variance in the criterion variable [12]. Here, the emphasis is placed on illuminating the theoretical nature, direction, and sequence of the relationship be- tween or among study variables. Although a researcher who conducts a predictive study would be concerned about choosing variables that accurately predict scores on the criterion variable regardless of their theoretical relevance,a researcher conducting an explanatorystudy would be concerned about choosing predictor variables that are theoretically expected to explain, or account for, variance in the criterion variable. For example, the graduate programmentioned previously would not nec- essarily be concerned about the theoretical relevance of their predictor variables, only their accuracy in predict-
  • 36. 148 S.M. Fitzgerald et al. / Correlational designs in rehabilitation research Criterion Variable is Interval/Ratio Criterion Variable is Ordinal Criterion Variable is Nominal How is the Criterion Variable Measures ? How are the Predictor Variables Measured ? What is the Appropriate Analysis? Simple/Multiple Linear Regression Log-Linear Analysis or Multinomial Analysis Simple/MultipleLogistic Regression Interval or Ratio Ordinal
  • 37. Nominal Interval or Ratio Ordinal Nominal Interval or Ratio Ordinal Nominal Fig. 5. Regression analyses for assessing relationships or associations among variables. ing graduate-level academic performance. However, if a researcher wanted to conduct an explanatory study of graduate-level academic performance, he or she might include socioeconomic, personality, and motivational variables that previous research has shown to be rele- vant to success in graduate school. Most often, corre- lational studies published in rehabilitation journals are explanatory in nature. 1.6. Issues in interpreting data from correlational designs Correlational studies present a number of concerns for the researcher as he or she attempts to interpret data. For example, multicollinearity becomes a concern with predictive as well as explanatory studies when multiple predictor variables are included in the regression equa- tion. Multicollinearity occurs when two or more of the
  • 38. predictor variables are highly correlated with one an- other. This presents a problem because the researcher cannot ascertain the unique predictive or explanatory influence of each predicator variable because those variables are too similar as evidenced by their high cor- relation with one another. However, researchers who conduct correlational studies generally wish to achieve the highest degree of accuracy in prediction or expla- nation with the fewest predictor variables. Therefore, predictor variables that are highly correlated with other predictor variables are considered redundant and often eliminated from the regression equation. Other concerns that face rehabilitation researchers who use correlational designs include the quality and consistency of data collection and recording activities (especially in ex post facto studies where data have been collected for a purpose other than the research study being conducted), the tendency to rely primarily on self-report data, and the specification of directional aspects of observed relationships (i.e., which comes first, the independent or dependent variable). 1.7. Examples of correlational studies Bolton et al. [4] used hierarchical multiple regres- sion analysis to examine the predictive utility of several independent variables vis-à-vis the dependent variables of competitive employment status and weekly salary for successful rehabilitants. Specifically, the authors ex- amined the predictive power of personal history (demo- graphic variables), functional limitations (adaptive be- havior, cognition, physical condition, motor function, communication, and vocational qualification), and re- habilitation services (placement, personal adjustment,
  • 39. training, restoration, maintenance, time in active sta- tus, and total costs). The study included data from S.M. Fitzgerald et al. / Correlational designs in rehabilitation research 149 VR clients (N = 4, 603) from five disability groups: orthopedic, chronic medical, psychiatric, mental retar- dation, and learning disabilities. The authors found that the three independent variables combined to ac- count for approximately one-third of the variability in competitive employment status (25% to 40% depend- ing on disability group) and approximately one-eighth of the variability in weekly salary (9% to 17% depend- ing on disability group). Personal history accounted for approximately five percent of the variability in both competitive employment and weekly salary. Capella [6] conducted a correlational study designed to predict the earnings of former VR clients. The au- thor examined the relationship between education, age, services, case costs, and months of services (predic- tor variables) and earnings (criterion variable) among a sample of participants (N = 16, 270) with visual im- pairments. The author found that age had the strongest, although negative, relationship to earnings, followed by education and cost of case services. Number of ser- vices and months the case was open were both found to be significantly related to earnings, but they accounted for little variance beyond that attributable to age, edu- cation, and case costs. Strauser and Ketz [13] used multiple regression to test Hershenson’s theory of work adjustment, examin-
  • 40. ing the relationships among job-readiness self-efficacy, work locus of control, and work personality within a sample (N = 104) of participants diagnosed with men- tal retardation, mental illness, or substance abuse dis- orders. Work personality was defined by the authors as the person’s self-concept as a worker, motivation for work, and work-related needs and values. The authors also examined work competencies, which were defined as work habits, physical and mental skills, and inter- personal skills. The authors found that work person- ality (acceptance of work role, ability to profit from instruction and correction, work persistence, and work tolerance combined) significantly predicted internal lo- cus of control and job-readiness self-efficacy. How- ever, only work persistence provided a unique predic- tive contribution beyond the other subscales in the work personality inventory with regard to locus of control. Also, ability to profit from instruction and correction provided a unique contribution to job-readiness self- efficacy. In addition, the authors examined the correla- tions between demographic variables (number of jobs held, number of days since last worked, and number of times fired or asked to leave a job) and work person- ality, locus of control, and self-efficacy. Strauser and Ketz found a significant positive correlation between the number of jobs held and work personality. Wilson et al. [15] provided an example of the use of binary logistic regression, using VR acceptance rate as the criterion variable and race, gender, education, work status at application, and primary source of sup- port at application as the predictor variables. The origi- nal sample consisted of 599,444 consumers who sought VR services. The authors then chose 2,476 participants from each of four racial categories, and coded them on whether they were accepted for VR services. The au-
  • 41. thors found that African Americans and Native Ameri- cans were more likely than European Americans to be accepted for VR services, whereas Asians or Pacific Islanders were less likely than European Americans to be accepted for VR services. In addition, participants with more available resources were less likely to be accepted for VR. Finally, the researchers found that as a participant’s education increased, the likelihood that he or she was accepted for VR services decreased. Numerous other correlational studies can be found in recent rehabilitation research. Horton and Wal- lander [9] examined the relationship between care- giver disability-related stress, social support, and hope (predictor variables) and distress (criterion variable). Hampton [8] examined the relationships between (a) various demographic predictor variables and self- efficacy and (b) a quality of life criterion variable among Chinese individuals with spinal cord injuries, finding that self-efficacy, health status, income, educa- tional level, and time spent on voluntary work were sig- nificantly correlated with quality of life. Bellini [1] ex- amined the relationship between several demographic predictor variables and multicultural counseling com- petencies on the part of VR counselors, reporting that females, members of ethnic minority groups, and those who have attended a greater number of multicultural counseling workshops exhibited greater multicultural counseling competencies. Chase et al. [7] studied per- ceived control, verbal communication skills, satisfac- tion with personal assistance, marital status, and hand- icap as predictors of life satisfaction among persons with spinal cord injuries. They found that perceived control and marital status were the strongest predictors of life satisfaction. Finally, Mullins et al. [10] con- ducted a hierarchical multiple regression analysis to ex-
  • 42. amine the relationship between the predictor variables of illness intrusiveness and illness uncertainty and the criterion variable of severity of psychological distress among individuals diagnosed with multiple sclerosis. Results indicated that the two independent variables significantly predicted severity of distress beyond the predictive power of various demographic and illness variables. 150 S.M. Fitzgerald et al. / Correlational designs in rehabilitation research 2. Conclusion Correlational research investigations comprise a sub- stantial proportionof the empirical literature in the field of vocational rehabilitation. Utilized primarily for the purposes of prediction and explanation, correlational designs enable researchers to test the magnitude and direction of relationships between and among impor- tant variables in the lives of people with disabilities and rehabilitation professionals. These studies test rela- tionships as they occur or as they have occurred, rather than manipulating independent variables or introduc- ing an intervention as is commonly done in experimen- tal research. Therefore, the demonstration or verifi- cation of causal linkages between or among variables is not the objective of correlational research. By un- derstanding the most common applications of correla- tional research, by being able to identify appropriate variables for relationship-testing, and by familiarizing themselves with procedures used to predict or explain outcomes of interest in the field of vocational rehabil- itation, rehabilitation professionals can gain a deeper
  • 43. appreciation of the manner in which variable relation- ships express themselves in the rehabilitation process, as well as in the lives of people with disabilities. References [1] J. Bellini, Correlates of multicultural counseling competencies of vocational rehabilitation counselors,Rehabilitation Coun- seling Bulletin 45(2) (2002), 66–75. [2] J. Bellini and P. Rumrill,Research in rehabilitation counsel- ing, Springfield, IL: Charles C. Thomas, 1999. [3] B. Bolton, Rehabilitation counseling research, Baltimore: University Park Press, 1979. [4] B.F. Bolton, J.L. Bellini and J.B. Brookings, Predicting client employment outcomes from personal history, functional limi- tations, and rehabilitation services,Rehabilitation Counseling Bulletin 44(1) (2000), 10–21. [5] K. Boschen, Correlates of life satisfaction, residential satis- faction, and locus of control among adults with spinal cord in- juries,Rehabilitation Counseling Bulletin 39(4) (1996), 230– 243. [6] M.E. Capella, Predicting earnings of vocational rehabilita- tion clients with visual impairments,Journal of Rehabilitation 67(4) (2001), 43–47. [7] B.W. Chase, T.A. Cornille and R.W. English, Life satisfaction among persons with spinal cord injuries,Journal of Rehabili-
  • 44. tation 66(3) (2000), 14–20. [8] N.Z. Hampton, Self-efficacy and quality of life in people with spinal cord injuries in China,Rehabilitation Counseling Bul- letin 43(2) (2000), 66–74. [9] T.V. Horton and J.L. Wallander, Hope and social support as re- silience factors against psychological distress of mothers who care for children with chronic physical conditions,Rehabili- tation Psychology 46(4) (2001), 382–399. [10] L.L. Mullins, M.P. Cote, B.F. Fuemmeler, V.M. Jean, W.W. Beatty and R.H. Paul, Illness intrusiveness, uncertainty, and distress in individuals with multiple sclerosis,Rehabilitation Psychology 46(2) (2001), 139–153. [11] E. Pedhazur,Multiple regression in behavioral research, New York, NY: Harcourt Brace, 2002. [12] E.J. Pedhazur and L.P. Schmelkin,Measurement, design, and analysis: An integrated approach, Hillsdale, NJ: Erlbaum, 1991. [13] D.R. Strauser and K. Ketz, The relationship between self- efficacy, locus of control and work personality,Journal of Rehabilitation 68(1) (2002), 20–26. [14] S.S. Stevens, Mathematics, measurement, and psychophysics, in: Handbook of experimental psychology, S.S. Stevens, ed., New York: Wiley, 1951, pp. 1–49.
  • 45. [15] K.B. Wilson, R.J. Alston, D.A. Harley and N.A. Mitchell, Predicting VR acceptance based on race, gender, education, work status at application, and primary source of support at application,Rehabilitation Counseling Bulletin 45(3) (2002), 132–142. · Select one ethical marketing issue suggested by a review, of any recent article from a non-academic periodical (e.g. LA Times, Wall St. Journal, Business Week, etc.). · In the 2-page paper, briefly: · describe the ethical issue (2-3 sentences), · discuss the implications for one marketing decision (target market, product, pricing, promotion, distribution) · include the full article upon which your paper is based. Staple to the back of the paper.