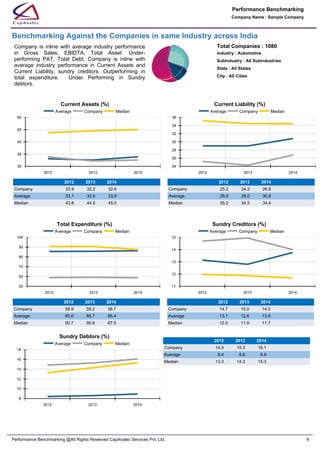
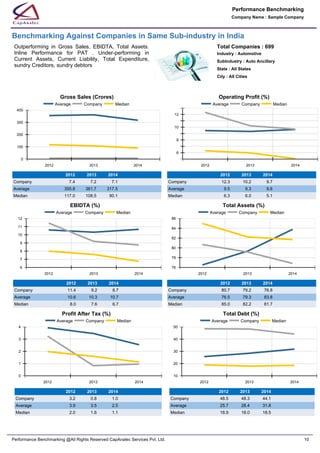
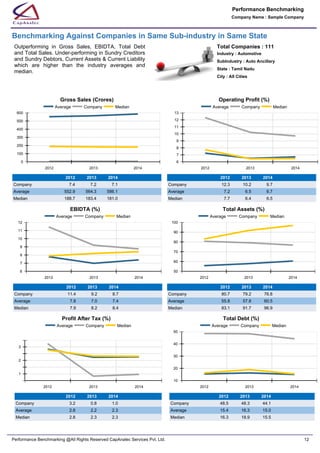
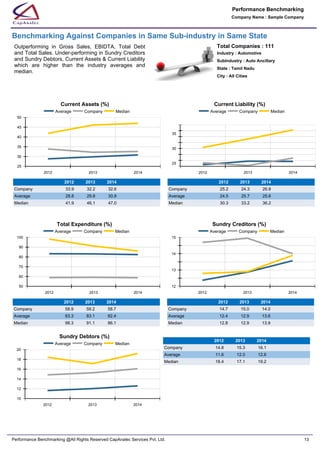
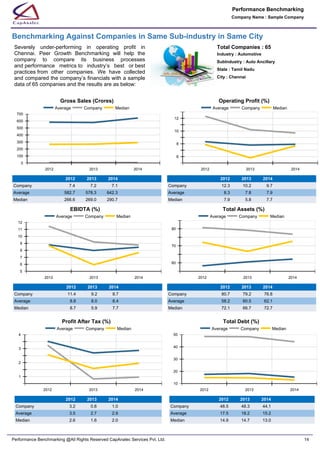
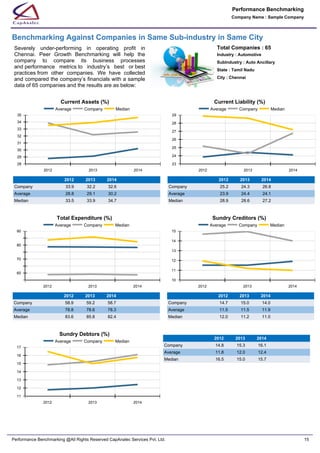
SlideShare a Scribd company logo
1 of 17
Download to read offline
Aug 18, 2016Report Date : 
Issued by an analyst at CapAnalec Services Pvt. Ltd on Online Risk Assessment and Compliance 
(ORAC) Platform. website : www.capanalec.com.  @Copyrights 2016-2017
Company : Sample Company
Performance Benchmarking
Analytics & Advisory
Index
1. Executive Benchmarking Summary
Benchmarking Rationale  •
Analyst Recommendations  •
3. Composite Trend Benchmarking
Profitability Trend•
ROI Trend•
Capital Efficiency Trend•
Solvency Trend•
Lending Sufficiency Trend•
4. Financial Data Benchmarking
Benchmarking Against Companies in Same Industry in India  •
Benchmarking Against Companies in Same Sub-industry in India•
Benchmarking Against Companies in Same Sub-industry in Same State•
Benchmarking Against Companies in Same Sub-industry in Same City•
5. Annexure
2. Financial Statements
Profit and Loss Account•
Balance Sheet•
Company Name : Sample Company
Performance Benchmarking
Performance Benchmarking @All Rights Reserved CapAnalec Services Pvt. Ltd. 2
CapAnalec Predictive Credit Risk Rating Analytics, Performance Benchmarking
Analytics, Business Valuation Analytics, Vendor Default Risk Analytics, VC/PE
Investment  Risk  Analytics  solutions  and  advisory  reports  and  any  other  Risk
Analytical  reports,  are  not  recommendation  or  opinion  that  is  intended  to
substitute  for  a  financial  advisor's  or  investor's  independent  assessment  of
whether to buy, sell or hold any financial product or to sanction, renew, disburse
or  recall  the  concerned  credit  facility  or  investment  envisaged.  Our  various
analytics solutions and advisory statement are only statement of opinion derived
objectively  through  our  cloud  based  risk  analytics  software  (ORAC),  various
sources of public information and other statutory information sources like ROC.
The  research  information  contained  therein  is  an  objective  and  independent
reference source, which should be used in conjunction with other information in
forming  the  basis  for  an  investment  decision.  CapAnalec  has  based  its  risk
assessment on the information obtained from the sources believed by it to be
accurate and reliable. CapAnalec does not, however, guarantee the accuracy,
adequacy  or  completeness  of  any  information  and  is  not  responsible  for  any
errors or omissions or for the results obtained from the use of such information.
Although reasonable care has been taken to ensure that the information herein
is true, such information is provided ‘as is’ without any warranty of any kind, and
CapAnalec and its group companies in particular, makes no representation or
warranty, express or implied, as to the accuracy, timeliness or completeness of
any such information. All information contained herein must be construed solely
as statements of opinion, and CapAnalec and its group companies shall not be
liable  for  any  losses  incurred  by  users  from  any  use  of  this  document  or  its
contents in any manner. Opinions expressed in this document should only be
construed as any indication of credit score for specific purpose on behest of the
said  subscriber  alone  for  its  own  consumption.  Finally,  CapAnalec  Services
Private Limited and its employees accept no liabilities whatsoever for any direct,
indirect or consequential loss of any kind arising from the use of its rating and
rating research in way whatsoever, unless CapAnalec services Private Limited is
negligent  in  miss  interpreting  or  manipulating  the  data,  in  which  case,  our
maximum liability to our clients is the amount of our fee for the report.
Capanalec Privacy :
CapAnalec respects your privacy. We use your contact information, such as 
your name, address, and Email ID, to fulfill your request and service your 
account and to provide you with additional information from CapAnalec for your 
interest.
Analyst Disclosure: Each member of the team involved in the preparation of the 
grading report, hereby affirms that there exists no conflict of interest that can 
bias the grading recommendation of the company.
Analyst Disclosure :
Company Name : Sample Company
Performance Benchmarking
Performance Benchmarking @All Rights Reserved CapAnalec Services Pvt. Ltd. 3
Company Profile Overview
UCAL  Fuel  System  Limited  offers  comprehensive  Fuel  Management  Systems  for  Automotive  sector.  The
company  manufactures  pumps,  emission  control  parts  and  various  components  for  both  ferrous  and  non
ferrous  material.  With  its  expertise  in  automotive  components,  UCAL  Group  has  been  providing  customers
with end - to - end solution from product designing to analysis, prototyping, testing and validation services. The
company has one of the most advanced R & D centers in the industry.
Company Full Name UCAL Fuel Systems Ltd
Year Of Incorporation 1985
Nature Of Business Manufacturing
Incorporation Legal
Status
Public Ltd
Industry Type Automotive
Legal History None
Registered With ROC
Category of Entrepreneur General
Listed At BSE,NSE,Any Other Stock Exchange
Registered Office
UCAL  Fuel  Systems  Limited,,  “Raheja
Towers”,,  Delta  Wing  –  Unit  705,,  177
Anna  Salai,,  Chennai,  Chennai,  Tamil
Nadu, 600002
Manufacturing Facility Haryana,Tamil Nadu,Puducherry
Number Of Employees 500
Certification & Awards
2009  -  National  Energy  Conservation
Award  by  The  Bureau  of  Energy
efficiency,  New  Delhi,  etc.,  2009  -
BOSCH  Supplier  Award  for  maximizing
value to the customer, etc.
Contact Person
Ms.Rekha  Raghunathan(Company
Secretary and Compliance Officer)
Contact Number +91 44422 08111
Email Id investor@ucalfuel.co.in
Website www.ucalfuel.com
Board And Management
Mr. Jayakar Krishnamurthy
Products
Services
Products And Services
1 Carburettors for two wheelers
2 Gasoline fuel injection system products
3 Engine management systems
4 Products for diesel applications and emission control
5
Pumps to high pressure die casting and precision 
manufacturing products
Company Name : Sample Company
Performance Benchmarking
Performance Benchmarking @All Rights Reserved CapAnalec Services Pvt. Ltd. 4
Financial Statements Analysis
Year 2012 2013 2014
Nature Of Financials Audited Audited Audited
Gross Sales 738.1 724.5 709.6
Net Sales 680.3 653.6 643.8
Non Operating Income 6.5 7.3 6.8
Manufacturing Expenses 406.4 403.8 388.9
WIP change in stock 0.6 -1.3 0.1
Depreciation 28.1 26.8 27.5
Cost Of Production 435.1 429.4 416.5
FG change in stock -0.6 -0.7 0.2
Cost Of Sales 434.5 428.7 416.7
Admin. & Selling Expenses 189.4 185.0 192.5
Miscellaneous Expenses 5.1 4.9 4.7
Finance Charges 35.6 37.8 35.6
Non Operating Expenses -5.2 -1.1 -4.2
Profit Before Tax 32.4 10.4 10.0
Tax 8.5 4.4 3.1
Net Profit for the year ( PAT) 23.9 6.0 6.8
Summary of Profit & Loss Statement
Summary of Balance Sheet
Year 2012 2013 2014
Nature Of Financials Audited Audited Audited
Share Capital 22.1 22.1 22.1
Reserves and Surplus 40.0 36.9 33.5
Secured Loans 357.7 349.7 313.3
Preference Shares 0.0 0.0 0.0
Unsecured Loans 56.8 53.8 57.2
Total Debt 357.7 349.7 313.3
Deferred Tax Liability -10.3 -11.2 -13.8
Fixed Assets 332.2 322.3 300.5
Intangibles Assets 1.6 1.9 1.3
Investments 0.0 0.0 0.1
Inventories 75.0 72.6 70.4
Sundry Debtors 110.1 115.5 116.9
Cash and Bank Balances 6.5 6.4 2.9
Loans and Advances 59.0 43.6 43.7
Non Current Assets 11.8 16.2 12.1
Current Liabilities 185.9 175.9 190.0
Total Assets 595.5 573.4 545.1
Total Liabilities 595.5 573.4 545.1
Capital Growth Trend
2012 2013 2014
0
100
200
300
400
500
600
Net Worth Total Assets
Total Debt
The  company  carrying  very  high  debt
over  its  balance  sheet.  Higher  liability
has  actually  pushed  the  financial  cost
much higher.
Profitability Growth Trend
The  profit/loss  trend    has  been
declining  due  to  higher  external
liability. There is major financial decline
in  the  year  2012.  However,  in  2013,
significant  efforts  have  been  put
towards bringing company back to the
track.
2012 2013 2014
0
100
200
300
400
500
600
700
PAT Revenue
Company Name : Sample Company
Performance Benchmarking
Performance Benchmarking @All Rights Reserved CapAnalec Services Pvt. Ltd. 5
Benchmarking
Summary
Benchmarking Rationale
Analyst Comments
Financial Performance Bench-marking of a company is an indicator of comparative strength
of financial parameter against an average and median of overall industry or sub-industry. It
provides an insights into comparative three years trend and strength of those parameters
showing out performance or under performance vis-a-vis industry benchmark.
In our first part we compare key ratio parameter of company like profitability, ROI, Capital
efficiency, Solvency, Lending sufficiency Trend for previous 3 years with average of industry
on pan India basis. Secondly, we compare with all the companies in sub-industry on pan
india basis, state level basis and City level basis. Thirdly, bench-marking report not only
analyze the trend for previous 3 years but also compare fundamental financial parameters
such as Gross sales, Operative profit, EBIDTA, PAT, Total Assets, Total Debt, Current
Assets, Current Liability, Sundry Debtors, Sundry Creditors and Total Expenditure trends.
Financial bench-marking analysis provides an tremendous insight into how company stands
against pan India Industry, sub industry state wise and city wise average and median
benchmarks.  
For these financial benchmarking evaluation, we have considered 1080 companies available
pan India in our database in the Automotive Industry, 699 in Auto-Ancillary sub-industry, 114
in Tamil Nadu and 65 companies in Chennai.
Performance Benchmarking  
a. Industry Composite Benchmarking : (With All companies pan India)
Profitability Trend  : Outperforming  
ROI Trend  : Underperforming  
Capital efficiency Trend  : Underperforming  
Lending Sufficiency Trend  : Underperforming  
b. Financial Bench-marking for key financial parameter  
Gross Sales  : In Line with pan india average of Industry, Outperforming in Sub industry,
Tamilnadu and Chennai companies  
Operating Profit  : Outperforming pan India, States and City Level  
EBIDTA  : Inline with pan india average, out-performance sub industry, states and city level  
Total Assets  : Inline with industry average, out performance with sub-industry, states and
city level  
Profit after Tax (PAT)  : Under performance on pan India average, Inline with sub industry
and states level, and under performing on city level    
Total Debt  : The company is hihgly leveraged and saddled with high debts as compared with
industry average  
On account of current assets(CA), current liability(CL), Total expenditure, Sundry Creditors
and Sundry debtors it is almsot inline with pan India averages. However it is under-
performing on sub-industry, states and city level  
Company Name : Sample Company
Performance Benchmarking
Performance Benchmarking @All Rights Reserved CapAnalec Services Pvt. Ltd. 6
Profitability Trend (%)
2012 2013 2014
-10
-5
0
5
10
15
Company Industry
2012 2013 2014
Company 10.6 8.3 7.9
Industry 4.5 -6.0 0.5
ROI Rating Trend (%)
2012 2013 2014
-10
0
10
20
30
40
50
Company Industry
2012 2013 2014
Company 47.4 36.8 37.6
Industry -2.0 5.4 -1.0
Lending Sufficiency Trend (Time)
2012 2013 2014
0
10
20
30
40
50
60
Company Industry
2012 2013 2014
Company 1.8 1.8 1.8
Industry 30.7 53.0 50.7
Solvency Trend (Time)
2012 2013 2014
0
1
2
3
Company Industry
2012 2013 2014
Company 2.6 2.6 2.6
Industry 2.1 1.2 -0.8
Capital Efficiency Trend (%)
2012 2013 2014
-5
0
5
Company Industry
2012 2013 2014
Company 4.8 4.4 4.7
Industry 1.3 3.3 -6.2
Composite Trend Benchmarking
Total Companies : 815
Industry : Automotive
SubIndustry : All Subindustries
State : All States
City : All Cities
Company  in overall Outperforming vis-a vis industry
in Profitability, ROI, Capital efficiency, and Solvency
Trend  during  FY2016.  However  due  to  highly
leveraged condition it is under-performing in Lending
sufficiency Trend.
Company Name : Sample Company
Performance Benchmarking
Performance Benchmarking @All Rights Reserved CapAnalec Services Pvt. Ltd. 7
Benchmarking Against the Companies in same Industry across India
Total Companies : 1080
Industry : Automotive
SubIndustry : All Subindustries
State : All States
City : All Cities
Company is inline with average industry performance
in  Gross  Sales,  EBIDTA,  Total  Asset.  Under-
performing  PAT,  Total  Debt.  Company  is  inline  with
average  industry  performance  in  Current  Assets  and
Current  Liability,  sundry  creditors.  Outperforming  in
total  expenditure.    Under  Performing  in  Sundry
debtors.
Gross Sales (Crores)
2012 2013 2014
0
200
400
600
800
Average Company Median
2012 2013 2014
Company 7.4 7.2 7.1
Average 777.0 793.8 750.3
Median 119.5 108.5 89.9
Operating Profit (%)
2012 2013 2014
2
4
6
8
10
12
14
Average Company Median
2012 2013 2014
Company 12.3 10.2 9.7
Average 7.9 7.4 7.3
Median 5.2 4.8 3.8
Profit After Tax (%)
2012 2013 2014
0
1
2
3
4
5
Average Company Median
2012 2013 2014
10
20
30
40
50
Average Company Median
Total Debt (%)
2012 2013 2014
Company 3.2 0.8 1.0
Average 4.1 3.4 3.1
Median 1.5 1.3 0.9
2012 2013 2014
Company 48.5 48.3 44.1
Average 18.6 20.0 21.1
Median 17.8 17.9 18.3
Total Assets (%)
2012 2013 2014
70
75
80
Average Company Median
2012 2013 2014
Company 80.7 79.2 76.8
Average 71.9 74.0 78.7
Median 79.2 82.2 83.1
EBIDTA (%)
2012 2013 2014
6
7
8
9
10
11
12
Average Company Median
2012 2013 2014
Company 11.4 9.2 8.7
Average 9.5 9.2 9.6
Median 6.7 6.2 6.0
Company Name : Sample Company
Performance Benchmarking
Performance Benchmarking @All Rights Reserved CapAnalec Services Pvt. Ltd. 8
Current Assets (%)
2012 2013 2014
30
35
40
45
50
Average Company Median
2012 2013 2014
24
26
28
30
32
34
36
Average Company Median
Current Liability (%)
2012 2013 2014
Company 33.9 32.2 32.6
Average 33.1 32.6 33.9
Median 43.8 44.5 45.0
2012 2013 2014
Company 25.2 24.3 26.8
Average 29.0 29.0 30.8
Median 35.2 34.5 34.4
Total Expenditure (%)
2012 2013 2014
50
60
70
80
90
100
Average Company Median
2012 2013 2014
11
12
13
14
15
Average Company Median
Sundry Creditors (%)
2012 2013 2014
Company 58.9 59.2 58.7
Average 85.6 85.7 86.4
Median 90.7 90.6 87.5
2012 2013 2014
Company 14.7 15.0 14.0
Average 13.1 12.8 13.8
Median 12.0 11.9 11.7
Sundry Debtors (%)
2012 2013 2014
8
10
12
14
16
18
Average Company Median
2012 2013 2014
Company 14.8 15.3 16.1
Average 8.4 8.6 8.9
Median 13.3 14.3 15.3
Benchmarking Against the Companies in same Industry across India
Total Companies : 1080
Industry : Automotive
SubIndustry : All Subindustries
State : All States
City : All Cities
Company is inline with average industry performance
in  Gross  Sales,  EBIDTA,  Total  Asset.  Under-
performing  PAT,  Total  Debt.  Company  is  inline  with
average  industry  performance  in  Current  Assets  and
Current  Liability,  sundry  creditors.  Outperforming  in
total  expenditure.    Under  Performing  in  Sundry
debtors.
Company Name : Sample Company
Performance Benchmarking
Performance Benchmarking @All Rights Reserved CapAnalec Services Pvt. Ltd. 9
Gross Sales (Crores)
2012 2013 2014
0
100
200
300
400
Average Company Median
2012 2013 2014
Company 7.4 7.2 7.1
Average 355.8 361.7 317.5
Median 117.0 108.5 90.1
Operating Profit (%)
2012 2013 2014
6
8
10
12
Average Company Median
2012 2013 2014
Company 12.3 10.2 9.7
Average 9.5 9.3 9.6
Median 6.3 6.0 5.1
Profit After Tax (%)
2012 2013 2014
0
1
2
3
4
Average Company Median
2012 2013 2014
10
20
30
40
50
Average Company Median
Total Debt (%)
2012 2013 2014
Company 3.2 0.8 1.0
Average 3.9 3.5 2.5
Median 2.0 1.6 1.1
2012 2013 2014
Company 48.5 48.3 44.1
Average 25.7 28.4 31.8
Median 18.9 18.0 18.5
Total Assets (%)
2012 2013 2014
76
78
80
82
84
86
Average Company Median
2012 2013 2014
Company 80.7 79.2 76.8
Average 76.5 79.3 83.8
Median 85.0 82.2 81.7
EBIDTA (%)
2012 2013 2014
6
7
8
9
10
11
12
Average Company Median
2012 2013 2014
Company 11.4 9.2 8.7
Average 10.6 10.3 10.7
Median 8.0 7.6 6.7
Benchmarking Against Companies in Same Sub-industry in India
Total Companies : 699
Industry : Automotive
SubIndustry : Auto Ancillary
State : All States
City : All Cities
Outperforming  in  Gross  Sales,  EBIDTA,  Total  Assets.
Inline  Performance  for  PAT  .  Under-performing  in
Current  Assets,  Current  Liability,  Total  Expenditure,
sundry Creditors, sundry debtors
Company Name : Sample Company
Performance Benchmarking
Performance Benchmarking @All Rights Reserved CapAnalec Services Pvt. Ltd. 10
Current Assets (%)
2012 2013 2014
30
35
40
45
50
Average Company Median
2012 2013 2014
24
26
28
30
32
34
36
Average Company Median
Current Liability (%)
2012 2013 2014
Company 33.9 32.2 32.6
Average 37.4 37.1 37.8
Median 46.1 44.2 42.6
2012 2013 2014
Company 25.2 24.3 26.8
Average 30.1 30.2 32.8
Median 35.9 33.8 33.2
Total Expenditure (%)
2012 2013 2014
50
60
70
80
90
Average Company Median
2012 2013 2014
12.5
13
13.5
14
14.5
15
Average Company Median
Sundry Creditors (%)
2012 2013 2014
Company 58.9 59.2 58.7
Average 83.9 83.6 84.6
Median 89.4 86.8 86.4
2012 2013 2014
Company 14.7 15.0 14.0
Average 12.8 12.6 13.1
Median 14.2 14.3 13.4
Sundry Debtors (%)
2012 2013 2014
13
14
15
16
17
18
Average Company Median 2012 2013 2014
Company 14.8 15.3 16.1
Average 13.1 13.1 14.5
Median 17.1 17.2 17.4
Benchmarking Against Companies in Same Sub-industry in India
Total Companies : 699
Industry : Automotive
SubIndustry : Auto Ancillary
State : All States
City : All Cities
Outperforming  in  Gross  Sales,  EBIDTA,  Total  Assets.
Inline  Performance  for  PAT  .  Under-performing  in
Current  Assets,  Current  Liability,  Total  Expenditure,
sundry Creditors, sundry debtors
Company Name : Sample Company
Performance Benchmarking
Performance Benchmarking @All Rights Reserved CapAnalec Services Pvt. Ltd. 11
Gross Sales (Crores)
2012 2013 2014
0
100
200
300
400
500
600
Average Company Median
2012 2013 2014
Company 7.4 7.2 7.1
Average 552.9 564.3 586.1
Median 188.7 183.4 181.0
Operating Profit (%)
2012 2013 2014
6
7
8
9
10
11
12
13
Average Company Median
2012 2013 2014
Company 12.3 10.2 9.7
Average 7.2 6.5 6.7
Median 7.7 6.4 6.5
Profit After Tax (%)
2012 2013 2014
1
2
3
Average Company Median
2012 2013 2014
10
20
30
40
50
Average Company Median
Total Debt (%)
2012 2013 2014
Company 3.2 0.8 1.0
Average 2.8 2.2 2.3
Median 2.8 2.3 2.3
2012 2013 2014
Company 48.5 48.3 44.1
Average 15.4 16.3 15.0
Median 16.3 18.9 15.5
Total Assets (%)
2012 2013 2014
50
60
70
80
90
100
Average Company Median
2012 2013 2014
Company 80.7 79.2 76.8
Average 55.8 57.8 60.5
Median 83.1 91.7 96.9
EBIDTA (%)
2012 2013 2014
6
7
8
9
10
11
12
Average Company Median
2012 2013 2014
Company 11.4 9.2 8.7
Average 7.8 7.0 7.4
Median 7.9 8.2 8.4
Benchmarking Against Companies in Same Sub-industry in Same State
Total Companies : 111
Industry : Automotive
SubIndustry : Auto Ancillary
State : Tamil Nadu
City : All Cities
Outperforming  in  Gross  Sales,  EBIDTA,  Total  Debt
and Total Sales. Under-performing in Sundry Creditors
and Sundry Debtors, Current Assets & Current Liability
which  are  higher  than  the  industry  averages  and
median.
Company Name : Sample Company
Performance Benchmarking
Performance Benchmarking @All Rights Reserved CapAnalec Services Pvt. Ltd. 12
Current Assets (%)
2012 2013 2014
25
30
35
40
45
50
Average Company Median
2012 2013 2014
25
30
35
Average Company Median
Current Liability (%)
2012 2013 2014
Company 33.9 32.2 32.6
Average 28.8 29.8 30.8
Median 41.9 46.1 47.0
2012 2013 2014
Company 25.2 24.3 26.8
Average 24.5 25.7 25.6
Median 30.3 33.2 36.2
Total Expenditure (%)
2012 2013 2014
50
60
70
80
90
100
Average Company Median
2012 2013 2014
12
13
14
15
Average Company Median
Sundry Creditors (%)
2012 2013 2014
Company 58.9 59.2 58.7
Average 83.3 83.1 82.4
Median 98.3 91.1 86.1
2012 2013 2014
Company 14.7 15.0 14.0
Average 12.4 12.9 13.6
Median 12.8 12.9 13.9
Sundry Debtors (%)
2012 2013 2014
10
12
14
16
18
20
Average Company Median
2012 2013 2014
Company 14.8 15.3 16.1
Average 11.6 12.0 12.6
Median 18.4 17.1 19.2
Benchmarking Against Companies in Same Sub-industry in Same State
Total Companies : 111
Industry : Automotive
SubIndustry : Auto Ancillary
State : Tamil Nadu
City : All Cities
Outperforming  in  Gross  Sales,  EBIDTA,  Total  Debt
and Total Sales. Under-performing in Sundry Creditors
and Sundry Debtors, Current Assets & Current Liability
which  are  higher  than  the  industry  averages  and
median.
Company Name : Sample Company
Performance Benchmarking
Performance Benchmarking @All Rights Reserved CapAnalec Services Pvt. Ltd. 13
Gross Sales (Crores)
2012 2013 2014
0
100
200
300
400
500
600
700
Average Company Median
2012 2013 2014
Company 7.4 7.2 7.1
Average 582.7 578.3 642.3
Median 266.6 269.0 290.7
Operating Profit (%)
2012 2013 2014
6
8
10
12
Average Company Median
2012 2013 2014
Company 12.3 10.2 9.7
Average 8.3 7.8 7.9
Median 7.9 5.8 7.7
Profit After Tax (%)
2012 2013 2014
1
2
3
4
Average Company Median
2012 2013 2014
10
20
30
40
50
Average Company Median
Total Debt (%)
2012 2013 2014
Company 3.2 0.8 1.0
Average 3.5 2.7 2.9
Median 2.6 1.6 2.0
2012 2013 2014
Company 48.5 48.3 44.1
Average 17.5 18.2 15.2
Median 14.9 14.7 13.0
Total Assets (%)
2012 2013 2014
60
70
80
Average Company Median
2012 2013 2014
Company 80.7 79.2 76.8
Average 58.2 60.5 62.1
Median 72.1 66.7 72.7
EBIDTA (%)
2012 2013 2014
5
6
7
8
9
10
11
12
Average Company Median
2012 2013 2014
Company 11.4 9.2 8.7
Average 8.8 8.0 8.4
Median 8.7 5.9 7.7
Benchmarking Against Companies in Same Sub-industry in Same City
Total Companies : 65
Industry : Automotive
SubIndustry : Auto Ancillary
State : Tamil Nadu
City : Chennai
Severely  under-performing  in  operating  profit  in
Chennai.  Peer  Growth  Benchmarking  will  help  the
company  to  compare  its  business  processes
and performance  metrics to  industry’s  best  or best
practices from  other  companies.  We  have  collected
and compared the company’s financials with a sample
data of 65 companies and the results are as below:
Company Name : Sample Company
Performance Benchmarking
Performance Benchmarking @All Rights Reserved CapAnalec Services Pvt. Ltd. 14
Current Assets (%)
2012 2013 2014
28
29
30
31
32
33
34
35
Average Company Median
2012 2013 2014
23
24
25
26
27
28
29
Average Company Median
Current Liability (%)
2012 2013 2014
Company 33.9 32.2 32.6
Average 28.8 29.1 30.2
Median 33.5 33.9 34.7
2012 2013 2014
Company 25.2 24.3 26.8
Average 23.9 24.4 24.1
Median 28.9 28.6 27.2
Total Expenditure (%)
2012 2013 2014
60
70
80
90
Average Company Median
2012 2013 2014
10
11
12
13
14
15
Average Company Median
Sundry Creditors (%)
2012 2013 2014
Company 58.9 59.2 58.7
Average 78.8 78.6 78.3
Median 83.6 85.8 82.4
2012 2013 2014
Company 14.7 15.0 14.0
Average 11.5 11.5 11.9
Median 12.0 11.2 11.0
Sundry Debtors (%)
2012 2013 2014
11
12
13
14
15
16
17
Average Company Median
2012 2013 2014
Company 14.8 15.3 16.1
Average 11.8 12.0 12.4
Median 16.5 15.0 15.7
Benchmarking Against Companies in Same Sub-industry in Same City
Total Companies : 65
Industry : Automotive
SubIndustry : Auto Ancillary
State : Tamil Nadu
City : Chennai
Severely  under-performing  in  operating  profit  in
Chennai.  Peer  Growth  Benchmarking  will  help  the
company  to  compare  its  business  processes
and performance  metrics to  industry’s  best  or best
practices from  other  companies.  We  have  collected
and compared the company’s financials with a sample
data of 65 companies and the results are as below:
Company Name : Sample Company
Performance Benchmarking
Performance Benchmarking @All Rights Reserved CapAnalec Services Pvt. Ltd. 15
Annexure
This page is intentionally left blank
Company Name : Sample Company
Performance Benchmarking
Performance Benchmarking @All Rights Reserved CapAnalec Services Pvt. Ltd. 16
CapAnalec is B2B and B2C financial technology services provider in risk analytics & advisory on SAAS
based cloud platform to Banks, Corporate & Investment Bank (CIB). Founded by the team of experienced
investment bankers  with pedigree of IIM, NIT & BITS Pilani, with an cumulative experience of over 80
years of working in the field of Investment Banking & Corporate Bank. Our team brings in vast experience
of  buy  side  &  sells  side  corporate  &  Investment  banking  transactions  which  has  been  built-in  in  our
technology  risk  analytic  platform.  Our  platform  (ORAC)  offers  a  seamlessly  experience  built  with
specialized knowledge skill set tool kit, simplicity and transparency. CapAnalec has been assisted by a
technology  fund  (RGSTF)  for  its  SME  Online  Risk  Assessment  Platform  initiative,  in  promoting  &
strengthening entrepreneurial eco system. It has been supported by the Centre of Innovation-VNIT Nagpur
(CIVN), being advised by Indian Institute of Management, Ahmadabad (IIMA).
Corporate and Sales Office
Nagpur
BU2, CIVN, 3rd Floor, Library Building,  
VNIT Campus, South Ambazari Road,  
Nagpur - 440010  
Ph: (0712) 2801861
Mumbai
605/A, Mahavir Varsha, Plot 8/9/10, Sector
6, Ghansoli, Navi Mumbai-400701 Ph:
(022) 65739325/ 65724920
Email And Website
Email team@capanalec.com, 
ceo@capanalec.com
www.capanalec.comWebsite
Financial Statement Submission or any queries - Email: team@capanalec.com
Fintech Solutions for Corporate & Investment Banking (CIB)
We offer financial services on ORAC a SAAS based Cloud platform as follows : CapAnalec Financial Services and
Operational Risk Analytics enables business-user driven reporting through true enterprise-wide operational risk analysis with
a comprehensive and readily deployable suite of pre-built analytics, allowing institutions to capitalize on their present
investments. Through better, in-depth analysis of loss, risk and control data, see areas of weakness and scope for
improvement in the firm.
Corporate Banking (CB) Solutions
Cloud Deal Sourcing Platform•
Predictive Credit Risk Rating Score Modeling•
Industry Benchmarking & Peer Group Benchmarking•
Portfolio Benchmarking•
Post disbursement dynamic Credit Risk Evaluation and Monitoring Solutions•
Corporate Investment Banking (CIB) Solution
Reschedulement, Restructuring and Turnaround Risk Analytics•
Stressed Asset Dynamic Credit Risk Evaluation and Monitoring•
Business Valuation for Business Sale, promoter exit, Private equity investors, turnaround investors (ARC), IPO Pricing
etc.
•
Risk Analytics Consulting & Advisory Services for SME/ Corporate
Our advisory capabilities are comprehensive in scope and provide management teams with the guidance and a complete
suite of services necessary to achieve a successful turnaround, whether it is through an in-court or out-of-court process. In
addition, should the need arise, our Advisory practice integrates seamlessly with our interim management practice
professionals.
Liquidity Management1.
Operational Improvement2.
Turnaround Restructuring3.
Fund Raising –Capital Solutions4.
Credit Risk and Investment Risk Mitigation5.
Startup Venture Risk Mitigation6.
New Project Finance Risk Mitigation7.
Performance Benchmarking Analysis8.
Vendor Default Risk Analysis9.
Business Valuation Analysis10.
Company Name : Sample Company
Performance Benchmarking
Performance Benchmarking @All Rights Reserved CapAnalec Services Pvt. Ltd.

More Related Content

What's hot

Succession Planning and Competency Modeling
Succession Planning and Competency ModelingSuccession Planning and Competency Modeling
Succession Planning and Competency ModelingWorking Resources
 
TVS Case Study
TVS Case StudyTVS Case Study
TVS Case Studyjyoraji
 
Hr project recruitment %26 selection
Hr project recruitment %26 selectionHr project recruitment %26 selection
Hr project recruitment %26 selectionAmAndeep SinGh BeDi
 
HR / Talent Analytics
HR / Talent AnalyticsHR / Talent Analytics
HR / Talent AnalyticsAkshay Raje
 
Hr audit
Hr auditHr audit
Hr auditSampath
 
Competency Mapping
Competency MappingCompetency Mapping
Competency Mappingudayb14
 
Mahindra & Mahindra HRM PPT
Mahindra & Mahindra HRM PPTMahindra & Mahindra HRM PPT
Mahindra & Mahindra HRM PPTAjit Gupta
 
How Balance Scorecard Helps in HR Planning
How Balance Scorecard Helps in HR PlanningHow Balance Scorecard Helps in HR Planning
How Balance Scorecard Helps in HR PlanningSaifur Rahman Samrat
 
training and development at infosys
training and development at infosystraining and development at infosys
training and development at infosysSwati Luthra
 
Analysis of Tata Steel Group
Analysis of Tata Steel GroupAnalysis of Tata Steel Group
Analysis of Tata Steel GroupAaditya Nagpal
 
The impact of employee engagement on organization
The impact of employee engagement on organizationThe impact of employee engagement on organization
The impact of employee engagement on organizationVIT-MMS
 
Exxon Mobil Presentation
Exxon Mobil PresentationExxon Mobil Presentation
Exxon Mobil PresentationJamin Echols
 
Case domestic airlines in india leveraging price ppt
Case domestic airlines in india leveraging price pptCase domestic airlines in india leveraging price ppt
Case domestic airlines in india leveraging price pptPooja Sakhla
 

What's hot (20)

Succession Planning and Competency Modeling
Succession Planning and Competency ModelingSuccession Planning and Competency Modeling
Succession Planning and Competency Modeling
 
TVS Case Study
TVS Case StudyTVS Case Study
TVS Case Study
 
Hr project recruitment %26 selection
Hr project recruitment %26 selectionHr project recruitment %26 selection
Hr project recruitment %26 selection
 
HR / Talent Analytics
HR / Talent AnalyticsHR / Talent Analytics
HR / Talent Analytics
 
Southwest airline the best hr case study
Southwest airline  the best hr case studySouthwest airline  the best hr case study
Southwest airline the best hr case study
 
Hr audit
Hr auditHr audit
Hr audit
 
Competency Mapping
Competency MappingCompetency Mapping
Competency Mapping
 
Mahindra & Mahindra HRM PPT
Mahindra & Mahindra HRM PPTMahindra & Mahindra HRM PPT
Mahindra & Mahindra HRM PPT
 
How Balance Scorecard Helps in HR Planning
How Balance Scorecard Helps in HR PlanningHow Balance Scorecard Helps in HR Planning
How Balance Scorecard Helps in HR Planning
 
Competency workshop
Competency workshopCompetency workshop
Competency workshop
 
training and development at infosys
training and development at infosystraining and development at infosys
training and development at infosys
 
Hr analytics
Hr analyticsHr analytics
Hr analytics
 
PMS OF INFOSYS
PMS OF INFOSYSPMS OF INFOSYS
PMS OF INFOSYS
 
IBM: The Value of Training
IBM: The Value of TrainingIBM: The Value of Training
IBM: The Value of Training
 
Employee Engagement Proposal
Employee Engagement ProposalEmployee Engagement Proposal
Employee Engagement Proposal
 
Analysis of Tata Steel Group
Analysis of Tata Steel GroupAnalysis of Tata Steel Group
Analysis of Tata Steel Group
 
The impact of employee engagement on organization
The impact of employee engagement on organizationThe impact of employee engagement on organization
The impact of employee engagement on organization
 
Exxon Mobil Presentation
Exxon Mobil PresentationExxon Mobil Presentation
Exxon Mobil Presentation
 
Kpi workshop
Kpi workshopKpi workshop
Kpi workshop
 
Case domestic airlines in india leveraging price ppt
Case domestic airlines in india leveraging price pptCase domestic airlines in india leveraging price ppt
Case domestic airlines in india leveraging price ppt
 

Viewers also liked

Investment Risk Grading Report
Investment  Risk Grading ReportInvestment  Risk Grading Report
Investment Risk Grading ReportCapAnalec
 
Credit rating advisory
Credit rating advisoryCredit rating advisory
Credit rating advisoryCapAnalec
 
Credit Risk Grading report
Credit Risk Grading reportCredit Risk Grading report
Credit Risk Grading reportCapAnalec
 
Sme loan syndication platform
Sme loan syndication platformSme loan syndication platform
Sme loan syndication platformCapAnalec
 
SGS NGO Benchmark Audit
SGS NGO Benchmark AuditSGS NGO Benchmark Audit
SGS NGO Benchmark AuditRaj RANA
 
Expert Judgement Credit Rating for SME & Commercial Customers
Expert Judgement Credit Rating for SME & Commercial CustomersExpert Judgement Credit Rating for SME & Commercial Customers
Expert Judgement Credit Rating for SME & Commercial CustomersMike Coates
 

Viewers also liked (7)

Investment Risk Grading Report
Investment  Risk Grading ReportInvestment  Risk Grading Report
Investment Risk Grading Report
 
Credit rating advisory
Credit rating advisoryCredit rating advisory
Credit rating advisory
 
Credit Risk Grading report
Credit Risk Grading reportCredit Risk Grading report
Credit Risk Grading report
 
Pce
PcePce
Pce
 
Sme loan syndication platform
Sme loan syndication platformSme loan syndication platform
Sme loan syndication platform
 
SGS NGO Benchmark Audit
SGS NGO Benchmark AuditSGS NGO Benchmark Audit
SGS NGO Benchmark Audit
 
Expert Judgement Credit Rating for SME & Commercial Customers
Expert Judgement Credit Rating for SME & Commercial CustomersExpert Judgement Credit Rating for SME & Commercial Customers
Expert Judgement Credit Rating for SME & Commercial Customers
 

Similar to Performance Benchmarking Report

Benchmarking for Natural Gas LDCs
Benchmarking for Natural Gas LDCsBenchmarking for Natural Gas LDCs
Benchmarking for Natural Gas LDCsScottMadden, Inc.
 
Hcm benchmark report_september_2018
Hcm benchmark report_september_2018Hcm benchmark report_september_2018
Hcm benchmark report_september_2018Trevor Hewitt
 
Maruti Suzuki Alto-k10 HRM
Maruti Suzuki Alto-k10 HRMMaruti Suzuki Alto-k10 HRM
Maruti Suzuki Alto-k10 HRMArup Bar
 
STUDY OF MONTHLY SUPPLIER EVALUATION SCORECARD PARAMETERS OF INDIAN CAR MANUF...
STUDY OF MONTHLY SUPPLIER EVALUATION SCORECARD PARAMETERS OF INDIAN CAR MANUF...STUDY OF MONTHLY SUPPLIER EVALUATION SCORECARD PARAMETERS OF INDIAN CAR MANUF...
STUDY OF MONTHLY SUPPLIER EVALUATION SCORECARD PARAMETERS OF INDIAN CAR MANUF...IAEME Publication
 
Uhy Profit Core Spf
Uhy Profit Core   SpfUhy Profit Core   Spf
Uhy Profit Core Spfalanlund
 
The Five Most Important KPIs for Services Companies
The Five Most Important KPIs for Services CompaniesThe Five Most Important KPIs for Services Companies
The Five Most Important KPIs for Services CompaniesJeanne Urich
 
BENCHMARKING: How Do You Stack Up Against Your Competition
BENCHMARKING: How Do You Stack Up Against Your CompetitionBENCHMARKING: How Do You Stack Up Against Your Competition
BENCHMARKING: How Do You Stack Up Against Your CompetitionCBIZ, Inc.
 
benchmarking-12517018313111-phpapp01.pdf
benchmarking-12517018313111-phpapp01.pdfbenchmarking-12517018313111-phpapp01.pdf
benchmarking-12517018313111-phpapp01.pdfbehaylu3
 
benchmarking-12517018313111-phpapp01.pdf
benchmarking-12517018313111-phpapp01.pdfbenchmarking-12517018313111-phpapp01.pdf
benchmarking-12517018313111-phpapp01.pdfbehaylu3
 
DevOps in the Enterprise
DevOps in the EnterpriseDevOps in the Enterprise
DevOps in the EnterpriseNauman Noor
 
RPA Portfolio Assessment
RPA Portfolio Assessment RPA Portfolio Assessment
RPA Portfolio Assessment Eric Rodman
 
Cloudway sipm capabilities
Cloudway sipm capabilitiesCloudway sipm capabilities
Cloudway sipm capabilitiesSaumya S
 

Similar to Performance Benchmarking Report (20)

Benchmarking for Natural Gas LDCs
Benchmarking for Natural Gas LDCsBenchmarking for Natural Gas LDCs
Benchmarking for Natural Gas LDCs
 
Syed Haider Rizvi - Resume
Syed Haider Rizvi - ResumeSyed Haider Rizvi - Resume
Syed Haider Rizvi - Resume
 
Hcm benchmark report_september_2018
Hcm benchmark report_september_2018Hcm benchmark report_september_2018
Hcm benchmark report_september_2018
 
Maruti Suzuki Alto-k10 HRM
Maruti Suzuki Alto-k10 HRMMaruti Suzuki Alto-k10 HRM
Maruti Suzuki Alto-k10 HRM
 
STUDY OF MONTHLY SUPPLIER EVALUATION SCORECARD PARAMETERS OF INDIAN CAR MANUF...
STUDY OF MONTHLY SUPPLIER EVALUATION SCORECARD PARAMETERS OF INDIAN CAR MANUF...STUDY OF MONTHLY SUPPLIER EVALUATION SCORECARD PARAMETERS OF INDIAN CAR MANUF...
STUDY OF MONTHLY SUPPLIER EVALUATION SCORECARD PARAMETERS OF INDIAN CAR MANUF...
 
Resume
ResumeResume
Resume
 
Pinnacle Sourcing-Corporate Profile
Pinnacle Sourcing-Corporate ProfilePinnacle Sourcing-Corporate Profile
Pinnacle Sourcing-Corporate Profile
 
Kamal Seminar 3 (2).pptx
Kamal Seminar 3 (2).pptxKamal Seminar 3 (2).pptx
Kamal Seminar 3 (2).pptx
 
Natural Gas Benchmarking
Natural Gas BenchmarkingNatural Gas Benchmarking
Natural Gas Benchmarking
 
Uhy Profit Core Spf
Uhy Profit Core   SpfUhy Profit Core   Spf
Uhy Profit Core Spf
 
The Five Most Important KPIs for Services Companies
The Five Most Important KPIs for Services CompaniesThe Five Most Important KPIs for Services Companies
The Five Most Important KPIs for Services Companies
 
Brief on Balanced Scorecard Concept
Brief on Balanced Scorecard ConceptBrief on Balanced Scorecard Concept
Brief on Balanced Scorecard Concept
 
BENCHMARKING: How Do You Stack Up Against Your Competition
BENCHMARKING: How Do You Stack Up Against Your CompetitionBENCHMARKING: How Do You Stack Up Against Your Competition
BENCHMARKING: How Do You Stack Up Against Your Competition
 
benchmarking-12517018313111-phpapp01.pdf
benchmarking-12517018313111-phpapp01.pdfbenchmarking-12517018313111-phpapp01.pdf
benchmarking-12517018313111-phpapp01.pdf
 
benchmarking-12517018313111-phpapp01.pdf
benchmarking-12517018313111-phpapp01.pdfbenchmarking-12517018313111-phpapp01.pdf
benchmarking-12517018313111-phpapp01.pdf
 
Competing Value Framework
Competing Value FrameworkCompeting Value Framework
Competing Value Framework
 
DevOps in the Enterprise
DevOps in the EnterpriseDevOps in the Enterprise
DevOps in the Enterprise
 
RPA Portfolio Assessment
RPA Portfolio Assessment RPA Portfolio Assessment
RPA Portfolio Assessment
 
Cloudway sipm capabilities
Cloudway sipm capabilitiesCloudway sipm capabilities
Cloudway sipm capabilities
 
CV_Lavanya_Rajamani_BA
CV_Lavanya_Rajamani_BACV_Lavanya_Rajamani_BA
CV_Lavanya_Rajamani_BA
 

More from CapAnalec

Capanalec profile June-2019
Capanalec profile June-2019Capanalec profile June-2019
Capanalec profile June-2019CapAnalec
 
The Space Journey
The Space JourneyThe Space Journey
The Space JourneyCapAnalec
 
About CapAnalec
About CapAnalecAbout CapAnalec
About CapAnalecCapAnalec
 
Loan origination platform
Loan origination platformLoan origination platform
Loan origination platformCapAnalec
 
Startup Financial Viability Trial Assessment Report
Startup Financial Viability Trial Assessment ReportStartup Financial Viability Trial Assessment Report
Startup Financial Viability Trial Assessment ReportCapAnalec
 
Bank Finance Eligibility Assessment Report
Bank Finance Eligibility Assessment ReportBank Finance Eligibility Assessment Report
Bank Finance Eligibility Assessment ReportCapAnalec
 
ORAC SRM offerings
ORAC SRM offeringsORAC SRM offerings
ORAC SRM offeringsCapAnalec
 
Financial Risk Grading Report
Financial Risk Grading ReportFinancial Risk Grading Report
Financial Risk Grading ReportCapAnalec
 
Workshop for Investment Banking & Merchant Banking
Workshop for Investment Banking & Merchant BankingWorkshop for Investment Banking & Merchant Banking
Workshop for Investment Banking & Merchant BankingCapAnalec
 

More from CapAnalec (9)

Capanalec profile June-2019
Capanalec profile June-2019Capanalec profile June-2019
Capanalec profile June-2019
 
The Space Journey
The Space JourneyThe Space Journey
The Space Journey
 
About CapAnalec
About CapAnalecAbout CapAnalec
About CapAnalec
 
Loan origination platform
Loan origination platformLoan origination platform
Loan origination platform
 
Startup Financial Viability Trial Assessment Report
Startup Financial Viability Trial Assessment ReportStartup Financial Viability Trial Assessment Report
Startup Financial Viability Trial Assessment Report
 
Bank Finance Eligibility Assessment Report
Bank Finance Eligibility Assessment ReportBank Finance Eligibility Assessment Report
Bank Finance Eligibility Assessment Report
 
ORAC SRM offerings
ORAC SRM offeringsORAC SRM offerings
ORAC SRM offerings
 
Financial Risk Grading Report
Financial Risk Grading ReportFinancial Risk Grading Report
Financial Risk Grading Report
 
Workshop for Investment Banking & Merchant Banking
Workshop for Investment Banking & Merchant BankingWorkshop for Investment Banking & Merchant Banking
Workshop for Investment Banking & Merchant Banking
 

Recently uploaded

Call Girls In Connaught Place Delhi ❤️88604**77959_Russian 100% Genuine Escor...
Call Girls In Connaught Place Delhi ❤️88604**77959_Russian 100% Genuine Escor...Call Girls In Connaught Place Delhi ❤️88604**77959_Russian 100% Genuine Escor...
Call Girls In Connaught Place Delhi ❤️88604**77959_Russian 100% Genuine Escor...lizamodels9
 
Regression analysis: Simple Linear Regression Multiple Linear Regression
Regression analysis:  Simple Linear Regression Multiple Linear RegressionRegression analysis:  Simple Linear Regression Multiple Linear Regression
Regression analysis: Simple Linear Regression Multiple Linear RegressionRavindra Nath Shukla
 
/:Call Girls In Indirapuram Ghaziabad ➥9990211544 Independent Best Escorts In...
/:Call Girls In Indirapuram Ghaziabad ➥9990211544 Independent Best Escorts In.../:Call Girls In Indirapuram Ghaziabad ➥9990211544 Independent Best Escorts In...
/:Call Girls In Indirapuram Ghaziabad ➥9990211544 Independent Best Escorts In...lizamodels9
 
VIP Call Girl Jamshedpur Aashi 8250192130 Independent Escort Service Jamshedpur
VIP Call Girl Jamshedpur Aashi 8250192130 Independent Escort Service JamshedpurVIP Call Girl Jamshedpur Aashi 8250192130 Independent Escort Service Jamshedpur
VIP Call Girl Jamshedpur Aashi 8250192130 Independent Escort Service JamshedpurSuhani Kapoor
 
BEST Call Girls In Old Faridabad ✨ 9773824855 ✨ Escorts Service In Delhi Ncr,
BEST Call Girls In Old Faridabad ✨ 9773824855 ✨ Escorts Service In Delhi Ncr,BEST Call Girls In Old Faridabad ✨ 9773824855 ✨ Escorts Service In Delhi Ncr,
BEST Call Girls In Old Faridabad ✨ 9773824855 ✨ Escorts Service In Delhi Ncr,noida100girls
 
Eni 2024 1Q Results - 24.04.24 business.
Eni 2024 1Q Results - 24.04.24 business.Eni 2024 1Q Results - 24.04.24 business.
Eni 2024 1Q Results - 24.04.24 business.Eni
 
Call Girls Navi Mumbai Just Call 9907093804 Top Class Call Girl Service Avail...
Call Girls Navi Mumbai Just Call 9907093804 Top Class Call Girl Service Avail...Call Girls Navi Mumbai Just Call 9907093804 Top Class Call Girl Service Avail...
Call Girls Navi Mumbai Just Call 9907093804 Top Class Call Girl Service Avail...Dipal Arora
 
7.pdf This presentation captures many uses and the significance of the number...
7.pdf This presentation captures many uses and the significance of the number...7.pdf This presentation captures many uses and the significance of the number...
7.pdf This presentation captures many uses and the significance of the number...Paul Menig
 
Banana Powder Manufacturing Plant Project Report 2024 Edition.pptx
Banana Powder Manufacturing Plant Project Report 2024 Edition.pptxBanana Powder Manufacturing Plant Project Report 2024 Edition.pptx
Banana Powder Manufacturing Plant Project Report 2024 Edition.pptxgeorgebrinton95
 
The CMO Survey - Highlights and Insights Report - Spring 2024
The CMO Survey - Highlights and Insights Report - Spring 2024The CMO Survey - Highlights and Insights Report - Spring 2024
The CMO Survey - Highlights and Insights Report - Spring 2024christinemoorman
 
BEST Call Girls In Greater Noida ✨ 9773824855 ✨ Escorts Service In Delhi Ncr,
BEST Call Girls In Greater Noida ✨ 9773824855 ✨ Escorts Service In Delhi Ncr,BEST Call Girls In Greater Noida ✨ 9773824855 ✨ Escorts Service In Delhi Ncr,
BEST Call Girls In Greater Noida ✨ 9773824855 ✨ Escorts Service In Delhi Ncr,noida100girls
 
Call Girls Miyapur 7001305949 all area service COD available Any Time
Call Girls Miyapur 7001305949 all area service COD available Any TimeCall Girls Miyapur 7001305949 all area service COD available Any Time
Call Girls Miyapur 7001305949 all area service COD available Any Timedelhimodelshub1
 
Call Girls in Gomti Nagar - 7388211116 - With room Service
Call Girls in Gomti Nagar - 7388211116  - With room ServiceCall Girls in Gomti Nagar - 7388211116  - With room Service
Call Girls in Gomti Nagar - 7388211116 - With room Servicediscovermytutordmt
 
Marketing Management Business Plan_My Sweet Creations
Marketing Management Business Plan_My Sweet CreationsMarketing Management Business Plan_My Sweet Creations
Marketing Management Business Plan_My Sweet Creationsnakalysalcedo61
 
Call Girls In Sikandarpur Gurgaon ❤️8860477959_Russian 100% Genuine Escorts I...
Call Girls In Sikandarpur Gurgaon ❤️8860477959_Russian 100% Genuine Escorts I...Call Girls In Sikandarpur Gurgaon ❤️8860477959_Russian 100% Genuine Escorts I...
Call Girls In Sikandarpur Gurgaon ❤️8860477959_Russian 100% Genuine Escorts I...lizamodels9
 
VIP Call Girls Pune Kirti 8617697112 Independent Escort Service Pune
VIP Call Girls Pune Kirti 8617697112 Independent Escort Service PuneVIP Call Girls Pune Kirti 8617697112 Independent Escort Service Pune
VIP Call Girls Pune Kirti 8617697112 Independent Escort Service PuneCall girls in Ahmedabad High profile
 
rishikeshgirls.in- Rishikesh call girl.pdf
rishikeshgirls.in- Rishikesh call girl.pdfrishikeshgirls.in- Rishikesh call girl.pdf
rishikeshgirls.in- Rishikesh call girl.pdfmuskan1121w
 
FULL ENJOY - 9953040155 Call Girls in Chhatarpur | Delhi
FULL ENJOY - 9953040155 Call Girls in Chhatarpur | DelhiFULL ENJOY - 9953040155 Call Girls in Chhatarpur | Delhi
FULL ENJOY - 9953040155 Call Girls in Chhatarpur | DelhiMalviyaNagarCallGirl
 
Lucknow 💋 Escorts in Lucknow - 450+ Call Girl Cash Payment 8923113531 Neha Th...
Lucknow 💋 Escorts in Lucknow - 450+ Call Girl Cash Payment 8923113531 Neha Th...Lucknow 💋 Escorts in Lucknow - 450+ Call Girl Cash Payment 8923113531 Neha Th...
Lucknow 💋 Escorts in Lucknow - 450+ Call Girl Cash Payment 8923113531 Neha Th...anilsa9823
 

Recently uploaded (20)

Call Girls In Connaught Place Delhi ❤️88604**77959_Russian 100% Genuine Escor...
Call Girls In Connaught Place Delhi ❤️88604**77959_Russian 100% Genuine Escor...Call Girls In Connaught Place Delhi ❤️88604**77959_Russian 100% Genuine Escor...
Call Girls In Connaught Place Delhi ❤️88604**77959_Russian 100% Genuine Escor...
 
Regression analysis: Simple Linear Regression Multiple Linear Regression
Regression analysis:  Simple Linear Regression Multiple Linear RegressionRegression analysis:  Simple Linear Regression Multiple Linear Regression
Regression analysis: Simple Linear Regression Multiple Linear Regression
 
/:Call Girls In Indirapuram Ghaziabad ➥9990211544 Independent Best Escorts In...
/:Call Girls In Indirapuram Ghaziabad ➥9990211544 Independent Best Escorts In.../:Call Girls In Indirapuram Ghaziabad ➥9990211544 Independent Best Escorts In...
/:Call Girls In Indirapuram Ghaziabad ➥9990211544 Independent Best Escorts In...
 
VIP Call Girl Jamshedpur Aashi 8250192130 Independent Escort Service Jamshedpur
VIP Call Girl Jamshedpur Aashi 8250192130 Independent Escort Service JamshedpurVIP Call Girl Jamshedpur Aashi 8250192130 Independent Escort Service Jamshedpur
VIP Call Girl Jamshedpur Aashi 8250192130 Independent Escort Service Jamshedpur
 
BEST Call Girls In Old Faridabad ✨ 9773824855 ✨ Escorts Service In Delhi Ncr,
BEST Call Girls In Old Faridabad ✨ 9773824855 ✨ Escorts Service In Delhi Ncr,BEST Call Girls In Old Faridabad ✨ 9773824855 ✨ Escorts Service In Delhi Ncr,
BEST Call Girls In Old Faridabad ✨ 9773824855 ✨ Escorts Service In Delhi Ncr,
 
Eni 2024 1Q Results - 24.04.24 business.
Eni 2024 1Q Results - 24.04.24 business.Eni 2024 1Q Results - 24.04.24 business.
Eni 2024 1Q Results - 24.04.24 business.
 
Call Girls Navi Mumbai Just Call 9907093804 Top Class Call Girl Service Avail...
Call Girls Navi Mumbai Just Call 9907093804 Top Class Call Girl Service Avail...Call Girls Navi Mumbai Just Call 9907093804 Top Class Call Girl Service Avail...
Call Girls Navi Mumbai Just Call 9907093804 Top Class Call Girl Service Avail...
 
KestrelPro Flyer Japan IT Week 2024 (English)
KestrelPro Flyer Japan IT Week 2024 (English)KestrelPro Flyer Japan IT Week 2024 (English)
KestrelPro Flyer Japan IT Week 2024 (English)
 
7.pdf This presentation captures many uses and the significance of the number...
7.pdf This presentation captures many uses and the significance of the number...7.pdf This presentation captures many uses and the significance of the number...
7.pdf This presentation captures many uses and the significance of the number...
 
Banana Powder Manufacturing Plant Project Report 2024 Edition.pptx
Banana Powder Manufacturing Plant Project Report 2024 Edition.pptxBanana Powder Manufacturing Plant Project Report 2024 Edition.pptx
Banana Powder Manufacturing Plant Project Report 2024 Edition.pptx
 
The CMO Survey - Highlights and Insights Report - Spring 2024
The CMO Survey - Highlights and Insights Report - Spring 2024The CMO Survey - Highlights and Insights Report - Spring 2024
The CMO Survey - Highlights and Insights Report - Spring 2024
 
BEST Call Girls In Greater Noida ✨ 9773824855 ✨ Escorts Service In Delhi Ncr,
BEST Call Girls In Greater Noida ✨ 9773824855 ✨ Escorts Service In Delhi Ncr,BEST Call Girls In Greater Noida ✨ 9773824855 ✨ Escorts Service In Delhi Ncr,
BEST Call Girls In Greater Noida ✨ 9773824855 ✨ Escorts Service In Delhi Ncr,
 
Call Girls Miyapur 7001305949 all area service COD available Any Time
Call Girls Miyapur 7001305949 all area service COD available Any TimeCall Girls Miyapur 7001305949 all area service COD available Any Time
Call Girls Miyapur 7001305949 all area service COD available Any Time
 
Call Girls in Gomti Nagar - 7388211116 - With room Service
Call Girls in Gomti Nagar - 7388211116  - With room ServiceCall Girls in Gomti Nagar - 7388211116  - With room Service
Call Girls in Gomti Nagar - 7388211116 - With room Service
 
Marketing Management Business Plan_My Sweet Creations
Marketing Management Business Plan_My Sweet CreationsMarketing Management Business Plan_My Sweet Creations
Marketing Management Business Plan_My Sweet Creations
 
Call Girls In Sikandarpur Gurgaon ❤️8860477959_Russian 100% Genuine Escorts I...
Call Girls In Sikandarpur Gurgaon ❤️8860477959_Russian 100% Genuine Escorts I...Call Girls In Sikandarpur Gurgaon ❤️8860477959_Russian 100% Genuine Escorts I...
Call Girls In Sikandarpur Gurgaon ❤️8860477959_Russian 100% Genuine Escorts I...
 
VIP Call Girls Pune Kirti 8617697112 Independent Escort Service Pune
VIP Call Girls Pune Kirti 8617697112 Independent Escort Service PuneVIP Call Girls Pune Kirti 8617697112 Independent Escort Service Pune
VIP Call Girls Pune Kirti 8617697112 Independent Escort Service Pune
 
rishikeshgirls.in- Rishikesh call girl.pdf
rishikeshgirls.in- Rishikesh call girl.pdfrishikeshgirls.in- Rishikesh call girl.pdf
rishikeshgirls.in- Rishikesh call girl.pdf
 
FULL ENJOY - 9953040155 Call Girls in Chhatarpur | Delhi
FULL ENJOY - 9953040155 Call Girls in Chhatarpur | DelhiFULL ENJOY - 9953040155 Call Girls in Chhatarpur | Delhi
FULL ENJOY - 9953040155 Call Girls in Chhatarpur | Delhi
 
Lucknow 💋 Escorts in Lucknow - 450+ Call Girl Cash Payment 8923113531 Neha Th...
Lucknow 💋 Escorts in Lucknow - 450+ Call Girl Cash Payment 8923113531 Neha Th...Lucknow 💋 Escorts in Lucknow - 450+ Call Girl Cash Payment 8923113531 Neha Th...
Lucknow 💋 Escorts in Lucknow - 450+ Call Girl Cash Payment 8923113531 Neha Th...
 

Performance Benchmarking Report

  • 2. Index 1. Executive Benchmarking Summary Benchmarking Rationale  • Analyst Recommendations  • 3. Composite Trend Benchmarking Profitability Trend• ROI Trend• Capital Efficiency Trend• Solvency Trend• Lending Sufficiency Trend• 4. Financial Data Benchmarking Benchmarking Against Companies in Same Industry in India  • Benchmarking Against Companies in Same Sub-industry in India• Benchmarking Against Companies in Same Sub-industry in Same State• Benchmarking Against Companies in Same Sub-industry in Same City• 5. Annexure 2. Financial Statements Profit and Loss Account• Balance Sheet• Company Name : Sample Company Performance Benchmarking Performance Benchmarking @All Rights Reserved CapAnalec Services Pvt. Ltd. 2
  • 3. CapAnalec Predictive Credit Risk Rating Analytics, Performance Benchmarking Analytics, Business Valuation Analytics, Vendor Default Risk Analytics, VC/PE Investment  Risk  Analytics  solutions  and  advisory  reports  and  any  other  Risk Analytical  reports,  are  not  recommendation  or  opinion  that  is  intended  to substitute  for  a  financial  advisor's  or  investor's  independent  assessment  of whether to buy, sell or hold any financial product or to sanction, renew, disburse or  recall  the  concerned  credit  facility  or  investment  envisaged.  Our  various analytics solutions and advisory statement are only statement of opinion derived objectively  through  our  cloud  based  risk  analytics  software  (ORAC),  various sources of public information and other statutory information sources like ROC. The  research  information  contained  therein  is  an  objective  and  independent reference source, which should be used in conjunction with other information in forming  the  basis  for  an  investment  decision.  CapAnalec  has  based  its  risk assessment on the information obtained from the sources believed by it to be accurate and reliable. CapAnalec does not, however, guarantee the accuracy, adequacy  or  completeness  of  any  information  and  is  not  responsible  for  any errors or omissions or for the results obtained from the use of such information. Although reasonable care has been taken to ensure that the information herein is true, such information is provided ‘as is’ without any warranty of any kind, and CapAnalec and its group companies in particular, makes no representation or warranty, express or implied, as to the accuracy, timeliness or completeness of any such information. All information contained herein must be construed solely as statements of opinion, and CapAnalec and its group companies shall not be liable  for  any  losses  incurred  by  users  from  any  use  of  this  document  or  its contents in any manner. Opinions expressed in this document should only be construed as any indication of credit score for specific purpose on behest of the said  subscriber  alone  for  its  own  consumption.  Finally,  CapAnalec  Services Private Limited and its employees accept no liabilities whatsoever for any direct, indirect or consequential loss of any kind arising from the use of its rating and rating research in way whatsoever, unless CapAnalec services Private Limited is negligent  in  miss  interpreting  or  manipulating  the  data,  in  which  case,  our maximum liability to our clients is the amount of our fee for the report. Capanalec Privacy : CapAnalec respects your privacy. We use your contact information, such as  your name, address, and Email ID, to fulfill your request and service your  account and to provide you with additional information from CapAnalec for your  interest. Analyst Disclosure: Each member of the team involved in the preparation of the  grading report, hereby affirms that there exists no conflict of interest that can  bias the grading recommendation of the company. Analyst Disclosure : Company Name : Sample Company Performance Benchmarking Performance Benchmarking @All Rights Reserved CapAnalec Services Pvt. Ltd. 3
  • 4. Company Profile Overview UCAL  Fuel  System  Limited  offers  comprehensive  Fuel  Management  Systems  for  Automotive  sector.  The company  manufactures  pumps,  emission  control  parts  and  various  components  for  both  ferrous  and  non ferrous  material.  With  its  expertise  in  automotive  components,  UCAL  Group  has  been  providing  customers with end - to - end solution from product designing to analysis, prototyping, testing and validation services. The company has one of the most advanced R & D centers in the industry. Company Full Name UCAL Fuel Systems Ltd Year Of Incorporation 1985 Nature Of Business Manufacturing Incorporation Legal Status Public Ltd Industry Type Automotive Legal History None Registered With ROC Category of Entrepreneur General Listed At BSE,NSE,Any Other Stock Exchange Registered Office UCAL  Fuel  Systems  Limited,,  “Raheja Towers”,,  Delta  Wing  –  Unit  705,,  177 Anna  Salai,,  Chennai,  Chennai,  Tamil Nadu, 600002 Manufacturing Facility Haryana,Tamil Nadu,Puducherry Number Of Employees 500 Certification & Awards 2009  -  National  Energy  Conservation Award  by  The  Bureau  of  Energy efficiency,  New  Delhi,  etc.,  2009  - BOSCH  Supplier  Award  for  maximizing value to the customer, etc. Contact Person Ms.Rekha  Raghunathan(Company Secretary and Compliance Officer) Contact Number +91 44422 08111 Email Id investor@ucalfuel.co.in Website www.ucalfuel.com Board And Management Mr. Jayakar Krishnamurthy Products Services Products And Services 1 Carburettors for two wheelers 2 Gasoline fuel injection system products 3 Engine management systems 4 Products for diesel applications and emission control 5 Pumps to high pressure die casting and precision  manufacturing products Company Name : Sample Company Performance Benchmarking Performance Benchmarking @All Rights Reserved CapAnalec Services Pvt. Ltd. 4
  • 5. Financial Statements Analysis Year 2012 2013 2014 Nature Of Financials Audited Audited Audited Gross Sales 738.1 724.5 709.6 Net Sales 680.3 653.6 643.8 Non Operating Income 6.5 7.3 6.8 Manufacturing Expenses 406.4 403.8 388.9 WIP change in stock 0.6 -1.3 0.1 Depreciation 28.1 26.8 27.5 Cost Of Production 435.1 429.4 416.5 FG change in stock -0.6 -0.7 0.2 Cost Of Sales 434.5 428.7 416.7 Admin. & Selling Expenses 189.4 185.0 192.5 Miscellaneous Expenses 5.1 4.9 4.7 Finance Charges 35.6 37.8 35.6 Non Operating Expenses -5.2 -1.1 -4.2 Profit Before Tax 32.4 10.4 10.0 Tax 8.5 4.4 3.1 Net Profit for the year ( PAT) 23.9 6.0 6.8 Summary of Profit & Loss Statement Summary of Balance Sheet Year 2012 2013 2014 Nature Of Financials Audited Audited Audited Share Capital 22.1 22.1 22.1 Reserves and Surplus 40.0 36.9 33.5 Secured Loans 357.7 349.7 313.3 Preference Shares 0.0 0.0 0.0 Unsecured Loans 56.8 53.8 57.2 Total Debt 357.7 349.7 313.3 Deferred Tax Liability -10.3 -11.2 -13.8 Fixed Assets 332.2 322.3 300.5 Intangibles Assets 1.6 1.9 1.3 Investments 0.0 0.0 0.1 Inventories 75.0 72.6 70.4 Sundry Debtors 110.1 115.5 116.9 Cash and Bank Balances 6.5 6.4 2.9 Loans and Advances 59.0 43.6 43.7 Non Current Assets 11.8 16.2 12.1 Current Liabilities 185.9 175.9 190.0 Total Assets 595.5 573.4 545.1 Total Liabilities 595.5 573.4 545.1 Capital Growth Trend 2012 2013 2014 0 100 200 300 400 500 600 Net Worth Total Assets Total Debt The  company  carrying  very  high  debt over  its  balance  sheet.  Higher  liability has  actually  pushed  the  financial  cost much higher. Profitability Growth Trend The  profit/loss  trend    has  been declining  due  to  higher  external liability. There is major financial decline in  the  year  2012.  However,  in  2013, significant  efforts  have  been  put towards bringing company back to the track. 2012 2013 2014 0 100 200 300 400 500 600 700 PAT Revenue Company Name : Sample Company Performance Benchmarking Performance Benchmarking @All Rights Reserved CapAnalec Services Pvt. Ltd. 5
  • 6. Benchmarking Summary Benchmarking Rationale Analyst Comments Financial Performance Bench-marking of a company is an indicator of comparative strength of financial parameter against an average and median of overall industry or sub-industry. It provides an insights into comparative three years trend and strength of those parameters showing out performance or under performance vis-a-vis industry benchmark. In our first part we compare key ratio parameter of company like profitability, ROI, Capital efficiency, Solvency, Lending sufficiency Trend for previous 3 years with average of industry on pan India basis. Secondly, we compare with all the companies in sub-industry on pan india basis, state level basis and City level basis. Thirdly, bench-marking report not only analyze the trend for previous 3 years but also compare fundamental financial parameters such as Gross sales, Operative profit, EBIDTA, PAT, Total Assets, Total Debt, Current Assets, Current Liability, Sundry Debtors, Sundry Creditors and Total Expenditure trends. Financial bench-marking analysis provides an tremendous insight into how company stands against pan India Industry, sub industry state wise and city wise average and median benchmarks.   For these financial benchmarking evaluation, we have considered 1080 companies available pan India in our database in the Automotive Industry, 699 in Auto-Ancillary sub-industry, 114 in Tamil Nadu and 65 companies in Chennai. Performance Benchmarking   a. Industry Composite Benchmarking : (With All companies pan India) Profitability Trend  : Outperforming   ROI Trend  : Underperforming   Capital efficiency Trend  : Underperforming   Lending Sufficiency Trend  : Underperforming   b. Financial Bench-marking for key financial parameter   Gross Sales  : In Line with pan india average of Industry, Outperforming in Sub industry, Tamilnadu and Chennai companies   Operating Profit  : Outperforming pan India, States and City Level   EBIDTA  : Inline with pan india average, out-performance sub industry, states and city level   Total Assets  : Inline with industry average, out performance with sub-industry, states and city level   Profit after Tax (PAT)  : Under performance on pan India average, Inline with sub industry and states level, and under performing on city level     Total Debt  : The company is hihgly leveraged and saddled with high debts as compared with industry average   On account of current assets(CA), current liability(CL), Total expenditure, Sundry Creditors and Sundry debtors it is almsot inline with pan India averages. However it is under- performing on sub-industry, states and city level   Company Name : Sample Company Performance Benchmarking Performance Benchmarking @All Rights Reserved CapAnalec Services Pvt. Ltd. 6
  • 7. Profitability Trend (%) 2012 2013 2014 -10 -5 0 5 10 15 Company Industry 2012 2013 2014 Company 10.6 8.3 7.9 Industry 4.5 -6.0 0.5 ROI Rating Trend (%) 2012 2013 2014 -10 0 10 20 30 40 50 Company Industry 2012 2013 2014 Company 47.4 36.8 37.6 Industry -2.0 5.4 -1.0 Lending Sufficiency Trend (Time) 2012 2013 2014 0 10 20 30 40 50 60 Company Industry 2012 2013 2014 Company 1.8 1.8 1.8 Industry 30.7 53.0 50.7 Solvency Trend (Time) 2012 2013 2014 0 1 2 3 Company Industry 2012 2013 2014 Company 2.6 2.6 2.6 Industry 2.1 1.2 -0.8 Capital Efficiency Trend (%) 2012 2013 2014 -5 0 5 Company Industry 2012 2013 2014 Company 4.8 4.4 4.7 Industry 1.3 3.3 -6.2 Composite Trend Benchmarking Total Companies : 815 Industry : Automotive SubIndustry : All Subindustries State : All States City : All Cities Company  in overall Outperforming vis-a vis industry in Profitability, ROI, Capital efficiency, and Solvency Trend  during  FY2016.  However  due  to  highly leveraged condition it is under-performing in Lending sufficiency Trend. Company Name : Sample Company Performance Benchmarking Performance Benchmarking @All Rights Reserved CapAnalec Services Pvt. Ltd. 7
  • 8. Benchmarking Against the Companies in same Industry across India Total Companies : 1080 Industry : Automotive SubIndustry : All Subindustries State : All States City : All Cities Company is inline with average industry performance in  Gross  Sales,  EBIDTA,  Total  Asset.  Under- performing  PAT,  Total  Debt.  Company  is  inline  with average  industry  performance  in  Current  Assets  and Current  Liability,  sundry  creditors.  Outperforming  in total  expenditure.    Under  Performing  in  Sundry debtors. Gross Sales (Crores) 2012 2013 2014 0 200 400 600 800 Average Company Median 2012 2013 2014 Company 7.4 7.2 7.1 Average 777.0 793.8 750.3 Median 119.5 108.5 89.9 Operating Profit (%) 2012 2013 2014 2 4 6 8 10 12 14 Average Company Median 2012 2013 2014 Company 12.3 10.2 9.7 Average 7.9 7.4 7.3 Median 5.2 4.8 3.8 Profit After Tax (%) 2012 2013 2014 0 1 2 3 4 5 Average Company Median 2012 2013 2014 10 20 30 40 50 Average Company Median Total Debt (%) 2012 2013 2014 Company 3.2 0.8 1.0 Average 4.1 3.4 3.1 Median 1.5 1.3 0.9 2012 2013 2014 Company 48.5 48.3 44.1 Average 18.6 20.0 21.1 Median 17.8 17.9 18.3 Total Assets (%) 2012 2013 2014 70 75 80 Average Company Median 2012 2013 2014 Company 80.7 79.2 76.8 Average 71.9 74.0 78.7 Median 79.2 82.2 83.1 EBIDTA (%) 2012 2013 2014 6 7 8 9 10 11 12 Average Company Median 2012 2013 2014 Company 11.4 9.2 8.7 Average 9.5 9.2 9.6 Median 6.7 6.2 6.0 Company Name : Sample Company Performance Benchmarking Performance Benchmarking @All Rights Reserved CapAnalec Services Pvt. Ltd. 8
  • 9. Current Assets (%) 2012 2013 2014 30 35 40 45 50 Average Company Median 2012 2013 2014 24 26 28 30 32 34 36 Average Company Median Current Liability (%) 2012 2013 2014 Company 33.9 32.2 32.6 Average 33.1 32.6 33.9 Median 43.8 44.5 45.0 2012 2013 2014 Company 25.2 24.3 26.8 Average 29.0 29.0 30.8 Median 35.2 34.5 34.4 Total Expenditure (%) 2012 2013 2014 50 60 70 80 90 100 Average Company Median 2012 2013 2014 11 12 13 14 15 Average Company Median Sundry Creditors (%) 2012 2013 2014 Company 58.9 59.2 58.7 Average 85.6 85.7 86.4 Median 90.7 90.6 87.5 2012 2013 2014 Company 14.7 15.0 14.0 Average 13.1 12.8 13.8 Median 12.0 11.9 11.7 Sundry Debtors (%) 2012 2013 2014 8 10 12 14 16 18 Average Company Median 2012 2013 2014 Company 14.8 15.3 16.1 Average 8.4 8.6 8.9 Median 13.3 14.3 15.3 Benchmarking Against the Companies in same Industry across India Total Companies : 1080 Industry : Automotive SubIndustry : All Subindustries State : All States City : All Cities Company is inline with average industry performance in  Gross  Sales,  EBIDTA,  Total  Asset.  Under- performing  PAT,  Total  Debt.  Company  is  inline  with average  industry  performance  in  Current  Assets  and Current  Liability,  sundry  creditors.  Outperforming  in total  expenditure.    Under  Performing  in  Sundry debtors. Company Name : Sample Company Performance Benchmarking Performance Benchmarking @All Rights Reserved CapAnalec Services Pvt. Ltd. 9
  • 10. Gross Sales (Crores) 2012 2013 2014 0 100 200 300 400 Average Company Median 2012 2013 2014 Company 7.4 7.2 7.1 Average 355.8 361.7 317.5 Median 117.0 108.5 90.1 Operating Profit (%) 2012 2013 2014 6 8 10 12 Average Company Median 2012 2013 2014 Company 12.3 10.2 9.7 Average 9.5 9.3 9.6 Median 6.3 6.0 5.1 Profit After Tax (%) 2012 2013 2014 0 1 2 3 4 Average Company Median 2012 2013 2014 10 20 30 40 50 Average Company Median Total Debt (%) 2012 2013 2014 Company 3.2 0.8 1.0 Average 3.9 3.5 2.5 Median 2.0 1.6 1.1 2012 2013 2014 Company 48.5 48.3 44.1 Average 25.7 28.4 31.8 Median 18.9 18.0 18.5 Total Assets (%) 2012 2013 2014 76 78 80 82 84 86 Average Company Median 2012 2013 2014 Company 80.7 79.2 76.8 Average 76.5 79.3 83.8 Median 85.0 82.2 81.7 EBIDTA (%) 2012 2013 2014 6 7 8 9 10 11 12 Average Company Median 2012 2013 2014 Company 11.4 9.2 8.7 Average 10.6 10.3 10.7 Median 8.0 7.6 6.7 Benchmarking Against Companies in Same Sub-industry in India Total Companies : 699 Industry : Automotive SubIndustry : Auto Ancillary State : All States City : All Cities Outperforming  in  Gross  Sales,  EBIDTA,  Total  Assets. Inline  Performance  for  PAT  .  Under-performing  in Current  Assets,  Current  Liability,  Total  Expenditure, sundry Creditors, sundry debtors Company Name : Sample Company Performance Benchmarking Performance Benchmarking @All Rights Reserved CapAnalec Services Pvt. Ltd. 10
  • 11. Current Assets (%) 2012 2013 2014 30 35 40 45 50 Average Company Median 2012 2013 2014 24 26 28 30 32 34 36 Average Company Median Current Liability (%) 2012 2013 2014 Company 33.9 32.2 32.6 Average 37.4 37.1 37.8 Median 46.1 44.2 42.6 2012 2013 2014 Company 25.2 24.3 26.8 Average 30.1 30.2 32.8 Median 35.9 33.8 33.2 Total Expenditure (%) 2012 2013 2014 50 60 70 80 90 Average Company Median 2012 2013 2014 12.5 13 13.5 14 14.5 15 Average Company Median Sundry Creditors (%) 2012 2013 2014 Company 58.9 59.2 58.7 Average 83.9 83.6 84.6 Median 89.4 86.8 86.4 2012 2013 2014 Company 14.7 15.0 14.0 Average 12.8 12.6 13.1 Median 14.2 14.3 13.4 Sundry Debtors (%) 2012 2013 2014 13 14 15 16 17 18 Average Company Median 2012 2013 2014 Company 14.8 15.3 16.1 Average 13.1 13.1 14.5 Median 17.1 17.2 17.4 Benchmarking Against Companies in Same Sub-industry in India Total Companies : 699 Industry : Automotive SubIndustry : Auto Ancillary State : All States City : All Cities Outperforming  in  Gross  Sales,  EBIDTA,  Total  Assets. Inline  Performance  for  PAT  .  Under-performing  in Current  Assets,  Current  Liability,  Total  Expenditure, sundry Creditors, sundry debtors Company Name : Sample Company Performance Benchmarking Performance Benchmarking @All Rights Reserved CapAnalec Services Pvt. Ltd. 11
  • 12. Gross Sales (Crores) 2012 2013 2014 0 100 200 300 400 500 600 Average Company Median 2012 2013 2014 Company 7.4 7.2 7.1 Average 552.9 564.3 586.1 Median 188.7 183.4 181.0 Operating Profit (%) 2012 2013 2014 6 7 8 9 10 11 12 13 Average Company Median 2012 2013 2014 Company 12.3 10.2 9.7 Average 7.2 6.5 6.7 Median 7.7 6.4 6.5 Profit After Tax (%) 2012 2013 2014 1 2 3 Average Company Median 2012 2013 2014 10 20 30 40 50 Average Company Median Total Debt (%) 2012 2013 2014 Company 3.2 0.8 1.0 Average 2.8 2.2 2.3 Median 2.8 2.3 2.3 2012 2013 2014 Company 48.5 48.3 44.1 Average 15.4 16.3 15.0 Median 16.3 18.9 15.5 Total Assets (%) 2012 2013 2014 50 60 70 80 90 100 Average Company Median 2012 2013 2014 Company 80.7 79.2 76.8 Average 55.8 57.8 60.5 Median 83.1 91.7 96.9 EBIDTA (%) 2012 2013 2014 6 7 8 9 10 11 12 Average Company Median 2012 2013 2014 Company 11.4 9.2 8.7 Average 7.8 7.0 7.4 Median 7.9 8.2 8.4 Benchmarking Against Companies in Same Sub-industry in Same State Total Companies : 111 Industry : Automotive SubIndustry : Auto Ancillary State : Tamil Nadu City : All Cities Outperforming  in  Gross  Sales,  EBIDTA,  Total  Debt and Total Sales. Under-performing in Sundry Creditors and Sundry Debtors, Current Assets & Current Liability which  are  higher  than  the  industry  averages  and median. Company Name : Sample Company Performance Benchmarking Performance Benchmarking @All Rights Reserved CapAnalec Services Pvt. Ltd. 12
  • 13. Current Assets (%) 2012 2013 2014 25 30 35 40 45 50 Average Company Median 2012 2013 2014 25 30 35 Average Company Median Current Liability (%) 2012 2013 2014 Company 33.9 32.2 32.6 Average 28.8 29.8 30.8 Median 41.9 46.1 47.0 2012 2013 2014 Company 25.2 24.3 26.8 Average 24.5 25.7 25.6 Median 30.3 33.2 36.2 Total Expenditure (%) 2012 2013 2014 50 60 70 80 90 100 Average Company Median 2012 2013 2014 12 13 14 15 Average Company Median Sundry Creditors (%) 2012 2013 2014 Company 58.9 59.2 58.7 Average 83.3 83.1 82.4 Median 98.3 91.1 86.1 2012 2013 2014 Company 14.7 15.0 14.0 Average 12.4 12.9 13.6 Median 12.8 12.9 13.9 Sundry Debtors (%) 2012 2013 2014 10 12 14 16 18 20 Average Company Median 2012 2013 2014 Company 14.8 15.3 16.1 Average 11.6 12.0 12.6 Median 18.4 17.1 19.2 Benchmarking Against Companies in Same Sub-industry in Same State Total Companies : 111 Industry : Automotive SubIndustry : Auto Ancillary State : Tamil Nadu City : All Cities Outperforming  in  Gross  Sales,  EBIDTA,  Total  Debt and Total Sales. Under-performing in Sundry Creditors and Sundry Debtors, Current Assets & Current Liability which  are  higher  than  the  industry  averages  and median. Company Name : Sample Company Performance Benchmarking Performance Benchmarking @All Rights Reserved CapAnalec Services Pvt. Ltd. 13
  • 14. Gross Sales (Crores) 2012 2013 2014 0 100 200 300 400 500 600 700 Average Company Median 2012 2013 2014 Company 7.4 7.2 7.1 Average 582.7 578.3 642.3 Median 266.6 269.0 290.7 Operating Profit (%) 2012 2013 2014 6 8 10 12 Average Company Median 2012 2013 2014 Company 12.3 10.2 9.7 Average 8.3 7.8 7.9 Median 7.9 5.8 7.7 Profit After Tax (%) 2012 2013 2014 1 2 3 4 Average Company Median 2012 2013 2014 10 20 30 40 50 Average Company Median Total Debt (%) 2012 2013 2014 Company 3.2 0.8 1.0 Average 3.5 2.7 2.9 Median 2.6 1.6 2.0 2012 2013 2014 Company 48.5 48.3 44.1 Average 17.5 18.2 15.2 Median 14.9 14.7 13.0 Total Assets (%) 2012 2013 2014 60 70 80 Average Company Median 2012 2013 2014 Company 80.7 79.2 76.8 Average 58.2 60.5 62.1 Median 72.1 66.7 72.7 EBIDTA (%) 2012 2013 2014 5 6 7 8 9 10 11 12 Average Company Median 2012 2013 2014 Company 11.4 9.2 8.7 Average 8.8 8.0 8.4 Median 8.7 5.9 7.7 Benchmarking Against Companies in Same Sub-industry in Same City Total Companies : 65 Industry : Automotive SubIndustry : Auto Ancillary State : Tamil Nadu City : Chennai Severely  under-performing  in  operating  profit  in Chennai.  Peer  Growth  Benchmarking  will  help  the company  to  compare  its  business  processes and performance  metrics to  industry’s  best  or best practices from  other  companies.  We  have  collected and compared the company’s financials with a sample data of 65 companies and the results are as below: Company Name : Sample Company Performance Benchmarking Performance Benchmarking @All Rights Reserved CapAnalec Services Pvt. Ltd. 14
  • 15. Current Assets (%) 2012 2013 2014 28 29 30 31 32 33 34 35 Average Company Median 2012 2013 2014 23 24 25 26 27 28 29 Average Company Median Current Liability (%) 2012 2013 2014 Company 33.9 32.2 32.6 Average 28.8 29.1 30.2 Median 33.5 33.9 34.7 2012 2013 2014 Company 25.2 24.3 26.8 Average 23.9 24.4 24.1 Median 28.9 28.6 27.2 Total Expenditure (%) 2012 2013 2014 60 70 80 90 Average Company Median 2012 2013 2014 10 11 12 13 14 15 Average Company Median Sundry Creditors (%) 2012 2013 2014 Company 58.9 59.2 58.7 Average 78.8 78.6 78.3 Median 83.6 85.8 82.4 2012 2013 2014 Company 14.7 15.0 14.0 Average 11.5 11.5 11.9 Median 12.0 11.2 11.0 Sundry Debtors (%) 2012 2013 2014 11 12 13 14 15 16 17 Average Company Median 2012 2013 2014 Company 14.8 15.3 16.1 Average 11.8 12.0 12.4 Median 16.5 15.0 15.7 Benchmarking Against Companies in Same Sub-industry in Same City Total Companies : 65 Industry : Automotive SubIndustry : Auto Ancillary State : Tamil Nadu City : Chennai Severely  under-performing  in  operating  profit  in Chennai.  Peer  Growth  Benchmarking  will  help  the company  to  compare  its  business  processes and performance  metrics to  industry’s  best  or best practices from  other  companies.  We  have  collected and compared the company’s financials with a sample data of 65 companies and the results are as below: Company Name : Sample Company Performance Benchmarking Performance Benchmarking @All Rights Reserved CapAnalec Services Pvt. Ltd. 15
  • 16. Annexure This page is intentionally left blank Company Name : Sample Company Performance Benchmarking Performance Benchmarking @All Rights Reserved CapAnalec Services Pvt. Ltd. 16
  • 17. CapAnalec is B2B and B2C financial technology services provider in risk analytics & advisory on SAAS based cloud platform to Banks, Corporate & Investment Bank (CIB). Founded by the team of experienced investment bankers  with pedigree of IIM, NIT & BITS Pilani, with an cumulative experience of over 80 years of working in the field of Investment Banking & Corporate Bank. Our team brings in vast experience of  buy  side  &  sells  side  corporate  &  Investment  banking  transactions  which  has  been  built-in  in  our technology  risk  analytic  platform.  Our  platform  (ORAC)  offers  a  seamlessly  experience  built  with specialized knowledge skill set tool kit, simplicity and transparency. CapAnalec has been assisted by a technology  fund  (RGSTF)  for  its  SME  Online  Risk  Assessment  Platform  initiative,  in  promoting  & strengthening entrepreneurial eco system. It has been supported by the Centre of Innovation-VNIT Nagpur (CIVN), being advised by Indian Institute of Management, Ahmadabad (IIMA). Corporate and Sales Office Nagpur BU2, CIVN, 3rd Floor, Library Building,   VNIT Campus, South Ambazari Road,   Nagpur - 440010   Ph: (0712) 2801861 Mumbai 605/A, Mahavir Varsha, Plot 8/9/10, Sector 6, Ghansoli, Navi Mumbai-400701 Ph: (022) 65739325/ 65724920 Email And Website Email team@capanalec.com,  ceo@capanalec.com www.capanalec.comWebsite Financial Statement Submission or any queries - Email: team@capanalec.com Fintech Solutions for Corporate & Investment Banking (CIB) We offer financial services on ORAC a SAAS based Cloud platform as follows : CapAnalec Financial Services and Operational Risk Analytics enables business-user driven reporting through true enterprise-wide operational risk analysis with a comprehensive and readily deployable suite of pre-built analytics, allowing institutions to capitalize on their present investments. Through better, in-depth analysis of loss, risk and control data, see areas of weakness and scope for improvement in the firm. Corporate Banking (CB) Solutions Cloud Deal Sourcing Platform• Predictive Credit Risk Rating Score Modeling• Industry Benchmarking & Peer Group Benchmarking• Portfolio Benchmarking• Post disbursement dynamic Credit Risk Evaluation and Monitoring Solutions• Corporate Investment Banking (CIB) Solution Reschedulement, Restructuring and Turnaround Risk Analytics• Stressed Asset Dynamic Credit Risk Evaluation and Monitoring• Business Valuation for Business Sale, promoter exit, Private equity investors, turnaround investors (ARC), IPO Pricing etc. • Risk Analytics Consulting & Advisory Services for SME/ Corporate Our advisory capabilities are comprehensive in scope and provide management teams with the guidance and a complete suite of services necessary to achieve a successful turnaround, whether it is through an in-court or out-of-court process. In addition, should the need arise, our Advisory practice integrates seamlessly with our interim management practice professionals. Liquidity Management1. Operational Improvement2. Turnaround Restructuring3. Fund Raising –Capital Solutions4. Credit Risk and Investment Risk Mitigation5. Startup Venture Risk Mitigation6. New Project Finance Risk Mitigation7. Performance Benchmarking Analysis8. Vendor Default Risk Analysis9. Business Valuation Analysis10. Company Name : Sample Company Performance Benchmarking Performance Benchmarking @All Rights Reserved CapAnalec Services Pvt. Ltd.