SlideShare a Scribd company logo
1 of 78
Genetic analysis of cavefish reveals molecular convergence
in the evolution of albinism
Meredith E Protas1, Candace Hersey2, Dawn Kochanek3, Yi
Zhou2, Horst Wilkens4, William R Jeffery5,
Leonard I Zon2, Richard Borowsky3 & Clifford J Tabin1
The genetic basis of vertebrate morphological evolution has
traditionally been very difficult to examine in naturally
occurring populations. Here we describe the generation of a
genome-wide linkage map to allow quantitative trait analysis of
evolutionarily derived morphologies in the Mexican cave tetra,
a species that has, in a series of independent caves, repeatedly
evolved specialized characteristics adapted to a unique and
well-studied ecological environment. We focused on the trait
of albinism and discovered that it is linked to Oca2, a known
pigmentation gene, in two cave populations. We found
different deletions in Oca2 in each population and, using
a cell-based assay, showed that both cause loss of function
of the corresponding protein, OCA2. Thus, the two cave
populations evolved albinism independently, through
similar mutational events.
The relatively closed, often nutrient-poor, and lightless
environment
of caves represents a marked change in ecological conditions to
which
several entrapped species have adapted. Obligate cave-dwelling
ani-
mals, called troglobites or troglodytes, are characterized by a
remark-
able convergence of eye and pigment loss across diverse species
such as
spiders, isopods, salamanders and fish1.
There are 86 known troglodytic species of fish2. The best
studied is
the Mexican tetra, identified by some authors as Astyanax
mexicanus
and others as Astyanax fasciatus; the two names should be
considered
synonymous in the present context and the species will be
referred to
herein as Astyanax. This species has 29 cave populations in the
karst
region of the Sierra de El Abra of northeast Mexico and one
additional
population in Guerrero (Fig. 1a)3,4. A surface, or river-
dwelling, sister
population of the cave morph lives in southern Texas and
northeastern
Mexico and can still interbreed with the cave morph.
Phenotypically,
the cave and surface morphs are very different; among other
char-
acteristics, the cave morph has a greater weight per unit length,
less
pigment, regressed eyes, larger nostrils, more maxillary teeth,
more
cranial neuromasts and more taste buds, as well as differences
in
feeding, schooling and aggressive behaviors (Fig. 1b–d)4,5.
Molecular
phylogenetic studies indicate that several cave populations
indepen-
dently evolved these characteristics6–8.
To provide a framework in which to study the genetics of this
species, we made a microsatellite linkage map. We have
isolated and
Rio Sabinas
Rio Frio
Molinoa b
c
d
Pachón
Pachón
Japonés
Ciudad Valles
kilometers
0 5 10 15
Ciudad Mante
N
Surface
Molino
R
io
M
an
te
A
rroy o
L
agarto
S
IE
R
R
A
D
E
E
L
A
B
R
A
S
IE
R
R
A
D
E
C
O
L
M
E
N
A
Rio
V
alle
s
Rio
Ta
m
pa
an
M
EXICO
Figure 1 Phenotype and locations of albino cave populations of
Astyanax
mexicanus. (a) Map of the area in Mexico where the different
cave
populations are found. Dots represent cave populations. Caves
with red dots
are Molino, Pachón and Japonés, all of which contain a majority
of albino
individuals. Inset map at bottom shows the location of the
region within
Mexico. (b) A representative surface fish. (c) A representative
Molino
cavefish. (d) A representative Pachón cavefish.
Received 20 July; accepted 13 October; published online 11
December 2005; doi:10.1038/ng1700
1Department of Genetics, Harvard Medical School, Boston,
Massachusetts 02115, USA. 2Children’s Hospital Stem Cell
Program, Department of Hematology/Oncology,
Howard Hughes Medical Institute, Children’s Hospital Boston,
Boston, Massachusetts 02115, USA. 3Cave Biology Research
Group, Department of Biology, New York
University, 1009 Main, 100 Washington Square East, New
York, New York 10003, USA. 4Zoological Institute and
Zoological Museum, University of Hamburg, Martin-
Luther-King-Platz 3, 20146 Hamburg, Germany. 5Department of
Biology, University of Maryland, College Park, Maryland
20742, USA. Correspondence should be
addressed to C.J.T. ([email protected]).
NATURE GENETICS VOLUME 38 [ NUMBER 1 [ JANUARY
2006 107
L E T T E R S
©
2
0
0
6
N
a
tu
re
P
u
b
lis
h
in
g
G
ro
u
p
h
tt
p
:/
/w
w
w
.n
a
tu
re
.c
o
m
/n
a
tu
re
g
e
n
e
tic
s
designed primers corresponding to over 600 microsatellites.
Using a
backcross from the Molino cave population with 111 progeny,
we
obtained 35 linkage groups composed of 267 markers, out of
300
markers genotyped, with a coverage of 1,916 cM (Fig. 2 and
Supplementary Table 1 online). Astyanax has 25 chromosomes,
sug-
gesting that with the addition of more markers, some of the
linkage
groups would collapse. We are also genotyping a larger F2 cross
from
another cave, Pachón, which should coalesce some of the
linkage
groups and allow for comparisons between the two cave
populations.
We identified a number of statistically significant, quantitative
loci
for different traits present in the cave form, most of which will
be
described elsewhere. Here we focus on one such trait, albinism.
Previous genetic studies have indicated that albinism in the
Pachón
cave is caused by a single recessive mutation9,10. In the Molino
backcross, albinism mapped to a single locus in linkage group
16
with a LOD score of 17.29 at microsatellite marker 218E,
accounting
for 49.4% of the variance in this trait (Fig. 3a). A similar
analysis of
the Pachón F2 cross mapped the locus for albinism to the same
location with a LOD score of 17.98 at marker 218E, accounting
for
42.6% of the variance in this trait (data not shown). This
coincidence
of loci responsible for albinism raises the following three
possibilities:
the two cave populations could have the same mutation in the
same
gene, different mutations in the same gene or mutations in
distinct
but closely linked genes. To address the latter possibility, we
performed
a complementation test between a Molino individual and a
Pachón
individual, which yielded only albino offspring (Fig. 3b). Thus,
albinism in these two cave populations is caused by mutations
in
the same gene.
To identify the gene responsible for albinism in Astyanax, we
genotyped individuals of the Molino backcross for a series of
candi-
date genes, based on known albinism loci in mouse and humans:
tyrosinase (Tyr), tyrosinase-related protein-1 (Tyrp1) and ocular
and
cutaneous albinism-2 (Oca2) (Fig. 2). One of these genes, Oca2,
mapped to the albino locus and increased the LOD score in the
Molino backcross to 68.6 (Fig. 3c), now accounting for 93.1%
of the
variance of this trait, and the LOD score in the Pachón F2 cross
to
60.66, now accounting for 71.6% of the variance of this trait
(data
not shown). Furthermore, there is a perfect association between
the genotype of the Oca2 marker and the phenotype of albinism
in
all successfully genotyped individuals of both the Molino
backcross
(105 individuals) and the Pachón F2 cross (215 individuals).
Although the function of Oca2 is unknown, it is the most
commonly
mutated gene in cases of human albinism11 and is also
responsible for
pigmentation phenotypes in mouse and medaka12,13. To test
whether
Oca2 mutations are responsible for albinism in cavefish, and,
more
importantly, to identify the specific genetic lesions in Oca2
responsible
for albinism, we compared the sequence of the Oca2 cDNA in
surface,
Pachón and Molino individuals (Supplementary Fig. 1 online).
We
found numerous differences in the Oca2 sequences present in
the two
cave populations as compared to their surface counterparts (Fig.
4a
and Supplementary Fig. 1). The Pachón cave population had
three
polymorphisms that could affect Oca2 function: two were amino
acid
changes in conserved residues, and the last was a deletion
extending
from within intron 23 through most of exon 24, such that the
cDNA
includes part of intron 23 fused to the last nine base pairs of
exon 24
and the 3¢ UTR (Fig. 4a and Supplementary Fig. 1). The Molino
cave
population had only one major difference: exon 21 was missing
(Fig. 4a and Supplementary Fig. 1).
The missing exons observed in the Molino and Pachón Oca2
sequence could, in principle, be explained by either alterations
in
splicing or deletions of genomic DNA. Amplifying from
genomic
DNA, we found that in both cases, the observed losses of exonic
sequence in the Molino and Pachón Oca2 cDNAs were
attributable to
genomic deletions (Supplementary Fig. 2 online).
24 206A
209E0
18
6
0
103A
219A
207F
11
6
0
15A
232A
231C
11
0
129B
43A
32 33 34 35
113 33b
95
90
213E
237A
213F82
80
73
66 30C
26A
105B
43C54
50
44
218E
132B
34
205E
210A
9
0
88
81
75 17A
220B
128B
205D61
9C
208E
57
53
44
37
29
221A
142A
28A
236A
7B0
8
0
7
12
113B
217A
23A
28
34
112A
221B
36D46
53
74 210D
132C
88
89
99 202B
224A
224C
123A64
35
32
23
19
16
10
7
0
216D
116C
6C
214E
226E
229D
214C
230A
0
8
10
20
37
59
63
68
73 55b
218A
207C
144A
19B
104C
203E
131A
55a 0 207D
18 227A
222E23
37 208A
3A41
47 109C
119A52
66 113C
139B23
12
10
6
0
207A
228E227D
103C
203A
47 115C
15C35
30
27
19
228D
42A
139A
220E0
42
40
31
21
0 219B
111B
109B
219E
226B
49 105A
223C
229B
21
16
7
0
235D
119B
58 3c
47 3B
127B35
16 8C
133C0
51
43
37 17C
214A
211E
143A0 0
16
24 232C
207E234C
220A
38
30
18
0 230E
5C
132A
237B
0
3
6
10 210B
216E
237F
230C
22
9
0
225A
239e
204D
31302928272625242322212019181716
Oca2
Tyrp1
Tyr
0 237E
0
0
0 0 0
0
0
0 0 0 0 0 0 0 123C
135C
211B
235B
241B
224F
217E
240E
202A
208C
24C
104B
114A
226A
242A
232D
229A
205A
214D
13
15
27
53
59
63
69
71
72
74
81
15
17
19
21
34
47
73
1B
135A
222C
130A
142B
122B
207B
215F
215B
220D
224E
13
15
21
35
38
40
44
54
56
59
67
229C
11B
203D
136A
1
14
22
4
16
31
54
68
74
77
79
83
98
107
118
127
131
137
143
144
146
151
6
204F 111C 118C
222B
114B
211D
127A
106B
239a
102C
206E
44A
41C
1C
215D
224B
241A
239c
227B
129A
19C
16B
211A
236B
214B
11
18
235E
117C
112B
217B
6A2
3
14
19
226F
234A
241D
206D
208D
107C
213A
235A
231A
235F
237C 228C
6
7
9
13
17
20
22
39
41
45
240B
119C
103B
110B
209A
238A
218D
44C
203F
234B
108C
143C
120C
216F
17B
125C
142C
204E
122C
120B
33c
222D 216B
5
16
32
38
39
47
71
76
96
101
103
111
114
119
125
144
154
163
166
168
172
213D 111A
225B
39C
240A
145A
217D
209D
27C
2B
23B
216C
214F
242B 239d9
10
19
32
38
12
15
22
53
68
91
30B
101A
106A
26C
107B
230D
101B
123B
120A
229E
114C
216A
7
16
20
21
23
25
28
29
30
32
35
218B
37C
139C
215C
16A
24B
205F
213B
202D
241C
202E
133B
209B
44B
225C
226D
128A
209C
211C
136B
16C
39a
1
11
28
31
44
47
52
55
56
80
83
96
99
109
125
130
138
142
151
156
171
182
1 2 3 4 5 6 7 8 9 10 11 12 13 14 15
Figure 2 Microsatellite linkage map of Astyanax mexicanus.
The names of the microsatellite markers are to the right of each
linkage group and the positions
of the markers (in cM) are on the left. Markers in three genes
(Oca2, Tyr and Tyrp1) are labeled in red.
108 VOLUME 38 [ NUMBER 1 [ JANUARY 2006 NATURE
GENETICS
L E T T E R S
©
2
0
0
6
N
a
tu
re
P
u
b
lis
h
in
g
G
ro
u
p
h
tt
p
:/
/w
w
w
.n
a
tu
re
.c
o
m
/n
a
tu
re
g
e
n
e
tic
s
To test whether the polymorphisms in the cave populations’
Oca2
sequences cause albinism through loss of function of Oca2, we
used
the melan-p cell line, which is a melanocyte cell line generated
from an
Oca2-deficient mouse14. We made constructs expressing wild-
type
surface-fish Oca2 and surface-fish Oca2 modified with each of
the
cavefish polymorphisms driven by the human ubiquitin
promoter. We
first transfected the surface-fish Oca2 construct to ascertain
whether
wild-type Astyanax Oca2 could complement Oca2 function in
mouse
cells. Indeed, melan-p cells transfected with the surface-fish
Oca2
showed high levels of pigmentation (Fig. 4b–d). We then
transfected
cells with constructs encoding the different amino acid
substitutions
seen in the Pachón cave. Both point mutations caused rescue of
pigmentation (Fig. 4e–j). However, neither the deletion found in
the
Molino cave nor the deletion found in the Pachón cave caused
rescue
of pigmentation (Fig. 4k–p). Therefore, the deletions cause loss
of
function of OCA2, whereas the two point mutations do not
drastically
affect the function of OCA2 in this cell line, strongly
suggesting that
the exon 21 deletion is the mutation that causes albinism in the
Molino cave population and the exon 24 deletion is the mutation
that
causes albinism in the Pachón population.
The identification of different inactivating mutations in Oca2 in
the
Molino and Pachón populations suggests that albinism evolved
independently in these two caves, by convergent evolution in
the
same gene. The independent evolution of Oca2 in the two caves
is
further supported by analysis of amino acid changes and neutral
base
changes; these polymorphisms do not group the Molino and
Pachón
populations together to the exclusion of the surface population
(Supplementary Table 2 online).
We also examined another cave popula-
tion, Japonés, that contains albino indivi-
duals (Fig. 1a). In a complementation test
between an albino Japonés individual and an
albino Pachón individual, only albino off-
spring resulted, suggesting that albinism in
the Japonés population also arose through
mutations in the Oca2 gene (data not
shown). Sequencing of Oca2 from one albino
Japonés individual showed that neither the
Molino nor the Pachón deletion was present
(data not shown), though the two point
mutations found in the Pachón cave were
found. Together with the complementation
data, this result suggests that a third, inde-
pendent mutation in the Oca2 gene, perhaps
in a regulatory sequence, is responsible for
the convergent albinism phenotype in the
Japonés cave.
The parallel evolution of loss of pigmenta-
tion and loss of eyes within the species
Astyanax is mirrored in many other cave
dwelling organisms. The most debated issue
about cave animals is why this loss of eyes
and pigmentation occurs. There are three
main theories1,8,9,15. First, the genes respon-
sible for structures or pathways that are not
advantageous in a dark environment, such as
eyes or pigmentation, might accumulate dele-
terious mutations and, over time, completely
degenerate. Second, it might be advantageous
to lose eyes and pigmentation to conserve the
energy or space that these structures con-
sume. Third, the genetic changes that cause loss of eye and
pigmenta-
tion might cause changes in other structures or pathways that
might
be advantageous in the cave environment.
The identification of the mutations responsible for loss of
pigmen-
tation in Astyanax allows us to consider the molecular nature of
the
variation facilitating this change in response to the cave
environment.
It is notable that Oca2 has repeatedly mutated in the cave
populations
we examined. It is possible that in the cave environment, loss of
Oca2
function is actually advantageous, for some as yet unknown
reason.
Alternatively, Oca2 might be mutated more often than other
pigmen-
tation pathway genes in Astyanax simply because Oca2
mutations do
not seem to have any deleterious effects aside from loss of
pigmenta-
tion and problems with vision. It is possible that some of the
other
pigmentation genes have more pleiotropic effects and that those
mutations are not as viable; for example, all of the mutations in
zebrafish Tyr that cause complete loss of pigmentation are only
semiviable16. A final explanation is that Oca2 is the most
frequently
targeted pigmentation gene in Astyanax for the same reasons
that it
seems to be in humans: first, Oca2 presents a very large target
size for
mutagenesis, being 345 kb in humans, with 24 exons11. Second,
human Oca2 maps to a region characterized by repetitive
sequences,
which are often associated with chromosomal rearrangements
and
deletions17. Although it is not yet known whether the Astyanax
Oca2
locus is similarly characterized by a large size and a large
number of
associated repeat sequences, the most parsimonious explanation
seems
to be a combination of a lack of deleterious pleiotropic effects
in
conjunction with the structure of Oca2 itself. These sorts of
features
may, in general, predispose certain loci to be targets for
evolutionary
80
Molino backcross Molino backcross
70
60
50
L
O
D
40
30
20
10
0
80
70
60
50
L
O
D
40
30
20
10
0
0
2 2
0
5
E
1 2
8
1
4 3 1 2
6
A
2 2 2 3 2 2 1 2 4 3 1 2
6 1 3 1
7 3
EA
3
F
A
2 2 2 3
3
B
0
5
B
0
C
3
C8
3 1
E
2
B
1 0
5
E
0
a
3
B
1 3 1
3 7 3
A EF
3 0 0
C C 5
B
3
2
B E
1
0
a
20 40 60
cM
LG 16 LG 16
80 100 120 0 20 40 60
cM
80 100 120
O
c
a
2
Molino × Pachón
a
b
c
Figure 3 Oca2 is linked to albinism in both the Pachón and
Molino cave populations. (a) The albino
locus in the Molino backcross is in linkage group (LG) 16. The
LOD score is plotted against the
distance (in cM) across this linkage group. (b) An albino
Pachón � Molino hybrid, showing
noncomplementation. (c) The marker in Oca2 is located at the
albino locus in the Molino backcross
and its inclusion in the analysis greatly increases the LOD
score.
NATURE GENETICS VOLUME 38 [ NUMBER 1 [ JANUARY
2006 109
L E T T E R S
©
2
0
0
6
N
a
tu
re
P
u
b
lis
h
in
g
G
ro
u
p
h
tt
p
:/
/w
w
w
.n
a
tu
re
.c
o
m
/n
a
tu
re
g
e
n
e
tic
s
forces effecting morphological change. The existence of at least
86
species of cavefish2, a subset of which show albinism, will
allow for
further examination of the parallel evolution of this trait in the
cave
environment.
We have seen that albinism has evolved in two different cave
populations through independent changes in the same gene.
Other
studies have also shown that one gene is responsible for the
same
morphological change in multiple populations or species:
ectodyspla-
sin (Eda) in body armor and Pitx1 in pelvic reduction in the
three-
spine stickleback18,19, ovo (shaven-baby) in trichome loss in
different
drosophilids20, and MC1R in pigmentation in pocket mice,
jaguars
and several avian species21,22. Thus, the same morphology
often
evolves by mutation in the same gene, possibly because it is the
most efficient or best way for a certain phenotype to evolve.
Another issue often discussed regarding the evolution of
morpho-
logical change is whether coding changes or regulatory changes
generate new traits. Regulatory mutations have an advantage as
agents
of morphological change in that they can alter a gene’s activity
in a
subset of the regions in which it is expressed. Regulatory
mutations
have been identified or implicated in morphological change in
plate
armor and pelvic reduction in sticklebacks18,19, wing-spot
pigmenta-
tion in Drosophila biarmipes23, muscle mass in pigs24 and
trichome
loss in drosophilids20. Often it is difficult to confirm that a
gene has a
specific regulatory mutation, as these mutations can span large
areas
of sequence. In contrast, coding differences are easier to find. It
is
notable that many of the examples of evolutionary change
involving
coding mutations that have previously been described, including
our
example of Oca2 in albinism in Astyanax, involve overall
changes in
pigmentation21,22. This could be because pleiotropic effects of
pig-
mentation genes are minimal and usually do not affect the
viability of
the organism.
We have identified specific genetic lesions responsible for the
parallel evolution of albinism in different cave populations of
Astya-
nax, and found that they represent convergent genetic events in
separate populations. The genetic tools we have developed will
facilitate further investigation into the molecular bases for the
evolu-
tion of specialized morphological characteristics in the unique
and
well-studied cave environment.
METHODS
Crosses. We used five crosses in this study: a Molino backcross,
a Pachón
F2 cross, a Pachón backcross, a Molino � Pachón
complementation cross
and a Pachón � Japonés complementation cross (see
Supplementary
Methods online).
Microsatellite identification. To make a genomic library, we
digested genomic
surface-fish DNA with Sau3AI and cloned fragments of 500–
700 bp into
BamH1-linearized pBluescriptSK+ (Stratagene). We then
electroporated the
library into SURE electroporation-competent cells (Stratagene).
A 32P- or
digoxigenin-end-labeled (CA)12 probe was used to hybridize
colony lifts and
colonies hybridizing to the probe were sequenced using T3 and
T7 primers.
Primers to detect microsatellites that had ten or more repeats
were
designed using Primer3. The following tag sequence was added
to the 5¢ end
of every forward primer: 5¢-CACGACGTTGTAAAACGAC-3¢
(Y.Z. and L.I.Z.,
unpublished data).
Genotyping and linkage map construction. We genotyped 111
individuals
for 300 microsatellite markers in the Molino backcross and 235
indi-
viduals with 254 microsatellites in the Pachón F2 cross. PCR
reactions
were 10 ml in volume and contained 0.1 mM MgCl2, 6 mM
Tris-HCl,
pH 8.3, 30 mM KCl, 0.006% glycerol, 0.25 mM dNTP mix
(Roche),
0.06% Tween, 0.06% Nonidet P-40, 0.25 units of Taq DNA
polymerase
(Roche), 5 nM forward primer, 200 nM reverse primer and 200
nM of the
fluorescent tag primer 5¢-CACGACGTTGTAAAACGAC-3¢
labeled with
one of two phosphoramidite conjugates, Hex and Fam, using a
PCR program
as described25. Each PCR reaction was primed with the specific
forward
primer. The majority of cycles used the forward primer in
excess—the
fluorescently labeled tag (Y.Z. and L.I.Z., unpublished data).
Three
Fam-labeled PCR products and three Hex-labeled PCR products
were pooled
and run on an ABI 3700 with GeneScan-500 ROX size standard
(Applied
Biosystems). Genotyper software (version 3.6) was used to
analyze the
genotyping results. The program JoinMap was used to make the
microsatellite
linkage map using the Kosambi mapping function, a jump
threshold of 5.0 and
Surface Oca2
Pachón Oca2
Molino Oca2
a
b c
f
i
l
o
e
h
k
n
d
g
j
m
p
Figure 4 Different Oca2 exon deletions in the Molino
population and
the Pachón population cause loss of function of the OCA2
protein.
(a) Schematics of the surface, Pachón and Molino Oca2 coding
regions.
Asterisks in the Pachón Oca2 represent changes in conserved
amino acid
residues: red asterisk, methionine to valine; blue asterisk,
proline to serine
(see Supplementary Figs. 1 and 2). In the Pachón coding
sequence, exon
24 is almost completely deleted. Following exon 23 are
additional sequence
(intron 23), the last few amino acids of exon 24, and the 3¢
UTR. The
Molino coding sequence is identical to that of the surface-fish
Oca2 except
that exon 21 is missing. (b–d) Transfection of the unmodified
surface-fish
Oca2 construct results in highly pigmented cells. (e–g)
Transfection of the
construct encoding the methionine-to-valine substitution, found
in the
Pachón cave, results in pigmented cells, although they are
slightly less
pigmented than the cells transfected with the surface-fish
sequence.
(h–j) Transfection of the construct encoding the proline-to-
serine
substitution results in highly pigmented cells. (k–p)
Transfection of the
construct with the extra intron 23 sequence and exon 24
deletion (k–m)
or the construct with the exon 21 deletion (n–p) does not rescue
pigmentation. b,e,h,k,n show bright-field pictures of the melan-
p cell line
transfected with different constructs; c,f,i,l,o show the
corresponding
transfected cells visualized by fluorescence (all constructs were
co-injected
with pUB-GFP26); and d,g,j,m,p provide schematics of the
constructs
transfected in each experiment.
110 VOLUME 38 [ NUMBER 1 [ JANUARY 2006 NATURE
GENETICS
L E T T E R S
©
2
0
0
6
N
a
tu
re
P
u
b
lis
h
in
g
G
ro
u
p
h
tt
p
:/
/w
w
w
.n
a
tu
re
.c
o
m
/n
a
tu
re
g
e
n
e
tic
s
a ripple function. For the Molino backcross, 267 of 300 markers
were grouped
into 35 linkage groups using a LOD threshold of 4.0.
QTL mapping. We used the interval mapping function of
MapQTL26 to
determine the albino locus and determined significant LOD
scores using a
permutation test.
Cloning and mapping of albinism candidate genes. We obtained
fragments of
Astyanax Tyr, Trp1 and Oca2 by degenerate PCR. For primers
and specifics, see
Supplementary Methods. The fragment that we initially
amplified by degen-
erate PCR of Oca2 contained exons 11–23. We were able to
amplify exon 1 of
Oca2 from the DNA of surface fish by designing primers to the
area of exon 1
that is most conserved between zebrafish and fugu. Using a
forward primer in
exon 1, 5¢-GAGCCCAGGGTCATCAGG-3¢, we obtained the
sequence through
exon 11. To obtain the 5¢ and 3¢ ends, we used the SMART
Race cDNA
kit (Clontech).
Genomic analysis of missing Oca2 exons in Pachón and Molino
populations.
We carried out PCR to exons 21 and exons 14 for genomic DNA
from all
individuals of the Molino backcross using the following
primers: exon 21F,
exon 21R, exon 14F and exon 14R (see Supplementary Table 1
online for all
primer sequences). For the Pachón backcross, we amplified
intron 23 and exon
24 to the 3¢ untranslated region using the following primers:
intron 23F, intron
23R, exon 24F and 3¢ UTR.
Sequencing of full-length Oca2 coding region for Surface,
Molino and
Pachón fish. We extracted RNA from fin clips and whole fish
using Trizol
(Invitrogen), and we made cDNA using AMV reverse
transcriptase (Roche). To
amplify the full-length cDNA, we used primers from the 5¢ and
3¢ untranslated
regions of Oca2. In some cases, we amplified Oca2 in two
pieces for ease of
amplification, using a reverse primer in exon 12 and a forward
primer in exon
10. We compared Oca2 sequences from five surface fish, five
Molino fish and
two Pachón fish.
Making overexpression constructs. We cloned surface, Molino
and Pachón
full-length sequences into pGEM-T Easy (Promega). We cloned
the missing
exon 21 (Molino) and missing exon 24 plus extra sequence
(Pachón) cloned
into the surface-fish construct using MluI and SmaI. pUB-
GFP26, a vector that
encodes GFP under the control of the human ubiquitin promoter,
was used as
the backbone for the overexpression constructs. pUB-GFP was
blunted with
SmaI and MscI, removing the GFP, and pGEM-T Easy surface-
fish Oca2,
surface-fish Oca2 minus exon 21 and surface-fish Oca2 minus
exon 24 were
blunted with PvuII. The different Oca2 fragments and the pUB
fragment were
ligated together (Takara), putting surface-fish Oca2 under the
control of the
ubiquitin promoter. To make the point mutations found in the
Pachón cave, we
carried out site-directed mutagenesis using the QuikChange site
directed
mutagenesis kit (Stratagene) on the pUB-surface Oca2
construct.
Cell line assay. We obtained melan-p cells from D. Bennett’s
group and
cultured them as described14. We then transfected the cells on
3-cm plates
using Fugene (Roche) and 1 mg of each construct. The
transfections were as
follows: pUB-GFP alone26, pUB-GFP with pUB-surface Oca2,
pUB-GFP with
pUB-surface minus exon 21, pUB-GFP with pUB surface minus
exon 24 and
the proline-to-serine amino acid substitution, pUB-GFP with
pUB-surface
Oca2 with the methionine-to-valine substitution, and pUB-GFP
with pUB-
surface Oca2 with the proline-to-serine substitution. After
transfection, we
waited 4 d for pigmentation to develop.
Accession numbers. GenBank: A. mexicanus microsatellite
markers,
BV678703–BV678968; A. mexicanus Oca2, DQ232591.
Note: Supplementary information is available on the Nature
Genetics website.
ACKNOWLEDGMENTS
This work was supported by US National Science Foundation
grant IBN0217178
to R. Borowsky and C.J. Tabin. The authors thank L. Mekios for
phenotyping
and fish maintenance, the Bennett group for the use of the
melan-p cell line,
T. Matsuda for the pUB-GFP construct, R.C. Albertson for
critical reading of the
manuscript, and C. Peichel, R.V. Pearse II, J.L. Galloway and J.
Rivera-Feliciano
for help and advice.
COMPETING INTERESTS STATEMENT
The authors declare that they have no competing financial
interests.
Published online at http://www.nature.com/naturegenetics/
Reprints and permissions information is available online at
http://npg.nature.com/
reprintsandpermissions/
1. Culver, D.C. Cave Life (Harvard University, Cambridge,
1982).
2. Romero, A. & Paulson, K.M. It’s a wonderful hypogean life:
a guide to the troglomorphic
fishes of the world. Environ. Biol. Fishes 62, 13–41 (2001).
3. Espinasa, L., Rivas-Manzano, P. & Perez, H. A new blind
cave fish population of genus
Astyanax: geography, morphology and behavior. Environ. Biol.
Fishes 62, 339–344
(2001).
4. Wilkens, H. Evolution and genetics of epigean and cave
Astyanax (Characidae, Pisces).
Evol. Biol. 23, 271–367 (1988).
5. Yamamoto, Y., Espinasa, L., Stock, D.W. & Jeffery, W.R.
Development and evolution of
craniofacial patterning is mediated by eye-dependent and -
independent processes in
the cavefish Astyanax. Evol. Dev. 5, 435–446 (2003).
6. Dowling, T.E., Martasian, D.P. & Jeffery, W.R. Evidence for
multiple genetic forms with
similar eyeless phenotypes in the blind cavefish, Astyanax
mexicanus. Mol. Biol. Evol.
19, 446–455 (2002).
7. Strecker, U., Bernatchez, L. & Wilkens, H. Genetic
divergence between cave
and surface populations of Astyanax in Mexico (Characidae,
Teleostei). Mol. Ecol.
12, 699–710 (2003).
8. Strecker, U., Faundez, V.H. & Wilkens, H. Phylogeography
of surface and cave Astyanax
(Teleostei) from Central and North America based on
cytochrome b sequence data.
Mol. Phylogenet. Evol. 33, 469–481 (2004).
9. Borowsky, R. & Wilkens, H. Mapping a cave fish genome:
polygenic systems and
regressive evolution. J. Hered. 93, 19–21 (2002).
10. Sadoglu, P. & McKee, A. A second gene that effects eye and
body color in Mexican
blind cave fish. J. Hered. 60, 10–14 (1969).
11. Oetting, W.S., Garrett, S.S., Brott, M. & King, R.A. P gene
mutations
associated with oculocutaneous albinism type II (OCA2). Hum.
Mutat. 25, 323
(2005).
12. Fukamachi, S. et al. Conserved function of medaka pink-
eyed dilution in melanin
synthesis and its divergent transcriptional regulation in gonads
among vertebrates.
Genetics 168, 1519–1527 (2004).
13. Rinchik, E.M. et al. A gene for the mouse pink-eyed
dilution locus and for human
type II oculocutaneous albinism. Nature 361, 72–76 (1993).
14. Sviderskaya, E.V. et al. Complementation of
hypopigmentation in p-mutant
(pink-eyed dilution) mouse melanocytes by normal human P
cDNA, and defective
complementation by OCA2 mutant sequences. J. Invest.
Dermatol. 108, 30–34
(1997).
15. Jeffery, W.R. Adaptive evolution of eye degeneration in the
Mexican blind cavefish.
J. Hered. 96, 185–196 (2005).
16. Page-McCaw, P.S. et al. Retinal network adaptation to
bright light requires tyrosinase.
Nat. Neurosci. 7, 1329–1336 (2004).
17. Yi, Z. et al. A 122.5-kilobase deletion of the P gene
underlies the high prevalence
of oculocutaneous albinism type 2 in the Navajo population.
Am. J. Hum. Genet. 72,
62–72 (2003).
18. Colosimo, P.F. et al. Widespread parallel evolution in
sticklebacks by repeated fixation
of Ectodysplasin alleles. Science 307, 1928–1933 (2005).
19. Shapiro, M.D. et al. Genetic and developmental basis of
evolutionary pelvic reduction
in threespine sticklebacks. Nature 428, 717–723 (2004).
20. Sucena, E., Delon, I., Jones, I., Payre, F. & Stern, D.L.
Regulatory evolution of
shavenbaby/ovo underlies multiple cases of morphological
parallelism. Nature 424,
935–938 (2003).
21. Majerus, M.E. & Mundy, N.I. Mammalian melanism: natural
selection in black and
white. Trends Genet. 19, 585–588 (2003).
22. Mundy, N.I. A window on the genetics of evolution: MC1R
and plumage colouration in
birds. Proc. Biol. Sci. 272, 1633–1640 (2005).
23. Gompel, N., Prud’homme, B., Wittkopp, P.J., Kassner, V.A.
& Carroll, S.B. Chance
caught on the wing: cis-regulatory evolution and the origin of
pigment patterns in
Drosophila. Nature 433, 481–487 (2005).
24. Van Laere, A.S. et al. A regulatory mutation in IGF2 causes
a major QTL effect on
muscle growth in the pig. Nature 425, 832–836 (2003).
25. Peichel, C.L. et al. The genetic architecture of divergence
between three spine
stickleback species. Nature 414, 901–905 (2001).
26. Matsuda, T. & Cepko, C.L. Electroporation and RNA
interference in the rodent retina
in vivo and in vitro. Proc. Natl. Acad. Sci. USA 101, 16–22
(2004).
NATURE GENETICS VOLUME 38 [ NUMBER 1 [ JANUARY
2006 111
L E T T E R S
©
2
0
0
6
N
a
tu
re
P
u
b
lis
h
in
g
G
ro
u
p
h
tt
p
:/
/w
w
w
.n
a
tu
re
.c
o
m
/n
a
tu
re
g
e
n
e
tic
s
Reproduced with permission of the copyright owner. Further
reproduction prohibited without permission.
23. W. K. Kroeze, D. J. Sheffler, B. L. Roth, J. Cell Sci. 116,
4867–4869 (2003).
24. J. S. Gutkind, Sci. STKE 2000, re1 (2000).
25. M. J. Marinissen, J. S. Gutkind, Trends Pharmacol. Sci.
22, 368–376 (2001).
Acknowledgments: We thank the anonymous reviewers for their
thoughtful and insightful critiques, which substantively
improved
this manuscript. Supported by the Singapore University of
Technology
and Design–Massachusetts Institute of Technology International
Design Center (IDG31300103) and by Natural Sciences and
Engineering Research Council (Discovery Grant 125517855).
Supplementary Materials
www.sciencemag.org/content/343/6177/1373/suppl/DC1
Materials and Methods
Figs. S1 to S4
Tables S1 and S2
References (26–70)
18 June 2013; accepted 31 January 2014
10.1126/science.1242063
Fossilized Nuclei and Chromosomes
Reveal 180 Million Years of
Genomic Stasis in Royal Ferns
Benjamin Bomfleur,1* Stephen McLoughlin,1* Vivi Vajda2
Rapidly permineralized fossils can provide exceptional insights
into the evolution of life over geological
time. Here, we present an exquisitely preserved, calcified stem
of a royal fern (Osmundaceae)
from Early Jurassic lahar deposits of Sweden in which
authigenic mineral precipitation from
hydrothermal brines occurred so rapidly that it preserved
cytoplasm, cytosol granules, nuclei, and even
chromosomes in various stages of cell division. Morphometric
parameters of interphase nuclei match
those of extant Osmundaceae, indicating that the genome size of
these reputed “living fossils” has
remained unchanged over at least 180 million years—a
paramount example of evolutionary stasis.
R
oyal ferns (Osmundaceae) are a basal
group of leptosporangiate ferns that have
undergone little morphological and an-
atomical change since Mesozoic times (1–6).
Well-preserved fossil plants from 220-million-
year-old rocks already exhibit the distinctive ar-
chitecture of the extant interrupted fern (Osmunda
claytoniana) (2), and many permineralized os-
mundaceous rhizomes from the Mesozoic are
practically indistinguishable from those of mod-
ern genera (3–5) or species (6). Furthermore, with
the exception of one natural polyploid hybrid
(7), all extant Osmundaceae have an invariant
and unusually low chromosome count (7, 8), sug-
gesting that the genome structure of these ferns
may have remained unchanged over long periods
of geologic time (8). To date, evidence for evo-
lutionary conservatism in fern genomes has been
exclusively based on studies of extant plants
(9, 10). Here, we present direct paleontological
evidence for long-term genomic stasis in this
family in the form of a calcified osmundaceous
rhizome from the Lower Jurassic of Sweden with
pristinely preserved cellular contents, including
nuclei and chromosomes.
The specimen was collected from mafic vol-
caniclastic rocks [informally named the “Djupadal
formation” (11)] at Korsaröd near Höör, Scania,
Sweden [fig. S1 of (12)]. Palynological analysis in-
dicates an Early Jurassic (Pliensbachian) age for
these deposits (11) (fig. S2), which agrees with
radiometric dates obtained from nearby volcanic
necks (13) from which the basaltic debris originated.
The fern rhizome was permineralized in vivo by
calcite from hydrothermal brines (11, 14) that per-
1Department of Palaeobiology, Swedish Museum of Natural
History, Post Office Box 50007, SE-104 05 Stockholm, Sweden.
2Department of Geology, Lund University, Sölvegatan 12,
SE-223 62 Lund, Sweden.
*Corresponding author. E-mail: [email protected]
nrm.se (B.B.); [email protected] (S.M.)
Fig. 1. Cytologicalfeaturespreservedintheapicalregion
of the Korsaröd fern fossil. (A) transverse section through
the rhizome; (B) detail of radial longitudinal section showing
typical pith-parenchyma cells with preserved cell membranes
(arrow), cytoplasm and cytosol particles, and interphase nuclei
with prominent nucleoli; (C) interphase nucleus with nucleolus
and intact nuclear membrane; (D) early prophase nucleus with
condensing chromatin and disintegrating nucleolus and
nuclear membrane; (E and F) late prophase cells with coiled
chromosomes and with nucleolus and nuclear membrane
completely disintegrated; (G and H) prometaphase cells
showing chromosomes aligning at the equator of the nucleus;
(I and J) possible anaphase cells showing chromosomes at-
tenuated toward opposite poles. (A), (C to E), (G), and (I)
are from NRM S069656. (B), (F), (H), and (J) are from NRM
S069658. Scale bars: (A) 500 mm; (B) 20 mm; (C to J) 5 mm.
21 MARCH 2014 VOL 343 SCIENCE www.sciencemag.org1376
REPORTS
o
n
F
e
b
ru
a
ry
1
3
,
2
0
1
5
w
w
w
.s
ci
e
n
ce
m
a
g
.o
rg
D
o
w
n
lo
a
d
e
d
f
ro
m
o
n
F
e
b
ru
a
ry
1
3
,
2
0
1
5
w
w
w
.s
ci
e
n
ce
m
a
g
.o
rg
D
o
w
n
lo
a
d
e
d
f
ro
m
http://www.sciencemag.org/
colated through the coarse-grained sediments short-
ly after deposition (table S1). The fossil is 6 cm
long and 4 cm wide and consists of a small (~7 mm
diameter) central stem surrounded by a dense man-
tle ofpersistentfrondbaseswithinterspersed rootlets
(Fig. 1). Its complex reticulate vascular cylinder
(ectophloic dictyoxylic siphonostele), parenchym-
atous pith and inner cortex, and thick fibrous outer
cortex are characteristic features of Osmundaceae
(1, 3–5, 12) (fig. S3). Moreover, the frond bases
mantling the rhizome contain a heterogeneous scle-
renchyma ring that is typical of extant Osmunda
sensu lato (1, 3, 4, 12) (fig. S4). The presence of
a single root per leaf trace favors affinities with
(sub)genus Osmundastrum (1, 3, 6, 12).
The specimen is preserved in exquisite sub-
cellular detail (Fig. 1 and figs. S4 and S5). Pa-
renchyma cells in the pith and cortex show
preserved cell contents, including membrane-
bound cytoplasm, cytosol granules, and possible
amyloplasts (Fig. 1 and fig. S5). Most cells con-
tain interphase nuclei with conspicuous nucleoli
(Fig. 1, figs. S4 and S5, and movies S1 and S2).
Transverse and longitudinal sections through the
apical part of the stem also reveal sporadic dividing
parenchyma cells, mainly in the pith periphery
(Fig. 1). These are typically preserved in prophase
or telophase stages, in which the nucleolus and nu-
clear envelope are more or less unresolved and the
chromatin occurs in the form of diffuse, granular
material or as distinct chromatid strands. A few
cells contain chromosomes that are aligned at the
equator of the nucleus, indicative of early meta-
phase, and two cells were found to contain chromo-
somes that appear to be attenuated toward opposite
poles, representing possible anaphase stages.
Some tissue portions in the stem cortex and the
outer leaf bases show signs of necrosis and pro-
grammed cell death (fig. S6).
Such fine subcellular detail has rarely been
documented in fossils (15–17) because the chances
for fossilization of delicate organelles are small
(16) and their features are commonly ambiguous
(17). The consistent distribution and architec-
ture of the cellular contents in the Korsaröd fern
fossil resolved via light microscopy (Fig. 1 and
fig. S4), scanning electron microscopy (fig. S5),
and synchrotron radiation x-ray tomographic
microscopy (SRXTM) (fig. S5 and movies S1
and S2) provide unequivocal evidence for three-
dimensionally preserved organelles.
Positive scaling relationships rooted in DNA
content can be used to extrapolate relative ge-
nome sizes and ploidy levels of plants (18–21).
We measured minimum and maximum diame-
ters, perimeters, and maximum cross-sectional
areas of interphase nuclei in pith and cortical
parenchyma cells of the fossil and of its extant
relative Osmundastrum cinnamomeum. The mea-
surements match very closely (Fig. 2), with mean
nuclear perimeters of 32.2 versus 32.6 mm and
mean areas of 82.2 versus 84.9 mm2 in the fossil
and in extant Osmundastrum, respectively. The
equivalent nuclear sizes demonstrate that the
Korsaröd fern fossil and extant Osmundaceae
likely share the same chromosome count and DNA
content, and thus suggest that neither ploidization
events nor notable amounts of gene loss have
occurred in the genome of the royal ferns since
the Early Jurassic ~180 million years ago [(8),
see also discussion in (9, 10)]. These results, in
concert with morphological and anatomical evi-
dence (1–6), indicate that the Osmundaceae rep-
resents a notable example of evolutionary stasis
among plants.
References and Notes
1. W. Hewitson, Ann. Mo. Bot. Gard. 49, 57–93 (1962).
2. C. Phipps et al., Am. J. Bot. 85, 888–895 (1998).
3. C. N. Miller, Contrib. Mus. Paleontol. 23, 105–169 (1971).
4. G. W. Rothwell, E. L. Taylor, T. N. Taylor, Am. J. Bot. 89,
352–361 (2002).
5. N. Tian, Y.-D. Wang, Z.-K. Jiang, Palaeoworld 17,
183–200 (2008).
6. R. Serbet, G. W. Rothwell, Int. J. Plant Sci. 160, 425–433
(1999).
7. C. Tsutsumi, S. Matsumoto, Y. Yatabe-Kakugawa,
Y. Hirayama, M. Kato, Syst. Bot. 36, 836–844 (2011).
8. E. J. Klekowski, Am. J. Bot. 57, 1122–1138 (1970).
9. M. S. Barker, P. G. Wolf, Bioscience 60, 177–185 (2010).
10. I. J. Leitch, A. R. Leitch, in Plant Genome Diversity,
I. J. Leitch, J. Greilhuber, J. Doležel, J. F. Wendel, Eds.
(Springer-Verlag, Wien, 2013), vol. 2, pp. 307–322.
11. C. Augustsson, GFF 123, 23–28 (2001).
12. See supplementary materials available on Science Online.
13. I. Bergelin, GFF 131, 165–175 (2009).
14. A. Ahlberg, U. Sivhed, M. Erlström, Geol. Surv. Denm.
Greenl. Bull. 1, 527–541 (2003).
15. S. D. Brack-Hanes, J. C. Vaughn, Science 200,
1383–1385 (1978).
16. K. J. Niklas, Am. J. Bot. 69, 325–334 (1982).
17. J. W. Hagadorn et al., Science 314, 291–294 (2006).
18. A. E. DeMaggio, R. H. Wetmore, J. E. Hannaford,
D. E. Stetler, V. Raghavan, Bioscience 21, 313–316 (1971).
19. J. Masterson, Science 264, 421–424 (1994).
20. I. Símová, T. Herben, Proc. Biol. Sci. 279, 867–875 (2012).
21. B. H. Lomax et al., New Phytol. 201, 636–644 (2014).
Acknowledgments: We thank E. M. Friis and S. Bengtson
(Stockholm) and F. Marone and M. Stampanoni (Villigen) for
assistance with SRXTM analyses at the Swiss Light Source,
Paul
Scherrer Institute (Villigen); G. Grimm (Stockholm) for
assistance
with statistical analyses; B. Bremer and G. Larsson (Stockholm)
for providing live material of Osmunda; M. A. Gandolfo Nixon
and J. L. Svitko (Ithaca, New York) for permission to use
images
from the Cornell University Plant Anatomy Collection (CUPAC;
http://cupac.bh.cornell.edu/); the members of Tjörnarps
Sockengille (Tjörnarp) for access to the fossil locality; A.-L.
Decombeix
(Montpellier), I. Bergelin (Lund), C. H. Haufler (Lawrence,
Kansas),
N. Tian (Shenyang), Y.-D. Wang (Nanjing), and T. E. Wood
(Flagstaff, Arizona) for discussion; and two anonymous referees
for
constructive comments. This research was jointly supported by
the
Swedish Research Council (VR), Lund University Carbon Cycle
Centre (LUCCI), and the Royal Swedish Academy of Sciences.
The
material is curated at the Swedish Museum of Natural History
(Stockholm, Sweden) under accession nos. S069649 to S069658
and S089687 to S089693.
Supplementary Materials
www.sciencemag.org/content/343/6177/1376/suppl/DC1
Materials and Methods
Supplementary Text
Figs. S1 to S6
Table S1
References (22–36)
Movies S1 and S2
17 December 2013; accepted 21 February 2014
10.1126/science.1249884
Fig. 2. Morphometric
parameters of inter-
phase nuclei of extant
O. cinnamomeum com-
pared to those of the
Korsaröd fern fossil. Col-
ored box-and-whiskers plots
in upper graph indicate
interquartile ranges (box)
with mean (square), me-
dian (solid transverse bar),
and extrema (whiskers);
dashed colored lines in
lower graph indicate linear
fits (n = 76 versus n = 37
measured nuclei for extant
O. cinnamomeum versus
the fossil).
www.sciencemag.org SCIENCE VOL 343 21 MARCH 2014
1377
REPORTS
DOI: 10.1126/science.1249884
, 1376 (2014);343 Science
et al.Benjamin Bomfleur
Genomic Stasis in Royal Ferns
Fossilized Nuclei and Chromosomes Reveal 180 Million Years
of
This copy is for your personal, non-commercial use only.
clicking here.colleagues, clients, or customers by
, you can order high-quality copies for yourIf you wish to
distribute this article to others
here.following the guidelines
can be obtained byPermission to republish or repurpose articles
or portions of articles
): February 13, 2015 www.sciencemag.org (this information is
current as of
The following resources related to this article are available
online at
http://www.sciencemag.org/content/343/6177/1376.full.html
version of this article at:
including high-resolution figures, can be found in the
onlineUpdated information and services,
http://www.sciencemag.org/content/suppl/2014/03/19/343.6177.
1376.DC1.html
can be found at: Supporting Online Material
http://www.sciencemag.org/content/343/6177/1376.full.html#ref
-list-1
, 10 of which can be accessed free:cites 33 articlesThis article
http://www.sciencemag.org/content/343/6177/1376.full.html#rel
ated-urls
1 articles hosted by HighWire Press; see:cited by This article
has been
http://www.sciencemag.org/cgi/collection/paleo
Paleontology
subject collections:This article appears in the following
registered trademark of AAAS.
is aScience2014 by the American Association for the
Advancement of Science; all rights reserved. The title
CopyrightAmerican Association for the Advancement of
Science, 1200 New York Avenue NW, Washington, DC 20005.
(print ISSN 0036-8075; online ISSN 1095-9203) is published
weekly, except the last week in December, by theScience
o
n
F
e
b
ru
a
ry
1
3
,
2
0
1
5
w
w
w
.s
ci
e
n
ce
m
a
g
.o
rg
D
o
w
n
lo
a
d
e
d
f
ro
m
http://www.sciencemag.org/about/permissions.dtl
http://www.sciencemag.org/content/343/6177/1376.full.html
http://www.sciencemag.org/content/suppl/2014/03/19/343.6177.
1376.DC1.html
http://www.sciencemag.org/content/343/6177/1376.full.html#ref
-list-1
http://www.sciencemag.org/content/343/6177/1376.full.html#rel
ated-urls
http://www.sciencemag.org/cgi/collection/paleo
http://www.sciencemag.org/

More Related Content

Similar to Genetic analysis of cavefish reveals molecular convergencein.docx

Phylogeny-Driven Approaches to Genomics and Metagenomics - talk by Jonathan E...
Phylogeny-Driven Approaches to Genomics and Metagenomics - talk by Jonathan E...Phylogeny-Driven Approaches to Genomics and Metagenomics - talk by Jonathan E...
Phylogeny-Driven Approaches to Genomics and Metagenomics - talk by Jonathan E...Jonathan Eisen
 
Genome-wide analysis reveal patterns of species collapse despite strong pluma...
Genome-wide analysis reveal patterns of species collapse despite strong pluma...Genome-wide analysis reveal patterns of species collapse despite strong pluma...
Genome-wide analysis reveal patterns of species collapse despite strong pluma...VanessaLuzuriaga
 
Gutell 099.nature.2006.443.0931
Gutell 099.nature.2006.443.0931Gutell 099.nature.2006.443.0931
Gutell 099.nature.2006.443.0931Robin Gutell
 
Haemogregarine in turtle
Haemogregarine in turtleHaemogregarine in turtle
Haemogregarine in turtleBridget Altman
 
Honors Biology - Evolution
Honors Biology - EvolutionHonors Biology - Evolution
Honors Biology - EvolutionMichael Edgar
 
Evidence for morphological evolutionary stasis in a Middle Miocene Inselbergs...
Evidence for morphological evolutionary stasis in a Middle Miocene Inselbergs...Evidence for morphological evolutionary stasis in a Middle Miocene Inselbergs...
Evidence for morphological evolutionary stasis in a Middle Miocene Inselbergs...AndressaCabral18
 
Microbial Phylogenomics (EVE161) Class 13 - Comparative Genomics
Microbial Phylogenomics (EVE161) Class 13 - Comparative GenomicsMicrobial Phylogenomics (EVE161) Class 13 - Comparative Genomics
Microbial Phylogenomics (EVE161) Class 13 - Comparative GenomicsJonathan Eisen
 
Microbial metabolisms in a 2.5-km-deep ecosystem created by hydraulic fractur...
Microbial metabolisms in a 2.5-km-deep ecosystem created by hydraulic fractur...Microbial metabolisms in a 2.5-km-deep ecosystem created by hydraulic fractur...
Microbial metabolisms in a 2.5-km-deep ecosystem created by hydraulic fractur...Marcellus Drilling News
 
U. littoralis research symposium poster
U. littoralis research symposium posterU. littoralis research symposium poster
U. littoralis research symposium posterLauren Stoneburner
 
GENETIC ANALYSIS OF ARCHEOLOGICAL MAIZE FROM THE SITE OF SAN LORENZO (AZAPA, ...
GENETIC ANALYSIS OF ARCHEOLOGICAL MAIZE FROM THE SITE OF SAN LORENZO (AZAPA, ...GENETIC ANALYSIS OF ARCHEOLOGICAL MAIZE FROM THE SITE OF SAN LORENZO (AZAPA, ...
GENETIC ANALYSIS OF ARCHEOLOGICAL MAIZE FROM THE SITE OF SAN LORENZO (AZAPA, ...Chungara Revista de Antropología Chilena
 
Eight Primate Research
Eight Primate ResearchEight Primate Research
Eight Primate ResearchJan Champagne
 
Diatom biogeography: distribution of the Luticola species found in Iguazú Nat...
Diatom biogeography: distribution of the Luticola species found in Iguazú Nat...Diatom biogeography: distribution of the Luticola species found in Iguazú Nat...
Diatom biogeography: distribution of the Luticola species found in Iguazú Nat...JulinSimonato
 
Final_ICRS_2016_color
Final_ICRS_2016_colorFinal_ICRS_2016_color
Final_ICRS_2016_colorRachel Biggs
 
Conventional & newer aspects in taxonomy
Conventional & newer aspects in taxonomyConventional & newer aspects in taxonomy
Conventional & newer aspects in taxonomyManideep Raj
 
the others our biased perspective
the others our biased perspectivethe others our biased perspective
the others our biased perspectiveJoão Soares
 
Turtle Nest Predation Poster
Turtle Nest Predation PosterTurtle Nest Predation Poster
Turtle Nest Predation PosterShelby Does
 

Similar to Genetic analysis of cavefish reveals molecular convergencein.docx (20)

Phylogeny-Driven Approaches to Genomics and Metagenomics - talk by Jonathan E...
Phylogeny-Driven Approaches to Genomics and Metagenomics - talk by Jonathan E...Phylogeny-Driven Approaches to Genomics and Metagenomics - talk by Jonathan E...
Phylogeny-Driven Approaches to Genomics and Metagenomics - talk by Jonathan E...
 
Genome-wide analysis reveal patterns of species collapse despite strong pluma...
Genome-wide analysis reveal patterns of species collapse despite strong pluma...Genome-wide analysis reveal patterns of species collapse despite strong pluma...
Genome-wide analysis reveal patterns of species collapse despite strong pluma...
 
Gutell 099.nature.2006.443.0931
Gutell 099.nature.2006.443.0931Gutell 099.nature.2006.443.0931
Gutell 099.nature.2006.443.0931
 
9 presentación podocnemis
9 presentación podocnemis9 presentación podocnemis
9 presentación podocnemis
 
Haemogregarine in turtle
Haemogregarine in turtleHaemogregarine in turtle
Haemogregarine in turtle
 
Honors Biology - Evolution
Honors Biology - EvolutionHonors Biology - Evolution
Honors Biology - Evolution
 
Evidence for morphological evolutionary stasis in a Middle Miocene Inselbergs...
Evidence for morphological evolutionary stasis in a Middle Miocene Inselbergs...Evidence for morphological evolutionary stasis in a Middle Miocene Inselbergs...
Evidence for morphological evolutionary stasis in a Middle Miocene Inselbergs...
 
Local fisherman community_larvae knowledge
Local fisherman community_larvae knowledgeLocal fisherman community_larvae knowledge
Local fisherman community_larvae knowledge
 
Microbial Phylogenomics (EVE161) Class 13 - Comparative Genomics
Microbial Phylogenomics (EVE161) Class 13 - Comparative GenomicsMicrobial Phylogenomics (EVE161) Class 13 - Comparative Genomics
Microbial Phylogenomics (EVE161) Class 13 - Comparative Genomics
 
Microbial metabolisms in a 2.5-km-deep ecosystem created by hydraulic fractur...
Microbial metabolisms in a 2.5-km-deep ecosystem created by hydraulic fractur...Microbial metabolisms in a 2.5-km-deep ecosystem created by hydraulic fractur...
Microbial metabolisms in a 2.5-km-deep ecosystem created by hydraulic fractur...
 
U. littoralis research symposium poster
U. littoralis research symposium posterU. littoralis research symposium poster
U. littoralis research symposium poster
 
GENETIC ANALYSIS OF ARCHEOLOGICAL MAIZE FROM THE SITE OF SAN LORENZO (AZAPA, ...
GENETIC ANALYSIS OF ARCHEOLOGICAL MAIZE FROM THE SITE OF SAN LORENZO (AZAPA, ...GENETIC ANALYSIS OF ARCHEOLOGICAL MAIZE FROM THE SITE OF SAN LORENZO (AZAPA, ...
GENETIC ANALYSIS OF ARCHEOLOGICAL MAIZE FROM THE SITE OF SAN LORENZO (AZAPA, ...
 
Eight Primate Research
Eight Primate ResearchEight Primate Research
Eight Primate Research
 
Astrobiology Poster
Astrobiology PosterAstrobiology Poster
Astrobiology Poster
 
Diatom biogeography: distribution of the Luticola species found in Iguazú Nat...
Diatom biogeography: distribution of the Luticola species found in Iguazú Nat...Diatom biogeography: distribution of the Luticola species found in Iguazú Nat...
Diatom biogeography: distribution of the Luticola species found in Iguazú Nat...
 
Final_ICRS_2016_color
Final_ICRS_2016_colorFinal_ICRS_2016_color
Final_ICRS_2016_color
 
Poster sbe dta
Poster sbe dtaPoster sbe dta
Poster sbe dta
 
Conventional & newer aspects in taxonomy
Conventional & newer aspects in taxonomyConventional & newer aspects in taxonomy
Conventional & newer aspects in taxonomy
 
the others our biased perspective
the others our biased perspectivethe others our biased perspective
the others our biased perspective
 
Turtle Nest Predation Poster
Turtle Nest Predation PosterTurtle Nest Predation Poster
Turtle Nest Predation Poster
 

More from budbarber38650

 Assignment 1 Discussion Question Prosocial Behavior and Altrui.docx
 Assignment 1 Discussion Question Prosocial Behavior and Altrui.docx Assignment 1 Discussion Question Prosocial Behavior and Altrui.docx
 Assignment 1 Discussion Question Prosocial Behavior and Altrui.docxbudbarber38650
 
● what is name of the new unit and what topics will Professor Moss c.docx
● what is name of the new unit and what topics will Professor Moss c.docx● what is name of the new unit and what topics will Professor Moss c.docx
● what is name of the new unit and what topics will Professor Moss c.docxbudbarber38650
 
…Multiple intelligences describe an individual’s strengths or capac.docx
…Multiple intelligences describe an individual’s strengths or capac.docx…Multiple intelligences describe an individual’s strengths or capac.docx
…Multiple intelligences describe an individual’s strengths or capac.docxbudbarber38650
 
• World Cultural Perspective Paper Final SubmissionResources.docx
• World Cultural Perspective Paper Final SubmissionResources.docx• World Cultural Perspective Paper Final SubmissionResources.docx
• World Cultural Perspective Paper Final SubmissionResources.docxbudbarber38650
 
•       Write a story; explaining and analyzing how a ce.docx
•       Write a story; explaining and analyzing how a ce.docx•       Write a story; explaining and analyzing how a ce.docx
•       Write a story; explaining and analyzing how a ce.docxbudbarber38650
 
•Use the general topic suggestion to form the thesis statement.docx
•Use the general topic suggestion to form the thesis statement.docx•Use the general topic suggestion to form the thesis statement.docx
•Use the general topic suggestion to form the thesis statement.docxbudbarber38650
 
•The topic is culture adaptation ( adoption )16 slides.docx
•The topic is culture adaptation ( adoption )16 slides.docx•The topic is culture adaptation ( adoption )16 slides.docx
•The topic is culture adaptation ( adoption )16 slides.docxbudbarber38650
 
•Choose 1 of the department work flow processes, and put together a .docx
•Choose 1 of the department work flow processes, and put together a .docx•Choose 1 of the department work flow processes, and put together a .docx
•Choose 1 of the department work flow processes, and put together a .docxbudbarber38650
 
‘The problem is not that people remember through photographs, but th.docx
‘The problem is not that people remember through photographs, but th.docx‘The problem is not that people remember through photographs, but th.docx
‘The problem is not that people remember through photographs, but th.docxbudbarber38650
 
·                                     Choose an articleo.docx
·                                     Choose an articleo.docx·                                     Choose an articleo.docx
·                                     Choose an articleo.docxbudbarber38650
 
·You have been engaged to prepare the 2015 federal income tax re.docx
·You have been engaged to prepare the 2015 federal income tax re.docx·You have been engaged to prepare the 2015 federal income tax re.docx
·You have been engaged to prepare the 2015 federal income tax re.docxbudbarber38650
 
·Time Value of MoneyQuestion A·Discuss the significance .docx
·Time Value of MoneyQuestion A·Discuss the significance .docx·Time Value of MoneyQuestion A·Discuss the significance .docx
·Time Value of MoneyQuestion A·Discuss the significance .docxbudbarber38650
 
·Reviewthe steps of the communication model on in Ch. 2 of Bus.docx
·Reviewthe steps of the communication model on in Ch. 2 of Bus.docx·Reviewthe steps of the communication model on in Ch. 2 of Bus.docx
·Reviewthe steps of the communication model on in Ch. 2 of Bus.docxbudbarber38650
 
·Research Activity Sustainable supply chain can be viewed as.docx
·Research Activity Sustainable supply chain can be viewed as.docx·Research Activity Sustainable supply chain can be viewed as.docx
·Research Activity Sustainable supply chain can be viewed as.docxbudbarber38650
 
·DISCUSSION 1 – VARIOUS THEORIES – Discuss the following in 150-.docx
·DISCUSSION 1 – VARIOUS THEORIES – Discuss the following in 150-.docx·DISCUSSION 1 – VARIOUS THEORIES – Discuss the following in 150-.docx
·DISCUSSION 1 – VARIOUS THEORIES – Discuss the following in 150-.docxbudbarber38650
 
·Module 6 Essay ContentoThe ModuleWeek 6 essay require.docx
·Module 6 Essay ContentoThe ModuleWeek 6 essay require.docx·Module 6 Essay ContentoThe ModuleWeek 6 essay require.docx
·Module 6 Essay ContentoThe ModuleWeek 6 essay require.docxbudbarber38650
 
·Observe a group discussing a topic of interest such as a focus .docx
·Observe a group discussing a topic of interest such as a focus .docx·Observe a group discussing a topic of interest such as a focus .docx
·Observe a group discussing a topic of interest such as a focus .docxbudbarber38650
 
·Identify any program constraints, such as financial resources, .docx
·Identify any program constraints, such as financial resources, .docx·Identify any program constraints, such as financial resources, .docx
·Identify any program constraints, such as financial resources, .docxbudbarber38650
 
·Double-spaced·12-15 pages each chapterThe followi.docx
·Double-spaced·12-15 pages each chapterThe followi.docx·Double-spaced·12-15 pages each chapterThe followi.docx
·Double-spaced·12-15 pages each chapterThe followi.docxbudbarber38650
 
© 2019 Cengage. All Rights Reserved. Linear RegressionC.docx
© 2019 Cengage. All Rights Reserved.  Linear RegressionC.docx© 2019 Cengage. All Rights Reserved.  Linear RegressionC.docx
© 2019 Cengage. All Rights Reserved. Linear RegressionC.docxbudbarber38650
 

More from budbarber38650 (20)

 Assignment 1 Discussion Question Prosocial Behavior and Altrui.docx
 Assignment 1 Discussion Question Prosocial Behavior and Altrui.docx Assignment 1 Discussion Question Prosocial Behavior and Altrui.docx
 Assignment 1 Discussion Question Prosocial Behavior and Altrui.docx
 
● what is name of the new unit and what topics will Professor Moss c.docx
● what is name of the new unit and what topics will Professor Moss c.docx● what is name of the new unit and what topics will Professor Moss c.docx
● what is name of the new unit and what topics will Professor Moss c.docx
 
…Multiple intelligences describe an individual’s strengths or capac.docx
…Multiple intelligences describe an individual’s strengths or capac.docx…Multiple intelligences describe an individual’s strengths or capac.docx
…Multiple intelligences describe an individual’s strengths or capac.docx
 
• World Cultural Perspective Paper Final SubmissionResources.docx
• World Cultural Perspective Paper Final SubmissionResources.docx• World Cultural Perspective Paper Final SubmissionResources.docx
• World Cultural Perspective Paper Final SubmissionResources.docx
 
•       Write a story; explaining and analyzing how a ce.docx
•       Write a story; explaining and analyzing how a ce.docx•       Write a story; explaining and analyzing how a ce.docx
•       Write a story; explaining and analyzing how a ce.docx
 
•Use the general topic suggestion to form the thesis statement.docx
•Use the general topic suggestion to form the thesis statement.docx•Use the general topic suggestion to form the thesis statement.docx
•Use the general topic suggestion to form the thesis statement.docx
 
•The topic is culture adaptation ( adoption )16 slides.docx
•The topic is culture adaptation ( adoption )16 slides.docx•The topic is culture adaptation ( adoption )16 slides.docx
•The topic is culture adaptation ( adoption )16 slides.docx
 
•Choose 1 of the department work flow processes, and put together a .docx
•Choose 1 of the department work flow processes, and put together a .docx•Choose 1 of the department work flow processes, and put together a .docx
•Choose 1 of the department work flow processes, and put together a .docx
 
‘The problem is not that people remember through photographs, but th.docx
‘The problem is not that people remember through photographs, but th.docx‘The problem is not that people remember through photographs, but th.docx
‘The problem is not that people remember through photographs, but th.docx
 
·                                     Choose an articleo.docx
·                                     Choose an articleo.docx·                                     Choose an articleo.docx
·                                     Choose an articleo.docx
 
·You have been engaged to prepare the 2015 federal income tax re.docx
·You have been engaged to prepare the 2015 federal income tax re.docx·You have been engaged to prepare the 2015 federal income tax re.docx
·You have been engaged to prepare the 2015 federal income tax re.docx
 
·Time Value of MoneyQuestion A·Discuss the significance .docx
·Time Value of MoneyQuestion A·Discuss the significance .docx·Time Value of MoneyQuestion A·Discuss the significance .docx
·Time Value of MoneyQuestion A·Discuss the significance .docx
 
·Reviewthe steps of the communication model on in Ch. 2 of Bus.docx
·Reviewthe steps of the communication model on in Ch. 2 of Bus.docx·Reviewthe steps of the communication model on in Ch. 2 of Bus.docx
·Reviewthe steps of the communication model on in Ch. 2 of Bus.docx
 
·Research Activity Sustainable supply chain can be viewed as.docx
·Research Activity Sustainable supply chain can be viewed as.docx·Research Activity Sustainable supply chain can be viewed as.docx
·Research Activity Sustainable supply chain can be viewed as.docx
 
·DISCUSSION 1 – VARIOUS THEORIES – Discuss the following in 150-.docx
·DISCUSSION 1 – VARIOUS THEORIES – Discuss the following in 150-.docx·DISCUSSION 1 – VARIOUS THEORIES – Discuss the following in 150-.docx
·DISCUSSION 1 – VARIOUS THEORIES – Discuss the following in 150-.docx
 
·Module 6 Essay ContentoThe ModuleWeek 6 essay require.docx
·Module 6 Essay ContentoThe ModuleWeek 6 essay require.docx·Module 6 Essay ContentoThe ModuleWeek 6 essay require.docx
·Module 6 Essay ContentoThe ModuleWeek 6 essay require.docx
 
·Observe a group discussing a topic of interest such as a focus .docx
·Observe a group discussing a topic of interest such as a focus .docx·Observe a group discussing a topic of interest such as a focus .docx
·Observe a group discussing a topic of interest such as a focus .docx
 
·Identify any program constraints, such as financial resources, .docx
·Identify any program constraints, such as financial resources, .docx·Identify any program constraints, such as financial resources, .docx
·Identify any program constraints, such as financial resources, .docx
 
·Double-spaced·12-15 pages each chapterThe followi.docx
·Double-spaced·12-15 pages each chapterThe followi.docx·Double-spaced·12-15 pages each chapterThe followi.docx
·Double-spaced·12-15 pages each chapterThe followi.docx
 
© 2019 Cengage. All Rights Reserved. Linear RegressionC.docx
© 2019 Cengage. All Rights Reserved.  Linear RegressionC.docx© 2019 Cengage. All Rights Reserved.  Linear RegressionC.docx
© 2019 Cengage. All Rights Reserved. Linear RegressionC.docx
 

Recently uploaded

POINT- BIOCHEMISTRY SEM 2 ENZYMES UNIT 5.pptx
POINT- BIOCHEMISTRY SEM 2 ENZYMES UNIT 5.pptxPOINT- BIOCHEMISTRY SEM 2 ENZYMES UNIT 5.pptx
POINT- BIOCHEMISTRY SEM 2 ENZYMES UNIT 5.pptxSayali Powar
 
MARGINALIZATION (Different learners in Marginalized Group
MARGINALIZATION (Different learners in Marginalized GroupMARGINALIZATION (Different learners in Marginalized Group
MARGINALIZATION (Different learners in Marginalized GroupJonathanParaisoCruz
 
Solving Puzzles Benefits Everyone (English).pptx
Solving Puzzles Benefits Everyone (English).pptxSolving Puzzles Benefits Everyone (English).pptx
Solving Puzzles Benefits Everyone (English).pptxOH TEIK BIN
 
Interactive Powerpoint_How to Master effective communication
Interactive Powerpoint_How to Master effective communicationInteractive Powerpoint_How to Master effective communication
Interactive Powerpoint_How to Master effective communicationnomboosow
 
History Class XII Ch. 3 Kinship, Caste and Class (1).pptx
History Class XII Ch. 3 Kinship, Caste and Class (1).pptxHistory Class XII Ch. 3 Kinship, Caste and Class (1).pptx
History Class XII Ch. 3 Kinship, Caste and Class (1).pptxsocialsciencegdgrohi
 
Pharmacognosy Flower 3. Compositae 2023.pdf
Pharmacognosy Flower 3. Compositae 2023.pdfPharmacognosy Flower 3. Compositae 2023.pdf
Pharmacognosy Flower 3. Compositae 2023.pdfMahmoud M. Sallam
 
18-04-UA_REPORT_MEDIALITERAСY_INDEX-DM_23-1-final-eng.pdf
18-04-UA_REPORT_MEDIALITERAСY_INDEX-DM_23-1-final-eng.pdf18-04-UA_REPORT_MEDIALITERAСY_INDEX-DM_23-1-final-eng.pdf
18-04-UA_REPORT_MEDIALITERAСY_INDEX-DM_23-1-final-eng.pdfssuser54595a
 
Meghan Sutherland In Media Res Media Component
Meghan Sutherland In Media Res Media ComponentMeghan Sutherland In Media Res Media Component
Meghan Sutherland In Media Res Media ComponentInMediaRes1
 
ECONOMIC CONTEXT - LONG FORM TV DRAMA - PPT
ECONOMIC CONTEXT - LONG FORM TV DRAMA - PPTECONOMIC CONTEXT - LONG FORM TV DRAMA - PPT
ECONOMIC CONTEXT - LONG FORM TV DRAMA - PPTiammrhaywood
 
Full Stack Web Development Course for Beginners
Full Stack Web Development Course  for BeginnersFull Stack Web Development Course  for Beginners
Full Stack Web Development Course for BeginnersSabitha Banu
 
How to Configure Email Server in Odoo 17
How to Configure Email Server in Odoo 17How to Configure Email Server in Odoo 17
How to Configure Email Server in Odoo 17Celine George
 
Historical philosophical, theoretical, and legal foundations of special and i...
Historical philosophical, theoretical, and legal foundations of special and i...Historical philosophical, theoretical, and legal foundations of special and i...
Historical philosophical, theoretical, and legal foundations of special and i...jaredbarbolino94
 
Capitol Tech U Doctoral Presentation - April 2024.pptx
Capitol Tech U Doctoral Presentation - April 2024.pptxCapitol Tech U Doctoral Presentation - April 2024.pptx
Capitol Tech U Doctoral Presentation - April 2024.pptxCapitolTechU
 
call girls in Kamla Market (DELHI) 🔝 >༒9953330565🔝 genuine Escort Service 🔝✔️✔️
call girls in Kamla Market (DELHI) 🔝 >༒9953330565🔝 genuine Escort Service 🔝✔️✔️call girls in Kamla Market (DELHI) 🔝 >༒9953330565🔝 genuine Escort Service 🔝✔️✔️
call girls in Kamla Market (DELHI) 🔝 >༒9953330565🔝 genuine Escort Service 🔝✔️✔️9953056974 Low Rate Call Girls In Saket, Delhi NCR
 
Enzyme, Pharmaceutical Aids, Miscellaneous Last Part of Chapter no 5th.pdf
Enzyme, Pharmaceutical Aids, Miscellaneous Last Part of Chapter no 5th.pdfEnzyme, Pharmaceutical Aids, Miscellaneous Last Part of Chapter no 5th.pdf
Enzyme, Pharmaceutical Aids, Miscellaneous Last Part of Chapter no 5th.pdfSumit Tiwari
 
Incoming and Outgoing Shipments in 1 STEP Using Odoo 17
Incoming and Outgoing Shipments in 1 STEP Using Odoo 17Incoming and Outgoing Shipments in 1 STEP Using Odoo 17
Incoming and Outgoing Shipments in 1 STEP Using Odoo 17Celine George
 
Software Engineering Methodologies (overview)
Software Engineering Methodologies (overview)Software Engineering Methodologies (overview)
Software Engineering Methodologies (overview)eniolaolutunde
 

Recently uploaded (20)

POINT- BIOCHEMISTRY SEM 2 ENZYMES UNIT 5.pptx
POINT- BIOCHEMISTRY SEM 2 ENZYMES UNIT 5.pptxPOINT- BIOCHEMISTRY SEM 2 ENZYMES UNIT 5.pptx
POINT- BIOCHEMISTRY SEM 2 ENZYMES UNIT 5.pptx
 
MARGINALIZATION (Different learners in Marginalized Group
MARGINALIZATION (Different learners in Marginalized GroupMARGINALIZATION (Different learners in Marginalized Group
MARGINALIZATION (Different learners in Marginalized Group
 
Solving Puzzles Benefits Everyone (English).pptx
Solving Puzzles Benefits Everyone (English).pptxSolving Puzzles Benefits Everyone (English).pptx
Solving Puzzles Benefits Everyone (English).pptx
 
Model Call Girl in Tilak Nagar Delhi reach out to us at 🔝9953056974🔝
Model Call Girl in Tilak Nagar Delhi reach out to us at 🔝9953056974🔝Model Call Girl in Tilak Nagar Delhi reach out to us at 🔝9953056974🔝
Model Call Girl in Tilak Nagar Delhi reach out to us at 🔝9953056974🔝
 
Interactive Powerpoint_How to Master effective communication
Interactive Powerpoint_How to Master effective communicationInteractive Powerpoint_How to Master effective communication
Interactive Powerpoint_How to Master effective communication
 
History Class XII Ch. 3 Kinship, Caste and Class (1).pptx
History Class XII Ch. 3 Kinship, Caste and Class (1).pptxHistory Class XII Ch. 3 Kinship, Caste and Class (1).pptx
History Class XII Ch. 3 Kinship, Caste and Class (1).pptx
 
Pharmacognosy Flower 3. Compositae 2023.pdf
Pharmacognosy Flower 3. Compositae 2023.pdfPharmacognosy Flower 3. Compositae 2023.pdf
Pharmacognosy Flower 3. Compositae 2023.pdf
 
18-04-UA_REPORT_MEDIALITERAСY_INDEX-DM_23-1-final-eng.pdf
18-04-UA_REPORT_MEDIALITERAСY_INDEX-DM_23-1-final-eng.pdf18-04-UA_REPORT_MEDIALITERAСY_INDEX-DM_23-1-final-eng.pdf
18-04-UA_REPORT_MEDIALITERAСY_INDEX-DM_23-1-final-eng.pdf
 
Meghan Sutherland In Media Res Media Component
Meghan Sutherland In Media Res Media ComponentMeghan Sutherland In Media Res Media Component
Meghan Sutherland In Media Res Media Component
 
ECONOMIC CONTEXT - LONG FORM TV DRAMA - PPT
ECONOMIC CONTEXT - LONG FORM TV DRAMA - PPTECONOMIC CONTEXT - LONG FORM TV DRAMA - PPT
ECONOMIC CONTEXT - LONG FORM TV DRAMA - PPT
 
Full Stack Web Development Course for Beginners
Full Stack Web Development Course  for BeginnersFull Stack Web Development Course  for Beginners
Full Stack Web Development Course for Beginners
 
TataKelola dan KamSiber Kecerdasan Buatan v022.pdf
TataKelola dan KamSiber Kecerdasan Buatan v022.pdfTataKelola dan KamSiber Kecerdasan Buatan v022.pdf
TataKelola dan KamSiber Kecerdasan Buatan v022.pdf
 
9953330565 Low Rate Call Girls In Rohini Delhi NCR
9953330565 Low Rate Call Girls In Rohini  Delhi NCR9953330565 Low Rate Call Girls In Rohini  Delhi NCR
9953330565 Low Rate Call Girls In Rohini Delhi NCR
 
How to Configure Email Server in Odoo 17
How to Configure Email Server in Odoo 17How to Configure Email Server in Odoo 17
How to Configure Email Server in Odoo 17
 
Historical philosophical, theoretical, and legal foundations of special and i...
Historical philosophical, theoretical, and legal foundations of special and i...Historical philosophical, theoretical, and legal foundations of special and i...
Historical philosophical, theoretical, and legal foundations of special and i...
 
Capitol Tech U Doctoral Presentation - April 2024.pptx
Capitol Tech U Doctoral Presentation - April 2024.pptxCapitol Tech U Doctoral Presentation - April 2024.pptx
Capitol Tech U Doctoral Presentation - April 2024.pptx
 
call girls in Kamla Market (DELHI) 🔝 >༒9953330565🔝 genuine Escort Service 🔝✔️✔️
call girls in Kamla Market (DELHI) 🔝 >༒9953330565🔝 genuine Escort Service 🔝✔️✔️call girls in Kamla Market (DELHI) 🔝 >༒9953330565🔝 genuine Escort Service 🔝✔️✔️
call girls in Kamla Market (DELHI) 🔝 >༒9953330565🔝 genuine Escort Service 🔝✔️✔️
 
Enzyme, Pharmaceutical Aids, Miscellaneous Last Part of Chapter no 5th.pdf
Enzyme, Pharmaceutical Aids, Miscellaneous Last Part of Chapter no 5th.pdfEnzyme, Pharmaceutical Aids, Miscellaneous Last Part of Chapter no 5th.pdf
Enzyme, Pharmaceutical Aids, Miscellaneous Last Part of Chapter no 5th.pdf
 
Incoming and Outgoing Shipments in 1 STEP Using Odoo 17
Incoming and Outgoing Shipments in 1 STEP Using Odoo 17Incoming and Outgoing Shipments in 1 STEP Using Odoo 17
Incoming and Outgoing Shipments in 1 STEP Using Odoo 17
 
Software Engineering Methodologies (overview)
Software Engineering Methodologies (overview)Software Engineering Methodologies (overview)
Software Engineering Methodologies (overview)
 

Genetic analysis of cavefish reveals molecular convergencein.docx

  • 1. Genetic analysis of cavefish reveals molecular convergence in the evolution of albinism Meredith E Protas1, Candace Hersey2, Dawn Kochanek3, Yi Zhou2, Horst Wilkens4, William R Jeffery5, Leonard I Zon2, Richard Borowsky3 & Clifford J Tabin1 The genetic basis of vertebrate morphological evolution has traditionally been very difficult to examine in naturally occurring populations. Here we describe the generation of a genome-wide linkage map to allow quantitative trait analysis of evolutionarily derived morphologies in the Mexican cave tetra, a species that has, in a series of independent caves, repeatedly evolved specialized characteristics adapted to a unique and well-studied ecological environment. We focused on the trait of albinism and discovered that it is linked to Oca2, a known pigmentation gene, in two cave populations. We found different deletions in Oca2 in each population and, using a cell-based assay, showed that both cause loss of function of the corresponding protein, OCA2. Thus, the two cave populations evolved albinism independently, through similar mutational events. The relatively closed, often nutrient-poor, and lightless environment of caves represents a marked change in ecological conditions to which several entrapped species have adapted. Obligate cave-dwelling ani- mals, called troglobites or troglodytes, are characterized by a remark- able convergence of eye and pigment loss across diverse species such as
  • 2. spiders, isopods, salamanders and fish1. There are 86 known troglodytic species of fish2. The best studied is the Mexican tetra, identified by some authors as Astyanax mexicanus and others as Astyanax fasciatus; the two names should be considered synonymous in the present context and the species will be referred to herein as Astyanax. This species has 29 cave populations in the karst region of the Sierra de El Abra of northeast Mexico and one additional population in Guerrero (Fig. 1a)3,4. A surface, or river- dwelling, sister population of the cave morph lives in southern Texas and northeastern Mexico and can still interbreed with the cave morph. Phenotypically, the cave and surface morphs are very different; among other char- acteristics, the cave morph has a greater weight per unit length, less pigment, regressed eyes, larger nostrils, more maxillary teeth, more cranial neuromasts and more taste buds, as well as differences in feeding, schooling and aggressive behaviors (Fig. 1b–d)4,5. Molecular phylogenetic studies indicate that several cave populations indepen- dently evolved these characteristics6–8. To provide a framework in which to study the genetics of this
  • 3. species, we made a microsatellite linkage map. We have isolated and Rio Sabinas Rio Frio Molinoa b c d Pachón Pachón Japonés Ciudad Valles kilometers 0 5 10 15 Ciudad Mante N Surface Molino R io
  • 6. Astyanax mexicanus. (a) Map of the area in Mexico where the different cave populations are found. Dots represent cave populations. Caves with red dots are Molino, Pachón and Japonés, all of which contain a majority of albino individuals. Inset map at bottom shows the location of the region within Mexico. (b) A representative surface fish. (c) A representative Molino cavefish. (d) A representative Pachón cavefish. Received 20 July; accepted 13 October; published online 11 December 2005; doi:10.1038/ng1700 1Department of Genetics, Harvard Medical School, Boston, Massachusetts 02115, USA. 2Children’s Hospital Stem Cell Program, Department of Hematology/Oncology, Howard Hughes Medical Institute, Children’s Hospital Boston, Boston, Massachusetts 02115, USA. 3Cave Biology Research Group, Department of Biology, New York University, 1009 Main, 100 Washington Square East, New York, New York 10003, USA. 4Zoological Institute and Zoological Museum, University of Hamburg, Martin- Luther-King-Platz 3, 20146 Hamburg, Germany. 5Department of Biology, University of Maryland, College Park, Maryland 20742, USA. Correspondence should be addressed to C.J.T. ([email protected]). NATURE GENETICS VOLUME 38 [ NUMBER 1 [ JANUARY
  • 7. 2006 107 L E T T E R S © 2 0 0 6 N a tu re P u b lis h in g G ro u p h
  • 9. designed primers corresponding to over 600 microsatellites. Using a backcross from the Molino cave population with 111 progeny, we obtained 35 linkage groups composed of 267 markers, out of 300 markers genotyped, with a coverage of 1,916 cM (Fig. 2 and Supplementary Table 1 online). Astyanax has 25 chromosomes, sug- gesting that with the addition of more markers, some of the linkage groups would collapse. We are also genotyping a larger F2 cross from another cave, Pachón, which should coalesce some of the linkage groups and allow for comparisons between the two cave populations. We identified a number of statistically significant, quantitative loci for different traits present in the cave form, most of which will be described elsewhere. Here we focus on one such trait, albinism. Previous genetic studies have indicated that albinism in the Pachón cave is caused by a single recessive mutation9,10. In the Molino backcross, albinism mapped to a single locus in linkage group 16 with a LOD score of 17.29 at microsatellite marker 218E, accounting for 49.4% of the variance in this trait (Fig. 3a). A similar analysis of the Pachón F2 cross mapped the locus for albinism to the same location with a LOD score of 17.98 at marker 218E, accounting for
  • 10. 42.6% of the variance in this trait (data not shown). This coincidence of loci responsible for albinism raises the following three possibilities: the two cave populations could have the same mutation in the same gene, different mutations in the same gene or mutations in distinct but closely linked genes. To address the latter possibility, we performed a complementation test between a Molino individual and a Pachón individual, which yielded only albino offspring (Fig. 3b). Thus, albinism in these two cave populations is caused by mutations in the same gene. To identify the gene responsible for albinism in Astyanax, we genotyped individuals of the Molino backcross for a series of candi- date genes, based on known albinism loci in mouse and humans: tyrosinase (Tyr), tyrosinase-related protein-1 (Tyrp1) and ocular and cutaneous albinism-2 (Oca2) (Fig. 2). One of these genes, Oca2, mapped to the albino locus and increased the LOD score in the Molino backcross to 68.6 (Fig. 3c), now accounting for 93.1% of the variance of this trait, and the LOD score in the Pachón F2 cross to 60.66, now accounting for 71.6% of the variance of this trait (data not shown). Furthermore, there is a perfect association between the genotype of the Oca2 marker and the phenotype of albinism in all successfully genotyped individuals of both the Molino
  • 11. backcross (105 individuals) and the Pachón F2 cross (215 individuals). Although the function of Oca2 is unknown, it is the most commonly mutated gene in cases of human albinism11 and is also responsible for pigmentation phenotypes in mouse and medaka12,13. To test whether Oca2 mutations are responsible for albinism in cavefish, and, more importantly, to identify the specific genetic lesions in Oca2 responsible for albinism, we compared the sequence of the Oca2 cDNA in surface, Pachón and Molino individuals (Supplementary Fig. 1 online). We found numerous differences in the Oca2 sequences present in the two cave populations as compared to their surface counterparts (Fig. 4a and Supplementary Fig. 1). The Pachón cave population had three polymorphisms that could affect Oca2 function: two were amino acid changes in conserved residues, and the last was a deletion extending from within intron 23 through most of exon 24, such that the cDNA includes part of intron 23 fused to the last nine base pairs of exon 24 and the 3¢ UTR (Fig. 4a and Supplementary Fig. 1). The Molino cave population had only one major difference: exon 21 was missing (Fig. 4a and Supplementary Fig. 1).
  • 12. The missing exons observed in the Molino and Pachón Oca2 sequence could, in principle, be explained by either alterations in splicing or deletions of genomic DNA. Amplifying from genomic DNA, we found that in both cases, the observed losses of exonic sequence in the Molino and Pachón Oca2 cDNAs were attributable to genomic deletions (Supplementary Fig. 2 online). 24 206A 209E0 18 6 0 103A 219A 207F 11 6 0 15A 232A 231C 11 0
  • 13. 129B 43A 32 33 34 35 113 33b 95 90 213E 237A 213F82 80 73 66 30C 26A 105B 43C54 50 44 218E 132B 34 205E 210A 9
  • 17. 47 109C 119A52 66 113C 139B23 12 10 6 0 207A 228E227D 103C 203A 47 115C 15C35 30 27 19 228D 42A 139A 220E0 42 40 31 21
  • 18. 0 219B 111B 109B 219E 226B 49 105A 223C 229B 21 16 7 0 235D 119B 58 3c 47 3B 127B35 16 8C 133C0 51 43 37 17C 214A
  • 19. 211E 143A0 0 16 24 232C 207E234C 220A 38 30 18 0 230E 5C 132A 237B 0 3 6 10 210B 216E 237F 230C 22 9
  • 20. 0 225A 239e 204D 31302928272625242322212019181716 Oca2 Tyrp1 Tyr 0 237E 0 0 0 0 0 0 0 0 0 0 0 0 0 0 123C 135C 211B 235B 241B 224F 217E 240E
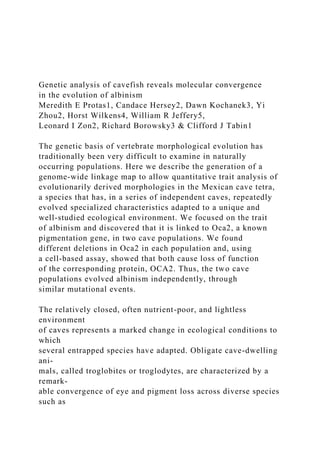
  • 31. Figure 2 Microsatellite linkage map of Astyanax mexicanus. The names of the microsatellite markers are to the right of each linkage group and the positions of the markers (in cM) are on the left. Markers in three genes (Oca2, Tyr and Tyrp1) are labeled in red. 108 VOLUME 38 [ NUMBER 1 [ JANUARY 2006 NATURE GENETICS L E T T E R S © 2 0 0 6 N a tu re P u b lis h in g G
  • 33. n e tic s To test whether the polymorphisms in the cave populations’ Oca2 sequences cause albinism through loss of function of Oca2, we used the melan-p cell line, which is a melanocyte cell line generated from an Oca2-deficient mouse14. We made constructs expressing wild- type surface-fish Oca2 and surface-fish Oca2 modified with each of the cavefish polymorphisms driven by the human ubiquitin promoter. We first transfected the surface-fish Oca2 construct to ascertain whether wild-type Astyanax Oca2 could complement Oca2 function in mouse cells. Indeed, melan-p cells transfected with the surface-fish Oca2 showed high levels of pigmentation (Fig. 4b–d). We then transfected cells with constructs encoding the different amino acid substitutions seen in the Pachón cave. Both point mutations caused rescue of pigmentation (Fig. 4e–j). However, neither the deletion found in the Molino cave nor the deletion found in the Pachón cave caused rescue
  • 34. of pigmentation (Fig. 4k–p). Therefore, the deletions cause loss of function of OCA2, whereas the two point mutations do not drastically affect the function of OCA2 in this cell line, strongly suggesting that the exon 21 deletion is the mutation that causes albinism in the Molino cave population and the exon 24 deletion is the mutation that causes albinism in the Pachón population. The identification of different inactivating mutations in Oca2 in the Molino and Pachón populations suggests that albinism evolved independently in these two caves, by convergent evolution in the same gene. The independent evolution of Oca2 in the two caves is further supported by analysis of amino acid changes and neutral base changes; these polymorphisms do not group the Molino and Pachón populations together to the exclusion of the surface population (Supplementary Table 2 online). We also examined another cave popula- tion, Japonés, that contains albino indivi- duals (Fig. 1a). In a complementation test between an albino Japonés individual and an albino Pachón individual, only albino off- spring resulted, suggesting that albinism in the Japonés population also arose through mutations in the Oca2 gene (data not shown). Sequencing of Oca2 from one albino Japonés individual showed that neither the Molino nor the Pachón deletion was present
  • 35. (data not shown), though the two point mutations found in the Pachón cave were found. Together with the complementation data, this result suggests that a third, inde- pendent mutation in the Oca2 gene, perhaps in a regulatory sequence, is responsible for the convergent albinism phenotype in the Japonés cave. The parallel evolution of loss of pigmenta- tion and loss of eyes within the species Astyanax is mirrored in many other cave dwelling organisms. The most debated issue about cave animals is why this loss of eyes and pigmentation occurs. There are three main theories1,8,9,15. First, the genes respon- sible for structures or pathways that are not advantageous in a dark environment, such as eyes or pigmentation, might accumulate dele- terious mutations and, over time, completely degenerate. Second, it might be advantageous to lose eyes and pigmentation to conserve the energy or space that these structures con- sume. Third, the genetic changes that cause loss of eye and pigmenta- tion might cause changes in other structures or pathways that might be advantageous in the cave environment. The identification of the mutations responsible for loss of pigmen- tation in Astyanax allows us to consider the molecular nature of the variation facilitating this change in response to the cave environment.
  • 36. It is notable that Oca2 has repeatedly mutated in the cave populations we examined. It is possible that in the cave environment, loss of Oca2 function is actually advantageous, for some as yet unknown reason. Alternatively, Oca2 might be mutated more often than other pigmen- tation pathway genes in Astyanax simply because Oca2 mutations do not seem to have any deleterious effects aside from loss of pigmenta- tion and problems with vision. It is possible that some of the other pigmentation genes have more pleiotropic effects and that those mutations are not as viable; for example, all of the mutations in zebrafish Tyr that cause complete loss of pigmentation are only semiviable16. A final explanation is that Oca2 is the most frequently targeted pigmentation gene in Astyanax for the same reasons that it seems to be in humans: first, Oca2 presents a very large target size for mutagenesis, being 345 kb in humans, with 24 exons11. Second, human Oca2 maps to a region characterized by repetitive sequences, which are often associated with chromosomal rearrangements and deletions17. Although it is not yet known whether the Astyanax Oca2 locus is similarly characterized by a large size and a large number of associated repeat sequences, the most parsimonious explanation seems to be a combination of a lack of deleterious pleiotropic effects in
  • 37. conjunction with the structure of Oca2 itself. These sorts of features may, in general, predispose certain loci to be targets for evolutionary 80 Molino backcross Molino backcross 70 60 50 L O D 40 30 20 10 0 80 70 60 50
  • 38. L O D 40 30 20 10 0 0 2 2 0 5 E 1 2 8 1 4 3 1 2 6 A 2 2 2 3 2 2 1 2 4 3 1 2 6 1 3 1 7 3 EA
  • 39. 3 F A 2 2 2 3 3 B 0 5 B 0 C 3 C8 3 1 E 2 B 1 0 5 E 0 a 3 B
  • 40. 1 3 1 3 7 3 A EF 3 0 0 C C 5 B 3 2 B E 1 0 a 20 40 60 cM LG 16 LG 16 80 100 120 0 20 40 60 cM 80 100 120 O c a 2 Molino × Pachón a
  • 41. b c Figure 3 Oca2 is linked to albinism in both the Pachón and Molino cave populations. (a) The albino locus in the Molino backcross is in linkage group (LG) 16. The LOD score is plotted against the distance (in cM) across this linkage group. (b) An albino Pachón � Molino hybrid, showing noncomplementation. (c) The marker in Oca2 is located at the albino locus in the Molino backcross and its inclusion in the analysis greatly increases the LOD score. NATURE GENETICS VOLUME 38 [ NUMBER 1 [ JANUARY 2006 109 L E T T E R S © 2 0 0 6 N a tu re
  • 43. o m /n a tu re g e n e tic s forces effecting morphological change. The existence of at least 86 species of cavefish2, a subset of which show albinism, will allow for further examination of the parallel evolution of this trait in the cave environment. We have seen that albinism has evolved in two different cave populations through independent changes in the same gene. Other studies have also shown that one gene is responsible for the same morphological change in multiple populations or species: ectodyspla-
  • 44. sin (Eda) in body armor and Pitx1 in pelvic reduction in the three- spine stickleback18,19, ovo (shaven-baby) in trichome loss in different drosophilids20, and MC1R in pigmentation in pocket mice, jaguars and several avian species21,22. Thus, the same morphology often evolves by mutation in the same gene, possibly because it is the most efficient or best way for a certain phenotype to evolve. Another issue often discussed regarding the evolution of morpho- logical change is whether coding changes or regulatory changes generate new traits. Regulatory mutations have an advantage as agents of morphological change in that they can alter a gene’s activity in a subset of the regions in which it is expressed. Regulatory mutations have been identified or implicated in morphological change in plate armor and pelvic reduction in sticklebacks18,19, wing-spot pigmenta- tion in Drosophila biarmipes23, muscle mass in pigs24 and trichome loss in drosophilids20. Often it is difficult to confirm that a gene has a specific regulatory mutation, as these mutations can span large areas of sequence. In contrast, coding differences are easier to find. It is notable that many of the examples of evolutionary change involving coding mutations that have previously been described, including our
  • 45. example of Oca2 in albinism in Astyanax, involve overall changes in pigmentation21,22. This could be because pleiotropic effects of pig- mentation genes are minimal and usually do not affect the viability of the organism. We have identified specific genetic lesions responsible for the parallel evolution of albinism in different cave populations of Astya- nax, and found that they represent convergent genetic events in separate populations. The genetic tools we have developed will facilitate further investigation into the molecular bases for the evolu- tion of specialized morphological characteristics in the unique and well-studied cave environment. METHODS Crosses. We used five crosses in this study: a Molino backcross, a Pachón F2 cross, a Pachón backcross, a Molino � Pachón complementation cross and a Pachón � Japonés complementation cross (see Supplementary Methods online). Microsatellite identification. To make a genomic library, we digested genomic surface-fish DNA with Sau3AI and cloned fragments of 500– 700 bp into BamH1-linearized pBluescriptSK+ (Stratagene). We then
  • 46. electroporated the library into SURE electroporation-competent cells (Stratagene). A 32P- or digoxigenin-end-labeled (CA)12 probe was used to hybridize colony lifts and colonies hybridizing to the probe were sequenced using T3 and T7 primers. Primers to detect microsatellites that had ten or more repeats were designed using Primer3. The following tag sequence was added to the 5¢ end of every forward primer: 5¢-CACGACGTTGTAAAACGAC-3¢ (Y.Z. and L.I.Z., unpublished data). Genotyping and linkage map construction. We genotyped 111 individuals for 300 microsatellite markers in the Molino backcross and 235 indi- viduals with 254 microsatellites in the Pachón F2 cross. PCR reactions were 10 ml in volume and contained 0.1 mM MgCl2, 6 mM Tris-HCl, pH 8.3, 30 mM KCl, 0.006% glycerol, 0.25 mM dNTP mix (Roche), 0.06% Tween, 0.06% Nonidet P-40, 0.25 units of Taq DNA polymerase
  • 47. (Roche), 5 nM forward primer, 200 nM reverse primer and 200 nM of the fluorescent tag primer 5¢-CACGACGTTGTAAAACGAC-3¢ labeled with one of two phosphoramidite conjugates, Hex and Fam, using a PCR program as described25. Each PCR reaction was primed with the specific forward primer. The majority of cycles used the forward primer in excess—the fluorescently labeled tag (Y.Z. and L.I.Z., unpublished data). Three Fam-labeled PCR products and three Hex-labeled PCR products were pooled and run on an ABI 3700 with GeneScan-500 ROX size standard (Applied Biosystems). Genotyper software (version 3.6) was used to analyze the genotyping results. The program JoinMap was used to make the microsatellite linkage map using the Kosambi mapping function, a jump threshold of 5.0 and Surface Oca2 Pachón Oca2
  • 48. Molino Oca2 a b c f i l o e h k n d g j m p Figure 4 Different Oca2 exon deletions in the Molino population and
  • 49. the Pachón population cause loss of function of the OCA2 protein. (a) Schematics of the surface, Pachón and Molino Oca2 coding regions. Asterisks in the Pachón Oca2 represent changes in conserved amino acid residues: red asterisk, methionine to valine; blue asterisk, proline to serine (see Supplementary Figs. 1 and 2). In the Pachón coding sequence, exon 24 is almost completely deleted. Following exon 23 are additional sequence (intron 23), the last few amino acids of exon 24, and the 3¢ UTR. The Molino coding sequence is identical to that of the surface-fish Oca2 except that exon 21 is missing. (b–d) Transfection of the unmodified surface-fish Oca2 construct results in highly pigmented cells. (e–g) Transfection of the construct encoding the methionine-to-valine substitution, found in the Pachón cave, results in pigmented cells, although they are slightly less pigmented than the cells transfected with the surface-fish
  • 50. sequence. (h–j) Transfection of the construct encoding the proline-to- serine substitution results in highly pigmented cells. (k–p) Transfection of the construct with the extra intron 23 sequence and exon 24 deletion (k–m) or the construct with the exon 21 deletion (n–p) does not rescue pigmentation. b,e,h,k,n show bright-field pictures of the melan- p cell line transfected with different constructs; c,f,i,l,o show the corresponding transfected cells visualized by fluorescence (all constructs were co-injected with pUB-GFP26); and d,g,j,m,p provide schematics of the constructs transfected in each experiment. 110 VOLUME 38 [ NUMBER 1 [ JANUARY 2006 NATURE GENETICS L E T T E R S © 2 0 0
  • 52. .n a tu re .c o m /n a tu re g e n e tic s a ripple function. For the Molino backcross, 267 of 300 markers were grouped into 35 linkage groups using a LOD threshold of 4.0. QTL mapping. We used the interval mapping function of MapQTL26 to
  • 53. determine the albino locus and determined significant LOD scores using a permutation test. Cloning and mapping of albinism candidate genes. We obtained fragments of Astyanax Tyr, Trp1 and Oca2 by degenerate PCR. For primers and specifics, see Supplementary Methods. The fragment that we initially amplified by degen- erate PCR of Oca2 contained exons 11–23. We were able to amplify exon 1 of Oca2 from the DNA of surface fish by designing primers to the area of exon 1 that is most conserved between zebrafish and fugu. Using a forward primer in exon 1, 5¢-GAGCCCAGGGTCATCAGG-3¢, we obtained the sequence through exon 11. To obtain the 5¢ and 3¢ ends, we used the SMART Race cDNA kit (Clontech). Genomic analysis of missing Oca2 exons in Pachón and Molino populations. We carried out PCR to exons 21 and exons 14 for genomic DNA from all individuals of the Molino backcross using the following
  • 54. primers: exon 21F, exon 21R, exon 14F and exon 14R (see Supplementary Table 1 online for all primer sequences). For the Pachón backcross, we amplified intron 23 and exon 24 to the 3¢ untranslated region using the following primers: intron 23F, intron 23R, exon 24F and 3¢ UTR. Sequencing of full-length Oca2 coding region for Surface, Molino and Pachón fish. We extracted RNA from fin clips and whole fish using Trizol (Invitrogen), and we made cDNA using AMV reverse transcriptase (Roche). To amplify the full-length cDNA, we used primers from the 5¢ and 3¢ untranslated regions of Oca2. In some cases, we amplified Oca2 in two pieces for ease of amplification, using a reverse primer in exon 12 and a forward primer in exon 10. We compared Oca2 sequences from five surface fish, five Molino fish and two Pachón fish. Making overexpression constructs. We cloned surface, Molino and Pachón
  • 55. full-length sequences into pGEM-T Easy (Promega). We cloned the missing exon 21 (Molino) and missing exon 24 plus extra sequence (Pachón) cloned into the surface-fish construct using MluI and SmaI. pUB- GFP26, a vector that encodes GFP under the control of the human ubiquitin promoter, was used as the backbone for the overexpression constructs. pUB-GFP was blunted with SmaI and MscI, removing the GFP, and pGEM-T Easy surface- fish Oca2, surface-fish Oca2 minus exon 21 and surface-fish Oca2 minus exon 24 were blunted with PvuII. The different Oca2 fragments and the pUB fragment were ligated together (Takara), putting surface-fish Oca2 under the control of the ubiquitin promoter. To make the point mutations found in the Pachón cave, we carried out site-directed mutagenesis using the QuikChange site directed mutagenesis kit (Stratagene) on the pUB-surface Oca2 construct.
  • 56. Cell line assay. We obtained melan-p cells from D. Bennett’s group and cultured them as described14. We then transfected the cells on 3-cm plates using Fugene (Roche) and 1 mg of each construct. The transfections were as follows: pUB-GFP alone26, pUB-GFP with pUB-surface Oca2, pUB-GFP with pUB-surface minus exon 21, pUB-GFP with pUB surface minus exon 24 and the proline-to-serine amino acid substitution, pUB-GFP with pUB-surface Oca2 with the methionine-to-valine substitution, and pUB-GFP with pUB- surface Oca2 with the proline-to-serine substitution. After transfection, we waited 4 d for pigmentation to develop. Accession numbers. GenBank: A. mexicanus microsatellite markers, BV678703–BV678968; A. mexicanus Oca2, DQ232591. Note: Supplementary information is available on the Nature Genetics website. ACKNOWLEDGMENTS This work was supported by US National Science Foundation
  • 57. grant IBN0217178 to R. Borowsky and C.J. Tabin. The authors thank L. Mekios for phenotyping and fish maintenance, the Bennett group for the use of the melan-p cell line, T. Matsuda for the pUB-GFP construct, R.C. Albertson for critical reading of the manuscript, and C. Peichel, R.V. Pearse II, J.L. Galloway and J. Rivera-Feliciano for help and advice. COMPETING INTERESTS STATEMENT The authors declare that they have no competing financial interests. Published online at http://www.nature.com/naturegenetics/ Reprints and permissions information is available online at http://npg.nature.com/ reprintsandpermissions/ 1. Culver, D.C. Cave Life (Harvard University, Cambridge, 1982). 2. Romero, A. & Paulson, K.M. It’s a wonderful hypogean life: a guide to the troglomorphic fishes of the world. Environ. Biol. Fishes 62, 13–41 (2001). 3. Espinasa, L., Rivas-Manzano, P. & Perez, H. A new blind cave fish population of genus Astyanax: geography, morphology and behavior. Environ. Biol. Fishes 62, 339–344 (2001).
  • 58. 4. Wilkens, H. Evolution and genetics of epigean and cave Astyanax (Characidae, Pisces). Evol. Biol. 23, 271–367 (1988). 5. Yamamoto, Y., Espinasa, L., Stock, D.W. & Jeffery, W.R. Development and evolution of craniofacial patterning is mediated by eye-dependent and - independent processes in the cavefish Astyanax. Evol. Dev. 5, 435–446 (2003). 6. Dowling, T.E., Martasian, D.P. & Jeffery, W.R. Evidence for multiple genetic forms with similar eyeless phenotypes in the blind cavefish, Astyanax mexicanus. Mol. Biol. Evol. 19, 446–455 (2002). 7. Strecker, U., Bernatchez, L. & Wilkens, H. Genetic divergence between cave and surface populations of Astyanax in Mexico (Characidae, Teleostei). Mol. Ecol. 12, 699–710 (2003). 8. Strecker, U., Faundez, V.H. & Wilkens, H. Phylogeography of surface and cave Astyanax (Teleostei) from Central and North America based on cytochrome b sequence data. Mol. Phylogenet. Evol. 33, 469–481 (2004). 9. Borowsky, R. & Wilkens, H. Mapping a cave fish genome: polygenic systems and regressive evolution. J. Hered. 93, 19–21 (2002). 10. Sadoglu, P. & McKee, A. A second gene that effects eye and body color in Mexican blind cave fish. J. Hered. 60, 10–14 (1969).
  • 59. 11. Oetting, W.S., Garrett, S.S., Brott, M. & King, R.A. P gene mutations associated with oculocutaneous albinism type II (OCA2). Hum. Mutat. 25, 323 (2005). 12. Fukamachi, S. et al. Conserved function of medaka pink- eyed dilution in melanin synthesis and its divergent transcriptional regulation in gonads among vertebrates. Genetics 168, 1519–1527 (2004). 13. Rinchik, E.M. et al. A gene for the mouse pink-eyed dilution locus and for human type II oculocutaneous albinism. Nature 361, 72–76 (1993). 14. Sviderskaya, E.V. et al. Complementation of hypopigmentation in p-mutant (pink-eyed dilution) mouse melanocytes by normal human P cDNA, and defective complementation by OCA2 mutant sequences. J. Invest. Dermatol. 108, 30–34 (1997). 15. Jeffery, W.R. Adaptive evolution of eye degeneration in the Mexican blind cavefish. J. Hered. 96, 185–196 (2005). 16. Page-McCaw, P.S. et al. Retinal network adaptation to bright light requires tyrosinase. Nat. Neurosci. 7, 1329–1336 (2004). 17. Yi, Z. et al. A 122.5-kilobase deletion of the P gene underlies the high prevalence of oculocutaneous albinism type 2 in the Navajo population. Am. J. Hum. Genet. 72,
  • 60. 62–72 (2003). 18. Colosimo, P.F. et al. Widespread parallel evolution in sticklebacks by repeated fixation of Ectodysplasin alleles. Science 307, 1928–1933 (2005). 19. Shapiro, M.D. et al. Genetic and developmental basis of evolutionary pelvic reduction in threespine sticklebacks. Nature 428, 717–723 (2004). 20. Sucena, E., Delon, I., Jones, I., Payre, F. & Stern, D.L. Regulatory evolution of shavenbaby/ovo underlies multiple cases of morphological parallelism. Nature 424, 935–938 (2003). 21. Majerus, M.E. & Mundy, N.I. Mammalian melanism: natural selection in black and white. Trends Genet. 19, 585–588 (2003). 22. Mundy, N.I. A window on the genetics of evolution: MC1R and plumage colouration in birds. Proc. Biol. Sci. 272, 1633–1640 (2005). 23. Gompel, N., Prud’homme, B., Wittkopp, P.J., Kassner, V.A. & Carroll, S.B. Chance caught on the wing: cis-regulatory evolution and the origin of pigment patterns in Drosophila. Nature 433, 481–487 (2005). 24. Van Laere, A.S. et al. A regulatory mutation in IGF2 causes a major QTL effect on muscle growth in the pig. Nature 425, 832–836 (2003). 25. Peichel, C.L. et al. The genetic architecture of divergence between three spine
  • 61. stickleback species. Nature 414, 901–905 (2001). 26. Matsuda, T. & Cepko, C.L. Electroporation and RNA interference in the rodent retina in vivo and in vitro. Proc. Natl. Acad. Sci. USA 101, 16–22 (2004). NATURE GENETICS VOLUME 38 [ NUMBER 1 [ JANUARY 2006 111 L E T T E R S © 2 0 0 6 N a tu re P u b lis h in g G
  • 63. n e tic s Reproduced with permission of the copyright owner. Further reproduction prohibited without permission. 23. W. K. Kroeze, D. J. Sheffler, B. L. Roth, J. Cell Sci. 116, 4867–4869 (2003). 24. J. S. Gutkind, Sci. STKE 2000, re1 (2000). 25. M. J. Marinissen, J. S. Gutkind, Trends Pharmacol. Sci. 22, 368–376 (2001). Acknowledgments: We thank the anonymous reviewers for their thoughtful and insightful critiques, which substantively improved this manuscript. Supported by the Singapore University of Technology and Design–Massachusetts Institute of Technology International Design Center (IDG31300103) and by Natural Sciences and Engineering Research Council (Discovery Grant 125517855). Supplementary Materials www.sciencemag.org/content/343/6177/1373/suppl/DC1 Materials and Methods
  • 64. Figs. S1 to S4 Tables S1 and S2 References (26–70) 18 June 2013; accepted 31 January 2014 10.1126/science.1242063 Fossilized Nuclei and Chromosomes Reveal 180 Million Years of Genomic Stasis in Royal Ferns Benjamin Bomfleur,1* Stephen McLoughlin,1* Vivi Vajda2 Rapidly permineralized fossils can provide exceptional insights into the evolution of life over geological time. Here, we present an exquisitely preserved, calcified stem of a royal fern (Osmundaceae) from Early Jurassic lahar deposits of Sweden in which authigenic mineral precipitation from hydrothermal brines occurred so rapidly that it preserved cytoplasm, cytosol granules, nuclei, and even chromosomes in various stages of cell division. Morphometric parameters of interphase nuclei match those of extant Osmundaceae, indicating that the genome size of these reputed “living fossils” has remained unchanged over at least 180 million years—a paramount example of evolutionary stasis. R oyal ferns (Osmundaceae) are a basal group of leptosporangiate ferns that have undergone little morphological and an- atomical change since Mesozoic times (1–6). Well-preserved fossil plants from 220-million- year-old rocks already exhibit the distinctive ar-
  • 65. chitecture of the extant interrupted fern (Osmunda claytoniana) (2), and many permineralized os- mundaceous rhizomes from the Mesozoic are practically indistinguishable from those of mod- ern genera (3–5) or species (6). Furthermore, with the exception of one natural polyploid hybrid (7), all extant Osmundaceae have an invariant and unusually low chromosome count (7, 8), sug- gesting that the genome structure of these ferns may have remained unchanged over long periods of geologic time (8). To date, evidence for evo- lutionary conservatism in fern genomes has been exclusively based on studies of extant plants (9, 10). Here, we present direct paleontological evidence for long-term genomic stasis in this family in the form of a calcified osmundaceous rhizome from the Lower Jurassic of Sweden with pristinely preserved cellular contents, including nuclei and chromosomes. The specimen was collected from mafic vol- caniclastic rocks [informally named the “Djupadal formation” (11)] at Korsaröd near Höör, Scania, Sweden [fig. S1 of (12)]. Palynological analysis in- dicates an Early Jurassic (Pliensbachian) age for these deposits (11) (fig. S2), which agrees with radiometric dates obtained from nearby volcanic necks (13) from which the basaltic debris originated. The fern rhizome was permineralized in vivo by calcite from hydrothermal brines (11, 14) that per- 1Department of Palaeobiology, Swedish Museum of Natural History, Post Office Box 50007, SE-104 05 Stockholm, Sweden. 2Department of Geology, Lund University, Sölvegatan 12,
  • 66. SE-223 62 Lund, Sweden. *Corresponding author. E-mail: [email protected] nrm.se (B.B.); [email protected] (S.M.) Fig. 1. Cytologicalfeaturespreservedintheapicalregion of the Korsaröd fern fossil. (A) transverse section through the rhizome; (B) detail of radial longitudinal section showing typical pith-parenchyma cells with preserved cell membranes (arrow), cytoplasm and cytosol particles, and interphase nuclei with prominent nucleoli; (C) interphase nucleus with nucleolus and intact nuclear membrane; (D) early prophase nucleus with condensing chromatin and disintegrating nucleolus and nuclear membrane; (E and F) late prophase cells with coiled chromosomes and with nucleolus and nuclear membrane completely disintegrated; (G and H) prometaphase cells showing chromosomes aligning at the equator of the nucleus; (I and J) possible anaphase cells showing chromosomes at- tenuated toward opposite poles. (A), (C to E), (G), and (I) are from NRM S069656. (B), (F), (H), and (J) are from NRM S069658. Scale bars: (A) 500 mm; (B) 20 mm; (C to J) 5 mm. 21 MARCH 2014 VOL 343 SCIENCE www.sciencemag.org1376 REPORTS o n F e b ru a ry
  • 69. e n ce m a g .o rg D o w n lo a d e d f ro m http://www.sciencemag.org/ http://www.sciencemag.org/ colated through the coarse-grained sediments short- ly after deposition (table S1). The fossil is 6 cm long and 4 cm wide and consists of a small (~7 mm diameter) central stem surrounded by a dense man-
  • 70. tle ofpersistentfrondbaseswithinterspersed rootlets (Fig. 1). Its complex reticulate vascular cylinder (ectophloic dictyoxylic siphonostele), parenchym- atous pith and inner cortex, and thick fibrous outer cortex are characteristic features of Osmundaceae (1, 3–5, 12) (fig. S3). Moreover, the frond bases mantling the rhizome contain a heterogeneous scle- renchyma ring that is typical of extant Osmunda sensu lato (1, 3, 4, 12) (fig. S4). The presence of a single root per leaf trace favors affinities with (sub)genus Osmundastrum (1, 3, 6, 12). The specimen is preserved in exquisite sub- cellular detail (Fig. 1 and figs. S4 and S5). Pa- renchyma cells in the pith and cortex show preserved cell contents, including membrane- bound cytoplasm, cytosol granules, and possible amyloplasts (Fig. 1 and fig. S5). Most cells con- tain interphase nuclei with conspicuous nucleoli (Fig. 1, figs. S4 and S5, and movies S1 and S2). Transverse and longitudinal sections through the apical part of the stem also reveal sporadic dividing parenchyma cells, mainly in the pith periphery (Fig. 1). These are typically preserved in prophase or telophase stages, in which the nucleolus and nu- clear envelope are more or less unresolved and the chromatin occurs in the form of diffuse, granular material or as distinct chromatid strands. A few cells contain chromosomes that are aligned at the equator of the nucleus, indicative of early meta- phase, and two cells were found to contain chromo- somes that appear to be attenuated toward opposite poles, representing possible anaphase stages. Some tissue portions in the stem cortex and the outer leaf bases show signs of necrosis and pro-
  • 71. grammed cell death (fig. S6). Such fine subcellular detail has rarely been documented in fossils (15–17) because the chances for fossilization of delicate organelles are small (16) and their features are commonly ambiguous (17). The consistent distribution and architec- ture of the cellular contents in the Korsaröd fern fossil resolved via light microscopy (Fig. 1 and fig. S4), scanning electron microscopy (fig. S5), and synchrotron radiation x-ray tomographic microscopy (SRXTM) (fig. S5 and movies S1 and S2) provide unequivocal evidence for three- dimensionally preserved organelles. Positive scaling relationships rooted in DNA content can be used to extrapolate relative ge- nome sizes and ploidy levels of plants (18–21). We measured minimum and maximum diame- ters, perimeters, and maximum cross-sectional areas of interphase nuclei in pith and cortical parenchyma cells of the fossil and of its extant relative Osmundastrum cinnamomeum. The mea- surements match very closely (Fig. 2), with mean nuclear perimeters of 32.2 versus 32.6 mm and mean areas of 82.2 versus 84.9 mm2 in the fossil and in extant Osmundastrum, respectively. The equivalent nuclear sizes demonstrate that the Korsaröd fern fossil and extant Osmundaceae likely share the same chromosome count and DNA content, and thus suggest that neither ploidization events nor notable amounts of gene loss have occurred in the genome of the royal ferns since the Early Jurassic ~180 million years ago [(8), see also discussion in (9, 10)]. These results, in
  • 72. concert with morphological and anatomical evi- dence (1–6), indicate that the Osmundaceae rep- resents a notable example of evolutionary stasis among plants. References and Notes 1. W. Hewitson, Ann. Mo. Bot. Gard. 49, 57–93 (1962). 2. C. Phipps et al., Am. J. Bot. 85, 888–895 (1998). 3. C. N. Miller, Contrib. Mus. Paleontol. 23, 105–169 (1971). 4. G. W. Rothwell, E. L. Taylor, T. N. Taylor, Am. J. Bot. 89, 352–361 (2002). 5. N. Tian, Y.-D. Wang, Z.-K. Jiang, Palaeoworld 17, 183–200 (2008). 6. R. Serbet, G. W. Rothwell, Int. J. Plant Sci. 160, 425–433 (1999). 7. C. Tsutsumi, S. Matsumoto, Y. Yatabe-Kakugawa, Y. Hirayama, M. Kato, Syst. Bot. 36, 836–844 (2011). 8. E. J. Klekowski, Am. J. Bot. 57, 1122–1138 (1970). 9. M. S. Barker, P. G. Wolf, Bioscience 60, 177–185 (2010). 10. I. J. Leitch, A. R. Leitch, in Plant Genome Diversity, I. J. Leitch, J. Greilhuber, J. Doležel, J. F. Wendel, Eds. (Springer-Verlag, Wien, 2013), vol. 2, pp. 307–322. 11. C. Augustsson, GFF 123, 23–28 (2001). 12. See supplementary materials available on Science Online. 13. I. Bergelin, GFF 131, 165–175 (2009). 14. A. Ahlberg, U. Sivhed, M. Erlström, Geol. Surv. Denm. Greenl. Bull. 1, 527–541 (2003). 15. S. D. Brack-Hanes, J. C. Vaughn, Science 200,
  • 73. 1383–1385 (1978). 16. K. J. Niklas, Am. J. Bot. 69, 325–334 (1982). 17. J. W. Hagadorn et al., Science 314, 291–294 (2006). 18. A. E. DeMaggio, R. H. Wetmore, J. E. Hannaford, D. E. Stetler, V. Raghavan, Bioscience 21, 313–316 (1971). 19. J. Masterson, Science 264, 421–424 (1994). 20. I. Símová, T. Herben, Proc. Biol. Sci. 279, 867–875 (2012). 21. B. H. Lomax et al., New Phytol. 201, 636–644 (2014). Acknowledgments: We thank E. M. Friis and S. Bengtson (Stockholm) and F. Marone and M. Stampanoni (Villigen) for assistance with SRXTM analyses at the Swiss Light Source, Paul Scherrer Institute (Villigen); G. Grimm (Stockholm) for assistance with statistical analyses; B. Bremer and G. Larsson (Stockholm) for providing live material of Osmunda; M. A. Gandolfo Nixon and J. L. Svitko (Ithaca, New York) for permission to use images from the Cornell University Plant Anatomy Collection (CUPAC; http://cupac.bh.cornell.edu/); the members of Tjörnarps Sockengille (Tjörnarp) for access to the fossil locality; A.-L. Decombeix (Montpellier), I. Bergelin (Lund), C. H. Haufler (Lawrence, Kansas), N. Tian (Shenyang), Y.-D. Wang (Nanjing), and T. E. Wood (Flagstaff, Arizona) for discussion; and two anonymous referees for constructive comments. This research was jointly supported by the Swedish Research Council (VR), Lund University Carbon Cycle Centre (LUCCI), and the Royal Swedish Academy of Sciences. The material is curated at the Swedish Museum of Natural History (Stockholm, Sweden) under accession nos. S069649 to S069658
  • 74. and S089687 to S089693. Supplementary Materials www.sciencemag.org/content/343/6177/1376/suppl/DC1 Materials and Methods Supplementary Text Figs. S1 to S6 Table S1 References (22–36) Movies S1 and S2 17 December 2013; accepted 21 February 2014 10.1126/science.1249884 Fig. 2. Morphometric parameters of inter- phase nuclei of extant O. cinnamomeum com- pared to those of the Korsaröd fern fossil. Col- ored box-and-whiskers plots in upper graph indicate interquartile ranges (box) with mean (square), me- dian (solid transverse bar), and extrema (whiskers); dashed colored lines in lower graph indicate linear fits (n = 76 versus n = 37 measured nuclei for extant O. cinnamomeum versus the fossil). www.sciencemag.org SCIENCE VOL 343 21 MARCH 2014 1377
  • 75. REPORTS DOI: 10.1126/science.1249884 , 1376 (2014);343 Science et al.Benjamin Bomfleur Genomic Stasis in Royal Ferns Fossilized Nuclei and Chromosomes Reveal 180 Million Years of This copy is for your personal, non-commercial use only. clicking here.colleagues, clients, or customers by , you can order high-quality copies for yourIf you wish to distribute this article to others here.following the guidelines can be obtained byPermission to republish or repurpose articles or portions of articles ): February 13, 2015 www.sciencemag.org (this information is current as of The following resources related to this article are available online at http://www.sciencemag.org/content/343/6177/1376.full.html version of this article at: including high-resolution figures, can be found in the onlineUpdated information and services,
  • 76. http://www.sciencemag.org/content/suppl/2014/03/19/343.6177. 1376.DC1.html can be found at: Supporting Online Material http://www.sciencemag.org/content/343/6177/1376.full.html#ref -list-1 , 10 of which can be accessed free:cites 33 articlesThis article http://www.sciencemag.org/content/343/6177/1376.full.html#rel ated-urls 1 articles hosted by HighWire Press; see:cited by This article has been http://www.sciencemag.org/cgi/collection/paleo Paleontology subject collections:This article appears in the following registered trademark of AAAS. is aScience2014 by the American Association for the Advancement of Science; all rights reserved. The title CopyrightAmerican Association for the Advancement of Science, 1200 New York Avenue NW, Washington, DC 20005. (print ISSN 0036-8075; online ISSN 1095-9203) is published weekly, except the last week in December, by theScience o n F e b