1. Determining haplotype diversity of modern Short-tailed
(Phoebastria albatrus), Black-footed (Phoebastria nigripes), and
Laysan (Phoebastria immutabilis) albatross using ancient and
historic mitochondrial DNA.
Nisan, Danielle, B.S. Class of 2013
Abstract:
Short-tailed albatross (STAL) were over-exploited and driven nearly to extinction in the
mid-1900s. The population has begun to rebound since this extreme bottleneck. However,
in the time of the population lapse it appeared that other North Pacific albatross species,
Laysan (LAAL) and Black-footed (BFAL), began to fill the recently available niche of the
STAL. As STAL populations continue to recover there are conservation concerns regarding
range contraction, availability of resources, and genetic diversity. Using samples of ancient
and historic individuals collected from different regions in the North Pacific we amplified
and sequenced two mitochondrial DNA regions, the Cytochrome b and d-loop regions to
determine how many extant haplotypes persist in STAL, BFAL, and LAAL. The d-loop
regions, with a faster mutation rate than cytochrome b regions, are more indicative of
recent mutations and diversity within the target species. Cytochrome b data indicated very
low levels of diversity within all three species, and especially in the STAL. We found that d-
loop regions showed much greater diversity within all of the species, and particularly in the
LAAL.
Introduction:
Short-tailed albatross (Phoebastria albatrus) have been recognized across their
range as endangered by the U.S. Fish and Wildlife Service and vulnerable by the IUCN
(Deguchi et al. 2012). Short-tailed albatross (STAL) are a North Pacific, pelagic species,
meaning they spend the majority of their life at sea and return to land only to breed
(Finkelstein et al. 2012). Population decline in the mid-1900s was a direct result of human
over-exploitation. Once heavily hunted for their feathers, short-tailed albatross went from
having a numerous and expansive population to near extinction (USFWS 2008). The
historic population size was estimated to be in the millions, but in 1949 there were no
recorded breeding pairs on any of the known breeding sites (Deguchi et al. 2012, Eda et al.
2005). Historically, short-tailed albatross had over 14 known breeding sites, however this
1
2. number has been greatly reduced to only 2 known sites (Eda et al. 2005). Approximately
80% of the existing population currently breeds on the Torishima Island off the coast of
Japan, the only other known breeding site is the Senkaku Islands, closer to Taiwan (Deguchi
et al. 2009, Eda et al. 2012). In 1950, a few individuals returned to the Torishima and
Senkaku islands (Deguchi et al. 2012). The current population is over 2,000 individuals and
growing, however, this extreme population decrease poses concerns for the conservation of
genetic diversity within extant individuals (Deguchi et al. 2012, Eda et al. 2005).
Short-tailed albatross are one of the three North Pacific albatross species. STAL
were most greatly affected by hunting pressures, all the albatross species were also afflicted
and are in the process of recovering. Although these three species have historically
maintained species-distinct breeding and foraging ranges after STAL populations were so
drastically reduced, much of their niche space was over-taken by the other two more
prevalent North Pacific populations of Laysan albatross (LAAL) and Black-footed albatross
(BFAL) (Figure 1). It is observed that as STAL continue to grow and expand they are facing
range limitations that were never of historic concern. How STAL will cope with these
current threats is still unknown. There are many facets in which this can affect individual
and population growth. Concerns include limited food availability and limited breeding
locations (over-population on breeding grounds or increased cases of inbreeding), which in
turn will lower the carrying capacity of the birds. If STAL remain at a small population size
for an extended period of time this will increase the chances of fixation of deleterious
mutations. Consequently, a timely and methodical recovery plan is imperative to
preserving the species and it’s wealth of evolved genetic diversity (Steadman et al. 2003;
Bouzat et al. 1998).
To further understand the change through time in these species, we have
undertaken a genetic approach. Ancient (8,000 – 1,000 BP), historical (1890 – 1965) and
2
3. Modern DNA analysis is utilized to determine 1) pre-bottleneck diversity of ancient STAL,
2) concurrent and post-bottleneck diversity of STAL, LAAL and BFAL.
Figure 1. Range map and breeding sites of BFAL, LAAL and STAL. Figure based on Newsome
and Sacks (2013).
Materials and Methods:
Historic DNA Extractions:
Historic toe-pad samples (n=64) from 1890- 1965 were provided by the
Smithsonian Natural History museum. All historic samples were extracted in an isolated lab
used only for the extraction of ancient and historic DNA. This facility was used to reduce
the risk of contamination by separating the extraction and PCR process and using personal
protective gear. Qiagen DNAeasy Tissue kit was used according to manufacturers protocol,
except for the following alterations. Before overnight lysis began the museum toe-pad
samples were immersed in 500µl of EtOH for 10 minutes, rinsed with DI water and allowed
3
4. to air dry for 10 minutes to remove potential contamination from human handling and
chemical preservatives. Buffer ATL and proteinase K were used for lysis, however we
increased the amount of proteinase K in the protocol from 20µl to 40µl. DNA was eluted in
100µl of buffer AE.
Ancient DNA Extractions:
Ancient DNA bone samples (n=33) from the Kuril Islands, and California Channel
Islands were extracted roughly following Rohland et al. (2010) and Rohland and Hofreiter
(2007) protocol for silica extraction methods. Following silica extraction we used an aliquot
of 100 µl of extracted samples for ethanol precipitation as per Kemp et al. (2006) to further
reduce PCR inhibitors. Following ethanol precipitation, samples were eluted in 100 ul of
water and utilized for PCR.
Polymerase Chain Reaction:
Polymerase Chain Reaction (PCR) was used for all samples, extraction blanks (one
per extraction set of between 8 and 16 samples) and PCR blanks (one per PCR cycle).
Primers for cyt b amplification were set to amplify ~180 base-pairs (Eda et al. 2006). D-
loop primers (developed by the VGL) were set to amplify ~290 base-pairs. Each PCR tube
contained 38 µl consisting of 3 µl of DNA extract, 20µl of master mix (1 x PCR buffer, 3 mM
MgCl2, 0.2 mM dNTPs, 2.2 µg/ µl BSA, 0.5 µm of each primer and 1µ of titanium taq
(Clonetech) and 15µl of chill-out. Cytochrome-b and d-loop regions were amplified with
thermal cycling set at 94 C for 10 min, followed by 40 cycles of 94 C for 45 s, 50 C for 45 s
and 72 C for 45 s; followed by 10 min of extension at 72 C. Gel electrophoresis was used to
distinguish samples that yielded DNA and to confirm that there was no contamination
throughout the extraction or amplification process.
4
5. Sequencing:
Forward and reverse strands of all amplicons that yielded DNA within the expected
fragment range were then sequenced. Samples were cleaned with 1.5µl of exosap to 5µl of
PCR product. Sequencing of amplicons of was performed with Big Dye v 3.1 chemistry on
an ABI 3730 capillary sequencer. Sequences were viewed and edited with Sequencher 5.0
(Gene Codes) and aligned with albatross sequences from Genbank to determine species and
haplotype identification.
Results:
Cytochrome b:
All museums samples had been previously species identified based on morphology
(STAL, BFAL, and LAAL). Cytochrome b analysis was used to confirm species ID of known
samples as well as determine species identity of ancient specimens. This was established
with 100% accuracy over all zooarchaeological specimens.
Additionally, the cytochrome b region of the mitochondrial DNA (mtDNA) was
utilized to determine haplotype diversity. A total of 16 individuals for cytochrome b were
used from the available specimens. The current sample size reflects a 66% success rate in
the sequencing of amplified historical toe-pad samples. The success of our ancient samples
was significantly less with only 18% (6/33) of the samples yielding DNA. Of the successful
samples, 83% (5/6) were from the Kuril Islands; suggesting higher, site-specific
preservation qualities (Table 1.). There are fewer cyt b haplotypes than d-loop (HV2)
haplotypes within the STAL samples. BFAL and LAAL samples showed higher levels of
diversity than STAL in both cytochrome b and HV2 regions.
5
6. D-loop- Hypervariable region 2 (HV2):
Of the 64 historical toe pad specimens, 48 individuals were PCR amplified (75%
success rate), and of those 43 individuals were successfully sequenced (~89% success rate).
The HV2 regions that amplified were indicating lower levels of haplotype diversity than
expected within modern STAL samples. The HV2 data showed 4 haplotypes within the 11
STAL samples, 9 haplotypes within the 19 LAAL samples and 4 haplotypes within the 13
BFAL samples (Table 2). STAL and BFAL had the same number of haplotypes, and LAAL had
significantly higher HV2 haplotypes. There were no significant differences in success rate of
historic samples across time.
Figures and Tables:
6
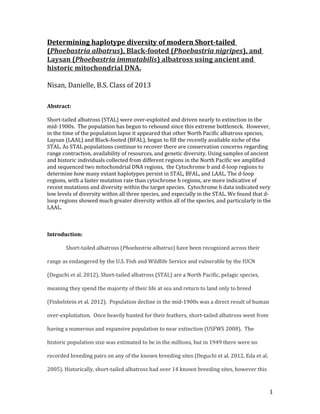
Figure 2. Median-joining network among North Pacific albatross mtDNA 270-bp CR
haplotypes, including ancient (n=2) historic (n=41), and modern (n=13) samples.
Sample sizes of historic and ancient samples were 13 for Black-footed (BFAL), 11
for Short-tailed (STAL), and 17 from Laysan (LAAL). Modern samples are from Eda
et al. 2010 and inferred lineages or previously name haplotypes are indicated for
BFAL and STAL. Figure based on Newsome and Sacks (2013).
Hawaii
North Pacific
Japan/Korea/China/Taiwan
Russia
North Pacific
Japan/Korea/China/Taiwan
Our historical samples
Eda’s modern samples
Washington
BFAL
STAL
LAAL
*
* *
*
** *
*
*
Japan/Korea/China/Taiwan
Our ancient samples
“J1”
“Senkaku
lineage”
“Torishima
lineage”
7. Table 1. Cyt b haplotype data
Table 2. HV 2 haplotype data from D-loop sequencing of historic and ancient samples.
Historic Samples Ancient Samples
Species # Individuals # HV2 Haplotypes
Samples
between
1869 -
1890
Samples
between
1922 -
1965
Samples
800-1300
years old
Samples
2,300
years old
Samples
with
unreported
date
BFAL 13 4 0 13 0 0 0
LAAL 19 9 0 19 0 0 0
STAL 11 4 7 0 1 1 2
Species # Individuals # Cytb Haplotypes 8,500 - 10,000 bp 2,000 bp
Samples
between
1869 -
1890
Samples
between
1922 -
1965
Samples
with
unreported
date
BFAL 3 2 0 0 0 3 0
LAAL 5 2 0 0 2 2 0
STAL 9 1 1 5 1 0 1
7
8. Table 3. Haplotype names and identities of historic specimens.
Haplotype
number
Length of
haplotype
(bp)
Sequences
belonging to
haplotype
Locatio
n of
Sample
Year
Haplotype
Name
Genbank Accession Citation
Location
of
Modern
Sample
BFAL1 167
USNM492908_B
FAL
Midway
Islands,
Sand
Island 1963
H5, H3, H1
AY641403, AY641401,
AY641399.1
Walsh and
Edwards
2005
Hawaii
USNM494147_B
FAL
Midway
Islands,
Eastern
Island 1963
H5, H3, H1
AY641403, AY641401,
AY641399.1
Walsh and
Edwards
2005
Hawaii
BFAL2 167
USNM300832_B
FAL
Nihoa
Island 1923
J2, J4, J1
AB426114,AB426116.1,AY64
1404
Eda et al.
2008,Wals
h and
Edwards
2005
Bonin
Islands,
Mukojim
a Island
(Japan),
LAAL1 167
USNM492912_L
AAL
Midway
Islands,
Sand
Island 1963
LA-1
U48949.1
Nunn et al.
1996
North
Pacific
Ocean
USNM300849_L
AAL
Lisiansk
i island
1923
LA-1
U48949.1
Nunn et al.
1996
North
Pacific
Ocean
LAAL2 167
USNM289158_L
AAL
Laysan
Island
1923
Novel- one
off LA-1
( U48949.1
) U48949.1
Nunn et al.
1996
North
Pacific
Ocean
USNM289156_L
AAL
Laysan
Island
1923
Novel- one
off LA-1
( U48949.1
) U48949.1
Nunn et al.
1996
North
Pacific
Ocean
USNM498138_L
AAL
Kure
Atoll,
Green
Island 1964
Novel- one
off LA-1
( U48949.1
) U48949.1
Nunn et al.
1996
North
Pacific
Ocean
STAL1 167
USNM18586_ST
AL
Alaska,
Cook's
inlet
Unknow
n
Not named U48952.1
Nunn et al.
1996
Torishim
a Island,
Japan
USNM226450_S
TAL
Pribilof
Islands,
St. Paul
Island 1890 Not named U48952.1
Nunn et al.
1996
Torishim
a Island,
Japan
PC157_STAL
San
miguel,
CA
8,500 –
10,000
BP Not named U48952.1
Nunn et al.
1996
Torishim
a Island,
Japan
KBP3891.010_S
TAL
Kuril
Islands
1,300 –
800 BP
Not named U48952.1
Nunn et al.
1996
Torishim
a Island,
Japan
KBP2385_STAL
Kuril
Islands
2,300
BP
Not named U48952.1
Nunn et al.
1996
Torishim
a Island,
Japan
KBP3674_STAL
Kuril
Islands
1,300 –
800 BP
Not named U48952.1
Nunn et al.
1996
Torishim
a Island,
Japan
KBP3671.032_S
TAL
Kuril
Islands
1,300 –
800 BP
Not named U48952.1
Nunn et al.
1996
Torishim
a Island,
Japan
KBP2569.001_S
TAL
Kuril
Islands
2,310 –
2,540
BP Not named U48952.1
Nunn et al.
1996
Torishim
a Island,
Japan
8
9. Discussion:
Population crashes in wild populations typically result in reduced genetic diversity
(Steadman et al. 2003; Bouzat et al. 1998). Short-tailed Albatross experienced such a
population crash due to overexploitation in the early 20th
century. The species has since
recovered, however it is unknown how much and to what extent genetic diversity loss will
affect their long-term population fitness. Bottleneck effects are known to increase in
populations that remain small for many generations or with bottleneck extremes that
reduce populations to very few individuals.
Cytochrome b and d-loop regions of mtDNA were both used to determine haplotype
diversity. The cyt b region showed much less diversity within the species than the d-loop
regions. This is partly expected because of the nature of the genes. Cytochrome b mutates
at a much slower rate than the d-loop region, so as expected we observed an even greater
distribution of haplotypes in this region.
Only a few lineages were determined with cyt b in BFAL and LAAL- suggesting fewer
natal sites (Furman et. al 2013, Kim et. al 2013). Only one lineage was defined in STAL (that
goes back between 8,000 – 10,000 years) discovered by Nunn et al. 1996 (Genbank
accession U48952.1)- suggesting either that 1) they had been persecuted heavily by early
people or 2) that they naturally have little diversity/few natal sites (Table 3). STAL have
four d-loop haplotypes (more resolution than cyt b- Doukakis 1999; Xu 1994), but one
haplotype occurs only in the Kuril Islands, suggesting that it has since disappeared in
modern individuals (Figure 2). The other haplotypes are from the Torishima Island lineage,
where modern birds share these haplotypes.
Of the five known haplotypes from STAL specimens one ancient and one historic
sample from the Kuril site have distinct haplotypes. The loss of these novel haplotypes
9
10. likely occurred during the bottleneck period in the mid-1900’s. Figure 2 indicates the Asian
origin of these haplotypes and the 2-3 mutation separation between these individuals and
the only remaining haplotype found in modern populations of STAL linages. The data
shows that modern STAL have only two haplotypes isolated to only one region, suggesting
that all other lineages have been lost (Figure 2). Modern LAAL specimens, on the other
hand, seem to have relatively well maintained haplotype diversity from historic to modern
samples.
Despite an unsurprising trend of decrease in success rate from modern to historic,
and historic to ancient samples we also noticed a distinct trend as to success rate of samples
from specific collection locations. Sampling sites were vast throughout the North Pacific yet
the success rate at each of these sites was not uniform. Ancient samples obtained from
Kuril Islands showed a 35% success rate (5/14 attempted extractions), suggesting a more
suited atmosphere for DNA preservation. Where as the general success of all ancient
samples was a mere 18% (6/33 attempted extractions). As ancient and historic DNA may
expectedly deteriorate with time, we suspect that certain collection sites were generally
more stable for the preservation of these samples.
BFAL and LAAL have higher diversity than STAL, but we need more data points and
a much faster evolving marker, such as microsatellites, to be able to determine if BFAL and
LAAL are overtaking the STAL niche. Zooarchaeological samples of mtDNA through time
are a good place to start but without microsatellites we can’t fully grasp an understanding
of genetic population structure. Continuing research with microsatellite markers will
provide more robust data about how the bottleneck has affected the surviving individuals.
Our current data, however, can still be effectively used in chick translocation conservation
efforts in the interest of avoiding further genetic degradation of these species.
10
11. Acknowledgments:
I would like to thank Dr. Ben Sacks, Dr. Sarah Brown, Dr. Mark Statham, Sini Reponen, and
Zach Lounsberry from the Veterinary Genetics Lab, Canid Diversity and Conservation
Group. Additionally, I would like to thank the Veterinary Genetics Lab for funding. I would
also like to thank the albatross team collaborators Michael A. Etnier, Paul W. Collins, Seth D.
Newsome, Melinda G. Connors, and Torben C. Rick.
Bouzat, J. et al. "Genetic Evaluation of a Demographic Bottleneck in the Greater
Prairie Chicken." Conservation biology 12.4 (1998):836-.
Deguchi, T., J. Jacobs, T. Harada, L. Perriman, Y. Watanabe, F. Sato, N. Nakamura, K.
Ozaki, and G. Balogh. 2012. Translocation and handrearing techniques for
establishing a colony of threatened albatross. Bird Conservation International, 22,
pp 6681 doi:10.1017/S0959270911000438
Doukakis, P. "Molecular genetic analysis among subspecies of two Eurasian sturgeon
species, Acipenser baeri and A. stellatus." Molecular ecology 8.12 (1999):S117-.
Eda, M., Baba, Y., Koike, H., Higuchi, H. 2005. Do temporal size differences influence
species identification of archaeological albatross remains when using modern
reference samples? Journal of Archaeological Science 33 (2006) 349e35
Eda, M., Koike, H., Kuro-o, M., Mihara, S., Hasegawa, H., & Higuchi, H. (2012).
Inferring the ancient population structure of the vulnerable albatross phoebastria
albatrus, combining ancient DNA, stable isotope, and morphometric analyses of
archaeological samples. Conservation Genetics, 13(1), 143-151. doi:
http://dx.doi.org/10.1007/s10592-011-0270-5
Finkelstein, M., S. Wolf, M. Goldman, and D. Doak. 2009. The anatomy of a
(potential) disaster: Volcanoes, behavior, and population viability of the short-tailed
11
12. albatross (Phoebastria albatrus), October 20th, 2009. Ecology and Evolutionary
Biology Department, University of California, Santa Cruz.
Furman, Andrzej, et al. "Phylogeography of the large Myotis bats (Chiroptera:
Vespertilionidae) in Europe, Asia Minor, and Transcaucasia." Biological journal
of the Linnean Society 108.1 (2013):189-209.
Ikemoto, T., Kunito, T., Tanabe, S., Tsurumi, M., Sato, F., & Oka, N. (2005). Non-
destructive monitoring of trace element levels in short-tailed albatrosses
(phoebastria albatrus) and black-footed albatrosses (phoebastria nigripes) from
torishima island, japan using eggs and blood. Marine Pollution Bulletin, 51(8-12),
889-895. doi: http://dx.doi.org/10.1016/j.marpolbul.2005.06.003
Kemp, Brian, Monroe, Cara and Smith, David. "Repeat silica extraction: a simple
technique for the removal of PCR inhibitors from DNA extracts." Journal of
archaeological science 33.12 (2006):1680-1689.
Kim, J, Byun, M J, Kim, M, et al. (2013). mtDNA Diversity and Phylogenetic State of
Korean Cattle Breed, Chikso. Asian-Australasian journal of animal sciences,
26(2), 163-170.
Kuro-o, M., H. Yonekawa, S. Saito, M. Eda, H. Higuchi, H. Koike, and H. Hasegawa.
2010. Unexpectedly high genetic diversity of mtDNA control region through severe
bottleneck in vulnerable albatross Phoebastria albatrus. Conservation Genetics
11:127–137.
Newsome SD, Sacks BN. NSF Proposal “Collaborative Research: Past versus present
distribution and trophic interactions of North Pacific albatrosses.”
Steadman, David et al. "Prehistoric Exploitation Of Birds On The Pacific Coast Of
Chiapas, Mexico." The condor 105.3 (2003):572-.
U.S. Fish and Wildlife Service. 2008. Short-tailed Albatross Recovery Plan. Anchorage,
AK, 105 pp.
12
13. Xu, Shizhong. "Constrained least squares estimation of mixed population stock
composition from mtDNA haplotype frequency data." Canadian journal of
fisheries and aquatic sciences 51.2 (1994):417-.
Zador, S. G., Parrish, J. K., Punt, A. E., Burke, J. L., & Fitzgerald, S. M. (2008).
Determining spatial and temporal overlap of an endangered seabird with a large
commercial trawl fishery. Endangered Species Research, 5(2-3), 103-115. doi:
http://dx.doi.org/10.3354/esr00152
Zador, S. G., Punt, A. E., & Parrish, J. K. (2008). Population impacts of endangered
short-tailed albatross bycatch in the alaskan trawl fishery. Biological
Conservation, 141(3), 872-882. doi: http://dx.doi.org/10.1016/j.biocon.2008.01.001
13