SlideShare a Scribd company logo
1 of 9
Download to read offline
Market Summary - Overview
Pseudo City: Muscat (MCT) @ 17 Nov 2013 for FIT
$ Supplier Cost

Mar

Apr

May

Jun

Jul

Aug

Sep

Oct

Nov

Dec

Total

313,068

327,420

248,145

192,266

139,117

73,275

133,061

166,119

277,968

186,861

114,084

2,410,219

185,075

217,411

254,711

356,386

148,855

121,509

104,692

136,269

148,885

280,254

264,343

135,893

2,354,284

29%

44%

29%

-30%

29%

14%

-30%

-2%

12%

-1%

-29%

-16%

2%

Growth

From 1 Dec 2013
Date

Feb

238,834

Prior

Forward Dates with Limited Availability

Jan

Current

All Rooms Sold Rooms Unsold Availability Usage Priority

Thu, 26 Dec 2013

1,042

15

1,027

99%

1%

Fri,

Room-nights

10

Jan

Feb

Mar

Apr

May

Jun

Jul

Aug

Sep

Oct

Nov

Dec

Total

1,302

Current

1,711

1,855

1,480

1,231

939

506

919

1,110

1,417

1,004

353

13,827

27 Dec 2013

1,116

18

1,098

98%

2%

9

Prior

962

1,117

1,335

1,632

1,009

907

741

904

998

1,481

1,357

399

12,842

Sat, 28 Dec 2013

870

19

851

98%

2%

7

Growth

35%

53%

39%

-9%

22%

4%

-32%

2%

11%

-4%

-26%

-12%

8%

Sun, 29 Dec 2013

780

26

754

97%

3%

3

Mon, 30 Dec 2013

780

23

757

97%

3%

5

Jan

Feb

Mar

Apr

May

Jun

Jul

Aug

Sep

Oct

Nov

Dec

Total

458

537

626

489

447

371

204

293

399

451

344

83

4,702

Tue, 31 Dec 2013

785

25

760

97%

3%

4

Wed,

1 Jan 2014

916

38

878

96%

4%

1

Thu,

2 Jan 2014

925

37

888

96%

4%

2

Fri,

3 Jan 2014

1,003

24

979

98%

2%

6

Sat,

4 Jan 2014

1,006

20

986

98%

2%

Bookings
Current

8

Prior

346

414

444

481

379

294

271

261

356

418

375

81

4,120

Growth

32%

30%

41%

2%

18%

26%

-25%

12%

12%

8%

-8%

2%

14%

Jan

Feb

Mar

Apr

May

Jun

Jul

Aug

Sep

Oct

Nov

Dec

Summary

Current

$ Avg Daily Rate

212

209

206

195

185

175

170

173

177

236

225

414

205.76

Prior

232

233

231

263

178

163

171

181

177

216

199

416

215.69

Growth

-9%

-10%

-11%

-26%

4%

7%

-1%

-4%

0%

10%

13%

0%

-5%

Supplier Cost

Room-nights
400,000

40%

350,000

0%
150,000

-10%

100,000

-20%

Growth Year on Year

200,000

1,600

20%

1,200

0%

800

-20%

400

50,000

-30%

Jan Feb Mar Apr May Jun

Jul Aug Sep Oct Nov Dec

Departure Month

0

Growth
Prior
Current

700

40%
30%

500

20%
400
10%
300
0%
200

-10%

100

-20%
-40%

Jan Feb Mar Apr May Jun

Jul

Aug Sep Oct Nov Dec

Departure Month

0

Growth
Prior
Current

600

Bookings

10%

50%

Room-nights

250,000

Bookings
2,000

40%

300,000

20%

-40%

Growth
Prior
Current

Supplier Cost

Growth Year on Year

30%

60%

Growth Year on Year

50%

-30%

Jan Feb Mar Apr May Jun

Jul

Aug Sep Oct Nov Dec

0

Departure Month

Year-on-Year growth uses left axis and is shown by a line. Actual values use the right axis and are shown by columns. Prior year's values as at 17 Nov 2012

Business Intelligence

Powering Global Travel

Page 1 of 9
Hotel Summary - Overview (Static)
Pseudo City: Muscat (MCT) @ 17 Nov 2013 for FIT
$ Supplier Cost

320,000
Growth
Prior
Current

280,000

40%

20%

200,000

0%

160,000
120,000

-20%

Apr

May

Jun

Jul

Aug

Sep

Oct

Nov

Dec

Total

254,959

212,858

183,417

126,185

64,800

114,441

135,716

183,831

133,268

96,815

1,944,564

131,605

175,848

232,195

298,724

130,149

116,737

91,646

127,232

119,770

230,804

222,201

107,672

1,984,582

40%

45%

10%

-29%

41%

8%

-29%

-10%

13%

-20%

-40%

-10%

-2%

Growth

Room-nights

Jan

Apr

May

Jun

Jul

Aug

Sep

Oct

Nov

Dec

Total

1,619

1,339

1,185

873

461

833

964

1,125

816

299

12,158

773

965

1,255

1,447

914

879

659

852

877

1,311

1,214

322

11,468

45%

58%

29%

-7%

30%

-1%

-30%

-2%

10%

-14%

-33%

-7%

6%

Jan

Feb

Mar

Apr

May

Jun

Jul

Aug

Sep

Oct

Nov

Dec

Total

403

485

549

436

431

344

184

259

348

365

297

68

4,169

Bookings
Current
Prior

280

364

409

425

338

275

243

240

316

375

330

71

3,666

Growth

44%

33%

34%

3%

28%

25%

-24%

8%

10%

-3%

-10%

-4%

14%

40,000

Jul Aug Sep Oct Nov Dec

Jan

Feb

Mar

Apr

May

Jun

Jul

Aug

Sep

Oct

Nov

Dec

Summary

Current

$ Avg Daily Rate

188

188

184

186

183

171

166

167

167

200

197

421

188.96

Prior

209

218

225

250

173

162

170

180

161

199

183

412

203.92

-10%

-14%

-18%

-26%

6%

6%

-2%

-7%

3%

0%

8%

2%

-7%

0

Room-nights

Bookings
1,800

50%
Growth
Prior
Current

1,600
60%
1,400
40%

600
400

-20%

Jan Feb Mar Apr May Jun

Jul

Aug Sep Oct Nov Dec

Departure Month

400

10%

300

0%

200

-10%

0

-30%

300

-5%

250
-10%
200
-15%

150

-20%
100

-20%

Jan Feb Mar Apr May Jun

Jul

Aug Sep Oct Nov Dec

Departure Month

0

100

-25%
-30%

Growth
Prior
Current

350

0%

20%

200

400

Bookings

0%

500

450

5%

Growth
Prior
Current

Bookings

800

Room-nights

20%

10%

30%

1,200
1,000

Avg Daily Room Cost
600

40%

Growth Year on Year

80%

Growth Year on Year

Jan Feb Mar Apr May Jun

Growth

Growth Year on Year

Mar

1,527

Growth

Departure Month

-40%

Feb

1,117

Prior

80,000
-40%

-60%

Mar

254,233

Current

Supplier Cost

Growth Year on Year

240,000

Feb

184,040

Prior

Supplier Cost
60%

Jan

Current

50

Jan Feb Mar Apr May Jun

Jul

Aug Sep Oct Nov Dec

0

Departure Month

Year-on-Year growth uses left axis and is shown by a line. Actual values use the right axis and are shown by columns. Prior year's values as at 17 Nov 2012

Business Intelligence

Powering Global Travel

Page 2 of 9
Hotel Summary - Overview (DI)
Pseudo City: Muscat (MCT) @ 17 Nov 2013 for FIT
$ Supplier Cost

100,000
Growth
Prior
Current

200%

Mar

Apr

May

Jun

Jul

Aug

Sep

Oct

Nov

Dec

Total

58,835

72,462

35,287

8,849

12,932

8,475

18,620

30,403

94,137

53,593

17,269

465,655

53,470

41,563

22,517

57,662

18,706

4,772

13,047

9,038

29,116

49,450

42,142

28,221

369,702

2%

42%

222%

-39%

-53%

171%

-35%

106%

4%

90%

27%

-39%

26%

Growth

80%

Mar

Apr

May

Jun

Jul

Aug

Sep

Oct

Nov

Dec

Total

184

236

141

46

66

45

86

146

292

188

54

1,669

189

152

80

185

95

28

82

52

121

170

143

77

1,374

Growth

Supplier Cost

60,000

Feb

185

Prior

120%

Jan

Current

80,000

160%
Growth Year on Year

Feb

54,793

Prior

Supplier Cost
240%

Jan

Current

Room-nights

-2%

21%

195%

-24%

-52%

136%

-45%

65%

21%

72%

31%

-30%

21%

Bookings

20,000

Feb

Mar

Apr

May

Jun

Jul

Aug

Sep

Oct

Nov

Dec

Total

55

52

77

53

16

27

20

34

51

86

47

15

533

Prior

0%

Jan

Current

40,000

40%

66

50

35

56

41

19

28

21

40

43

45

10

454

-17%

4%

120%

-5%

-61%

42%

-29%

62%

28%

100%

4%

50%

17%

Growth

-40%

Jan Feb Mar Apr May Jun

Jan

Feb

Mar

Apr

May

Jun

Jul

Aug

Sep

Oct

Nov

Dec

Summary

Current

356

381

358

290

229

224

209

238

244

379

345

375

328.20

Prior

Jul Aug Sep Oct Nov Dec

$ Avg Daily Rate

327

325

321

365

225

192

182

196

286

344

342

431

313.96

9%

17%

11%

-21%

2%

17%

15%

21%

-15%

10%

1%

-13%

5%

0

Departure Month

Growth

Room-nights

Bookings

240

120%

200

80%

160

40%

120

0%

80

-40%

40

-80%

Jan Feb Mar Apr May Jun

Jul

Aug Sep Oct Nov Dec

Departure Month

0

Growth
Prior
Current

120%

Growth Year on Year

160%
Growth Year on Year

280

Avg Daily Room Cost
100

25%

80

80%
60
40%
40
0%

450

20%

Growth
Prior
Current

400

15%

350

10%

300

5%

250

0%
200

-5%

150

-10%
20

-40%

100

-15%

50

-20%
-80%

Jan Feb Mar Apr May Jun

Jul

Aug Sep Oct Nov Dec

Departure Month

0

-25%

Growth
Prior
Current

Bookings

200%

160%

Bookings

320

Room-nights

240%

Growth Year on Year

-80%

Jan Feb Mar Apr May Jun

Jul

Aug Sep Oct Nov Dec

0

Departure Month

Year-on-Year growth uses left axis and is shown by a line. Actual values use the right axis and are shown by columns. Prior year's values as at 17 Nov 2012

Business Intelligence

Powering Global Travel

Page 3 of 9
Market Summary - Top Hotels
Pseudo City: Muscat (MCT) @ 17 Nov 2013 for FIT
Full Calendar Year 2013
$Supplier Cost

Mar

Apr

May

Jun

Jul

Aug

Sep

Oct

Nov

Dec

Total

35,790

37,227

41,733

33,628

21,656

11,536

21,799

16,624

41,049

19,137

15,502

331,583

23,178

38,765

64,522

31,551

26,777

8,556

4,927

5,622

10,427

26,252

17,730

10,664

268,971

Shangri La Muscat (MCT_SHAC)

12,049

18,477

21,268

8,969

3,852

6,200

5,812

13,619

17,629

53,494

32,651

6,997

201,015

Crowne Plaza (MCT_CRO)

Top Hotels YTD

Feb

35,903

Intercontinental (MCT_INT)

Top Hotels YTD

Jan

Grand Hyatt (MCT_GRA)

18,986

35,587

27,833

22,868

7,964

10,201

6,033

5,059

19,998

13,179

12,602

8,032

188,342

The Chedi (MCT_THE)

24,470

30,448

14,647

9,036

21,613

5,923

12,745

10,434

12,660

11,086

7,639

5,821

166,521

City Seasons (MCT_CIT)

24,219

31,103

25,974

17,996

9,540

12,307

5,232

6,736

14,556

11,030

5,876

867

165,435

Al Bustan Palace (MCT_ALB)

17,131

13,766

17,029

6,890

7,761

9,670

1,816

5,486

875

22,207

13,511

28,873

145,017

Park Inn (MCT_PAR1)

12,692

8,203

9,295

26,870

8,522

5,836

2,559

3,380

5,403

2,009

10,164

6,795

2,973

10,346

6,078

4,146

9,711

2,109

11,133

9,791

13,453

2,517

1,904

80,955

6,111

12,401

7,507

9,634

6,231

2,811

4,581

6,576

8,783

6,276

3,693

74,603

1,618

15,460

16,382

6,504

5,443

2,719

3,421

3,945

9,206

2,084

4,038

331

71,151

10,258

8,062

7,622

11,669

7,608

2,878

2,317

2,712

3,572

5,081

3,956

1,273

67,009

330

5,177

14,952

4,016

758

9,330

8,665

9,034

5,153

1,164

63,860

5,620

4,465

7,452

1,718

2,109

1,284

4,041

14,422

6,894

644

59,393

5,106

3,966

2,267

6,868

7,667

8,248

8,999

930

44,052

839

3,489

2,975

5,944

1,951

43,617

3,979

249

4,745

4,726

481

481

3,406

2,912

1,000

249

2,691

City Seasons (MCT_CIT)

5% 4% 4% 3%

6%

Grand Hyatt (MCT_GRA)
Intercontinental (MCT_INT)
Millenium Resort Mussanah (MCT_MI...
Shangri La Muscat (MCT_SHAC)

3% 3%

Crowne Plaza (MCT_CRO)
Golden Tulip Seeb (MCT_SEE)

2% 2%

6%

2%

6%

2%

6%

Park Inn (MCT_PAR1)
Tulip Inn Muscat (MCT_TUL)

2%

Ibis (MCT_IBI)
The Chedi (MCT_THE)
Golden Oasis (MCT_GOL3)
Best Western Premier Muscat (MCT_...

11%

Radisson Blu (MCT_RAD)
Al Bustan Palace (MCT_ALB)

Millenium Resort Mussanah (MCT_MIL)
Radisson Blu (MCT_RAD)
Golden Tulip Seeb (MCT_SEE)
Tulip Inn Muscat (MCT_TUL)
Shangrila Al Waha (MCT_SHA2)

5,282

Ibis (MCT_IBI)

1,625

9,118

94,934

Muscat Holiday Hotel (MCT_HOL)
Shangrila Al Waha (MCT_SHA2)

9,659

5,860

4,052

7,074

1,775

Muscat Holiday Hotel (MCT_HOL)

5,180

3,049

2,782

3,052

2,468

3,159

1,182

6,549

4,297

3,185

481

384

96

Waves International (MCT_WAV)

2,509

8,374

4,684

2,592

2,010

514

Golden Oasis (MCT_GOL3)

10%

9%

Ramada Qurum Beach (MCT_RAM)

Haffa House (MCT_HAF)

7%

Best Western Premier Muscat (MCT_94)

Waves International (MCT_WAV)
Haffa House (MCT_HAF)

6%

4,813

1,762

4,161

2,400

592

595

229

1,270

807

2,325

1,956

455

21,365

217,550

279,458

290,473

225,614

179,315

117,734

67,290

118,555

152,966

257,551

172,680

90,102

2,169,288

Ramada Qurum Beach (MCT_RAM)

Room-nights

Total
Top Hotels YTD

Room-nights RN % Share Bookings $Supplier Cost

City Seasons (MCT_CIT)

1,210

11%

392

162,328

Grand Hyatt (MCT_GRA)

1,120

10%

391

314,039

Intercontinental (MCT_INT)

Room-nights

33,389
24,453
23,625

Jan

Feb

Mar

Apr

May

Jun

Jul

Aug

Sep

Oct

Nov

Dec

Total

City Seasons (MCT_CIT)

184

230

191

136

70

94

40

50

109

78

45

7

1,234

Grand Hyatt (MCT_GRA)

107

108

108

122

163

114

58

117

52

120

57

27

1,153

Intercontinental (MCT_INT)

77

138

221

129

146

42

27

31

39

99

71

43

1,063

Millenium Resort Mussanah (MCT_MIL)

61

26

87

58

67

127

37

99

124

93

21

11

811

Shangri La Muscat (MCT_SHAC)

52

60

73

35

22

36

33

62

97

183

108

26

787

70,595

Crowne Plaza (MCT_CRO)

75

129

113

93

43

53

29

25

72

49

47

25

753

271

94,496

Golden Tulip Seeb (MCT_SEE)

13

140

164

67

59

31

38

39

101

16

33

2

703

6%

229

64,507

Tulip Inn Muscat (MCT_TUL)

99

75

79

118

76

29

26

25

39

53

43

11

673

602

5%

229

57,377

Park Inn (MCT_PAR1)

93

58

65

193

61

40

18

25

37

14

68

The Chedi (MCT_THE)

489

4%

119

157,502

Ibis (MCT_IBI)

17

91

59

48

82

18

23

14

41

152

71

8

624

Golden Oasis (MCT_GOL3)

422

4%

147

20,048

The Chedi (MCT_THE)

56

63

32

27

95

24

59

45

54

24

16

9

504

Radisson Blu (MCT_RAD)

385

3%

192

68,145

Golden Oasis (MCT_GOL3)

95

37

89

53

13

12

5

29

18

48

41

10

450

Best Western Premier Muscat (MCT_94)

385

3%

145

40,961

Radisson Blu (MCT_RAD)

33

67

41

54

41

18

29

36

47

34

20

420

Al Bustan Palace (MCT_ALB)

291

3%

93

110,793

45

35

23

74

76

72

78

8

411

Muscat Holiday Hotel (MCT_HOL)

269

2%

77

31,323

Al Bustan Palace (MCT_ALB)

41

24

31

12

30

51

8

32

4

35

37

52

357

Shangrila Al Waha (MCT_SHA2)

267

2%

73

62,697

Muscat Holiday Hotel (MCT_HOL)

38

23

21

23

25

32

47

3

36

38

Waves International (MCT_WAV)

258

2%

81

23,625

Shangrila Al Waha (MCT_SHA2)

18

1

20

71

22

48

40

26

17

4

271

Haffa House (MCT_HAF)

244

2%

90

23,452

Ramada Qurum Beach (MCT_RAM)

56

36

24

41

11

6

24

18

35

11

262

Ramada Qurum Beach (MCT_RAM)

227

2%

81

37,618

Waves International (MCT_WAV)

28

90

50

29

3

28

Haffa House (MCT_HAF)

13

71

45

34

1,123

1,432

1,520

Jan

Feb

62

59

1,001

9%

376

253,446

Millenium Resort Mussanah (MCT_MIL)

788

7%

224

77,649

Shangri La Muscat (MCT_SHAC)

716

6%

214

182,245

Crowne Plaza (MCT_CRO)

708

6%

251

175,217

Golden Tulip Seeb (MCT_SEE)

699

6%

268

Park Inn (MCT_PAR1)

669

6%

Tulip Inn Muscat (MCT_TUL)

649

Ibis (MCT_IBI)

Best Western Premier Muscat (MCT_94)

Total

Bookings
City Seasons (MCT_CIT)

4

672

286

24

6

5

4

1

5

5

32

29

10

258
254

1,279

1,138

829

453

802

974

1,223

889

284

11,946

Mar

Apr

May

Jun

Jul

Aug

Sep

Oct

Nov

Dec

Total

59

47

24

24

18

13

46

32

15

2

401

Page 4 of 9
Market Summary - Top Hotels
FIT
Full Calendar Year 2013

Jan

Feb

Mar

Apr

May

Jun

Jul

Aug

Sep

Oct

Nov

Dec

Total

Grand Hyatt (MCT_GRA)

Bookings

39

41

46

40

52

33

22

31

25

42

21

4

396

Intercontinental (MCT_INT)

37

51

83

54

41

22

13

10

15

37

22

8

393

Park Inn (MCT_PAR1)

38

26

29

63

27

15

13

13

17

8

24

8

41

50

30

26

26

12

16

35

11

14

2

271

Crowne Plaza (MCT_CRO)

28

32

37

30

18

23

13

12

25

18

22

7

265

Tulip Inn Muscat (MCT_TUL)

39

24

33

25

31

10

10

12

14

21

15

2

236

8

32

19

25

27

7

9

10

18

51

27

2

235

Shangri La Muscat (MCT_SHAC)

15

19

25

8

5

13

11

22

32

47

26

8

231

Millenium Resort Mussanah (MCT_MIL)

12

9

25

11

30

48

11

28

26

22

3

4

229

20

28

21

26

29

7

15

18

15

20

6

205

16

20

15

6

8

3

14

9

16

15

3

157

18

12

16

19

33

26

30

2

156

Golden Tulip Seeb (MCT_SEE)

Ibis (MCT_IBI)

Radisson Blu (MCT_RAD)
Golden Oasis (MCT_GOL3)

32

Best Western Premier Muscat (MCT_94)

273

10

16

5

4

23

15

11

12

17

3

5

2

123

Al Bustan Palace (MCT_ALB)

9

5

10

2

14

19

4

7

3

11

13

7

104

Haffa House (MCT_HAF)

7

14

21

11

3

2

1

1

2

16

12

3

93

Ramada Qurum Beach (MCT_RAM)

8

17

9

16

7

3

11

7

9

4

91

Waves International (MCT_WAV)

7

27

19

9

3

7

10

3

9

11

7

8

6

2

12

11

1

5

24

11

2

13

8

4

3

1

74

528

427

409

331

179

257

359

406

307

67

4,093

The Chedi (MCT_THE)

Muscat Holiday Hotel (MCT_HOL)
Shangrila Al Waha (MCT_SHA2)

Total

Business Intelligence

2
371

452

6

3

81
79

Powering Global Travel

Page 5 of 9
Market Summary - Booking Window
Pseudo City: Muscat (MCT) @ 17 Nov 2013 for FIT
Full Calendar Year 2013
$Supplier Cost

Jan

Feb

Mar

Apr

May

Jun

Jul

Aug

Sep

Oct

Nov

10,378

11,630

11,662

13,930

13,129

8,257

7,180

3,137

13,022

8,740

6,248

107,313

1-5

110,407

149,252

156,977

119,532

91,085

80,018

40,585

57,128

82,693

116,440

63,285

1,067,401

6 - 10

38,147

42,948

37,716

28,811

23,099

19,803

7,910

20,798

19,243

41,235

24,092

11 - 20

30,407

46,459

42,309

43,340

30,302

17,559

8,763

14,358

22,506

36,871

26,639

3,940

323,454

21 - 30

14,955

13,393

22,256

17,700

16,961

5,920

1,312

14,631

7,205

19,364

24,947

3,518

162,164

31 - 50

15,286

29,846

28,555

13,764

9,525

3,277

2,439

9,016

10,001

17,880

14,344

50,244

204,176

Same Day
31 - 50

51 - 70

9,341

2,172

11,409

4,915

1,031

2,869

2,560

6,534

5,969

5,511

2,401

14,561

69,272

70 +

9,912

17,368

16,536

6,153

6,861

1,414

2,099

7,460

5,479

31,398

24,905

41,821

171,406

21 - 30

Total

238,834

313,068

327,420

248,145

191,993

139,117

72,846

133,061

166,119

277,438

186,861

114,084

2,408,988

Jan

Feb

Mar

Apr

May

Jun

Jul

Aug

Sep

Oct

Nov

Dec

Total

79

89

88

86

94

55

52

30

94

78

38

783

1-5

666

915

942

779

630

504

295

382

539

690

358

6,700

6 - 10

165

208

203

161

135

147

46

137

117

212

160

11 - 20

147

193

226

238

159

121

67

106

132

164

159

12

1,724

21 - 30

75

83

119

84

101

46

8

99

60

63

100

20

858

31 - 50

49

146

131

66

60

31

10

56

94

81

87

138

949

51 - 70

35

11

76

35

8

17

16

38

35

14

15

59

359

70 +

86

66

70

31

41

18

11

71

39

109

87

124

753

Total

1,302

1,711

1,855

1,480

1,228

939

505

919

1,110

1,411

1,004

353

13,817

Jan

Feb

Mar

Apr

May

Jun

Jul

Aug

Sep

Oct

Nov

Dec

Total

36

31

36

36

43

33

23

15

38

37

17

345
2,559

Same Day

Booking Window last 12-Month
Days
1-5
13%

6%

6 - 10
11 - 20

7%
6%
5%

12%

3%

70 +
51 - 70

Room-nights
Same Day

48%

Room-nights

Lead Time 12-Month Room-nights RN % Share Bookings % Share $Supplier Cost

Dec

Total

303,802

1,691

1-5

6,669

48%

2,551

54%

1062805

11 - 20

1,735

13%

496

11%

320707

6 - 10

1,704

12%

582

12%

306798

Same Day

31 - 50

926

7%

218

5%

200011

1-5

257

315

348

284

263

201

126

139

222

245

159

21 - 30

863

6%

216

5%

165139

6 - 10

60

74

80

58

46

61

14

43

40

60

51

Same Day

783

6%

345

7%

107313

11 - 20

29

51

74

61

44

43

24

28

43

49

49

3

498

70 +

710

5%

170

4%

162193

21 - 30

21

19

29

19

25

12

4

20

17

14

29

6

215

51 - 70

452

3%

109

2%

100682

31 - 50

20

27

32

17

14

8

2

20

14

21

18

28

221

51 - 70

11

4

13

8

2

7

5

11

11

3

3

14

92

70 +

24

16

14

6

9

6

5

17

14

21

18

32

182

Total

458

537

626

489

446

371

203

293

399

450

344

83

4,699

Business Intelligence

Bookings

587

Powering Global Travel

Page 6 of 9
Market Summary - Top Markets
Pseudo City: Muscat (MCT) @ 17 Nov 2013 for FIT
Full Calendar Year 2013
Jan

Feb

Mar

Apr

May

Jun

Jul

Aug

Sep

Oct

Nov

Dec

Total

United Arab Emirates

$Supplier Cost

59,288

81,401

89,763

70,878

52,163

51,551

26,072

30,134

62,125

91,467

45,715

4,151

664,707

United Kingdom

40,140

69,900

50,940

52,009

38,631

11,748

9,823

22,811

13,703

53,247

45,752

22,242

430,946

Saudi Arabia

15,018

10,819

20,632

16,653

10,199

17,149

1,620

11,271

12,603

18,897

5,900

Italy

17,752

7,881

6,991

4,737

3,953

6,730

515

5,763

7,666

5,304

10,914

26,870

105,077

488

13,394

15,280

2,656

7,399

390

2,350

994

7,926

15,371

11,280

24,982

102,511

Qatar

9,456

16,003

12,244

7,249

9,887

12,419

2,732

7,436

3,093

12,000

7,771

India

8,728

15,290

11,787

7,534

4,340

3,475

3,510

7,495

3,864

5,713

6,844

Turkey

3,133

7,855

4,816

6,432

4,288

3,160

2,984

8,232

7,837

13,713

9,968

Bahrain

6,671

3,166

6,484

7,932

8,532

5,233

2,784

8,722

10,099

10,939

2,944

Kuwait

4,685

7,004

5,336

5,160

6,055

3,666

1,626

9,185

3,571

5,782

291

2,030

54,390

11,309

1,297

3,792

2,961

7,570

1,511

2,291

5,148

3,266

6,592

4,190

4,119

54,047

Spain

3,555

4,610

5,192

1,938

1,689

3,194

2,519

1,623

4,431

6,892

7,955

9,374

52,974

Australia

Greece

1,346

9,983

5,833

11,657

7,702

2,398

2,647

2,995

798

838

274

46,470

Switzerland
France

France

10,927

6,901

8,304

2,291

688

860

1,896

564

556

10,347

43,334

Oman

4,530

1,288

2,893

6,355

5,626

1,228

494

2,224

1,667

2,494

1,278

286

30,361

Lebanon

3,235

4,687

1,900

945

338

249

736

239

4,527

3,646

1,637

22,141

732

2,903

6,268

3,397

948

2,763

533

1,518

466

1,701

21,229

Jordan

1,466

1,623

3,915

2,424

4,121

2,223

1,331

273

97

1,473

1,465

20,410

Libya

1,669

4,417

5,608

2,348

1,416

662

675

Netherlands

5,392

821

4,260

Top Markets YTD
Market YTD
United Arab Emirates

4%
6%

4%

United Kingdom
Saudi Arabia

4% 4% 4% 3% 2%
2% 2%
2%
1%
2%
1%
1%
1%
1%
1%

Qatar
Turkey
Bahrain
India
Italy
Kuwait
Spain
Greece

18%

36%

Oman
Jordan

Switzerland

Australia

Egypt

Room-nights

Market YTD

Room-nights RN % Share Bookings $Supplier Cost

Total

United Arab Emirates

4,293

36%

1,892

2,133

18%

589

395,585

Saudi Arabia

738

6%

234

140,445

Qatar

479

4%

162

100,290

Turkey

457

4%

142

68,173

Bahrain

456

4%

165

73,057

India

452

4%

159

76,864

Italy

435

4%

121

76,905

Kuwait

318

3%

101

52,070

Spain

277

2%

82

38,764

Greece

274

2%

75

45,910

Australia

257

2%

79

48,525

Switzerland

250

2%

67

70,902

France

196

2%

56

32,987

Oman

174

1%

92

29,109

Australia

Jordan

153

1%

53

20,410

Lebanon

138

1%

45

Egypt

136

1%

Libya

108
97

268,800

219,815

175,546

129,947

78,581
2,530

65,231

125,219

151,377

74,948
73,507

17,413
348

12,308
2,146,405

255,976

167,001

107,553

651,655

United Kingdom

270,421

100,290

618
1,487

209,520

140,761

Netherlands

Jan

Feb

Mar

Apr

May

Jun

Jul

Aug

Sep

Oct

Nov

Dec

Total

United Arab Emirates

Room-nights

359

512

542

477

380

374

189

215

439

577

281

24

4,369

United Kingdom

85

2,273

221

314

291

246

231

105

61

173

116

227

203

Saudi Arabia

82

58

128

80

43

81

12

76

70

81

32

Italy

72

58

40

29

25

40

4

33

50

27

67

64

509

Turkey

17

51

38

53

37

22

28

65

56

69

40

7

483

Qatar

37

86

52

28

55

60

15

51

26

37

32

479

India

56

64

58

43

31

27

27

53

28

36

43

466

Bahrain

54

21

40

48

54

36

17

56

55

62

17

Spain

29

40

44

14

8

25

15

10

19

45

60

26

335

Kuwait

33

42

39

30

33

30

13

44

23

31

4

8

330

3

44

42

16

33

2

12

7

38

40

37

47

321

36

14

21

16

42

10

10

25

33

31

31

25

294

Greece

5

53

27

74

49

17

16

20

8

6

4

279

21,958

France

47

41

71

10

5

6

5

4

7

23

219

28

21,229

Oman

26

14

13

49

28

9

3

17

10

4

7

2

182

1%

20

17,413

Jordan

7

11

31

17

38

13

12

3

1

13

7

153

1%

11

11,960

Lebanon

17

15

16

11

2

4

6

3

32

20

13

139

Egypt

2

15

31

37

11

11

6

15

3

5

136

Libya

13

24

21

15

17

Netherlands

38

3

41

1,548

1,334

Switzerland

Total

1,154

1,477

4

12

872

450

863

460

2

108

15
1,122

743

1,031

2
1,317

892

99

317

12,377

Page 7 of 9
Bookings

Jan

Feb

Mar

Apr

May

Jun

Jul

Aug

Sep

Oct

Nov

Dec

Total

United Arab Emirates

169

203

245

208

195

191

90

98

196

193

128

7

1,923

United Kingdom

71

88

84

66

59

28

20

34

31

69

56

20

626

Saudi Arabia

21

23

38

21

18

21

9

27

28

17

13

236

Bahrain

21

9

13

17

18

13

9

18

20

22

6

166

India

17

19

26

16

11

12

6

11

14

12

18

162

Qatar

14

29

20

12

14

19

8

12

11

13

10

Turkey

7

15

17

15

12

12

8

17

14

17

14

3

151

Italy

16

19

14

10

8

12

3

10

8

10

14

11

135

Kuwait

10

12

12

12

11

12

4

9

7

12

1

3

105

Oman

16

10

8

17

11

8

2

11

7

1

4

1

96

Spain

8

10

8

5

5

3

4

3

5

19

21

4

95

10

3

7

5

9

8

5

8

9

8

8

8

88

Switzerland

2

10

10

7

8

1

2

4

9

12

6

9

80

Greece

3

12

12

12

13

4

8

5

2

5

1

77

France

17

12

13

3

1

2

1

3

4

3

59

Jordan

4

4

8

6

13

5

6

1

1

3

2

53

Lebanon

5

4

7

4

1

1

2

3

9

6

4

46

Egypt

1

3

5

6

4

2

1

2

2

2

28

Libya

2

4

3

4

3

Netherlands

5

1

3

551

449

Australia

Total

Business Intelligence

419

489

1

2

1

20

2
414

354

188

273

162

374

1
422

316

12

71

4,320

Powering Global Travel

Page 8 of 9
Market Summary - Statistics
Pseudo City: Muscat (MCT) @ 17 Nov 2013 for FIT
Averages YTD

Selection Criteria

Metric

Value

Selection

Value

Avg Allotment Usage

13%

Relative Year

Current Date

Avg Allotment Availability

87%

Date Range

1 Jan -17 Nov 2013 as-at Sun, 17 Nov 2013

Avg Length of Stay

2.53

City Type

Pseudo-city

Avg Room-nights

2.91

City

Muscat (MCT)

Hotel Name Initial

Any Initial

% Auto & DI : On-request Bookings 79% : 21%

Hotel

All Hotels

% Dynamic : Static Bookings

11% : 89%

Star

Any Star

% FIT : Group Bookings

100% : 0%

Business-type

FIT

Financial Metric

Supplier Cost

Currency

USD ($ USA Dollar)

Hotel Level

Property (Group of hotel codes)

Top N

20

Pages

Summary, Summary (Static), Summary (DI), Top Hotels, Booking Window,
Top Markets, Averages YTD

Avg Room Cost

$170

Report Details
Selection

Value

Run On

Tuesday, 19 November 2013 @ 06:54:56

Run By

Ibrahim Laham (GTA-DXB)

Report Version

v5 Aggregates - Burst - City clusters

Business Intelligence

Powering Global Travel

Page 9 of 9

More Related Content

Similar to Oman market summary

Macro Economic Analysis of Russia
Macro Economic Analysis of RussiaMacro Economic Analysis of Russia
Macro Economic Analysis of RussiaDhiraj Agarwal
 
Bekasi asri pemula tbk
Bekasi asri pemula tbkBekasi asri pemula tbk
Bekasi asri pemula tbkArga1693
 
May 2017 - Alberta Real Estate Benchmark and Economic Report
May 2017 - Alberta Real Estate Benchmark and Economic ReportMay 2017 - Alberta Real Estate Benchmark and Economic Report
May 2017 - Alberta Real Estate Benchmark and Economic ReportCalvert Home Mortgage
 
Monthly economic report real estate analysis benchmark - june 9 2017...
Monthly economic report   real estate analysis  benchmark - june 9 2017...Monthly economic report   real estate analysis  benchmark - june 9 2017...
Monthly economic report real estate analysis benchmark - june 9 2017...Dean Koeller
 
Alex Shaw III - Information Technology Portfolio
Alex Shaw III - Information Technology PortfolioAlex Shaw III - Information Technology Portfolio
Alex Shaw III - Information Technology PortfolioAlexShawIII
 
Dodo pizza monthly update - january 2019
Dodo pizza   monthly update - january 2019Dodo pizza   monthly update - january 2019
Dodo pizza monthly update - january 2019Kirill Vyrypaev
 
Table 17 rate of growth (% yoy) gdp and its component at current prices
Table 17 rate of growth (% yoy) gdp and its component at current pricesTable 17 rate of growth (% yoy) gdp and its component at current prices
Table 17 rate of growth (% yoy) gdp and its component at current pricesPadma Natarajan
 
Spring (77386) Home Sales Report - October 2015
Spring (77386) Home Sales Report - October 2015Spring (77386) Home Sales Report - October 2015
Spring (77386) Home Sales Report - October 2015Ken Brand
 
This is my scorecard, what I infer from my simplified worksheet (...)
This is my scorecard, what I infer from my simplified worksheet (...)This is my scorecard, what I infer from my simplified worksheet (...)
This is my scorecard, what I infer from my simplified worksheet (...)Giuseppe Piazzolla
 
Te dhena statistikore dhe analiza e tyre.
Te dhena statistikore dhe analiza e tyre.Te dhena statistikore dhe analiza e tyre.
Te dhena statistikore dhe analiza e tyre.Arsi Gest
 
iMPORTANT pRESENTATION.ppt
iMPORTANT pRESENTATION.pptiMPORTANT pRESENTATION.ppt
iMPORTANT pRESENTATION.pptshakeelabbas23
 
2019 05 Monthly Home Sales Stats for Calgary
2019 05 Monthly Home Sales Stats for Calgary2019 05 Monthly Home Sales Stats for Calgary
2019 05 Monthly Home Sales Stats for CalgaryJerry Charlton
 
Q1 2015 bta performance report may 5 media final
Q1 2015 bta performance report   may 5 media finalQ1 2015 bta performance report   may 5 media final
Q1 2015 bta performance report may 5 media finalPatricia Burchall
 
March 2015 Magnolia 77354 Home Sales Report
March 2015 Magnolia 77354 Home Sales ReportMarch 2015 Magnolia 77354 Home Sales Report
March 2015 Magnolia 77354 Home Sales ReportMichelle Greene
 
August 2015 - Market snapshot - General Overview
August 2015 - Market snapshot - General OverviewAugust 2015 - Market snapshot - General Overview
August 2015 - Market snapshot - General OverviewMLSListings Inc
 
Fundamental Equity Analysis - QMS Global Agriculture FlexIndex - The QMS Advi...
Fundamental Equity Analysis - QMS Global Agriculture FlexIndex - The QMS Advi...Fundamental Equity Analysis - QMS Global Agriculture FlexIndex - The QMS Advi...
Fundamental Equity Analysis - QMS Global Agriculture FlexIndex - The QMS Advi...BCV
 

Similar to Oman market summary (20)

Macro Economic Analysis of Russia
Macro Economic Analysis of RussiaMacro Economic Analysis of Russia
Macro Economic Analysis of Russia
 
Bekasi asri pemula tbk
Bekasi asri pemula tbkBekasi asri pemula tbk
Bekasi asri pemula tbk
 
May 2017 - Alberta Real Estate Benchmark and Economic Report
May 2017 - Alberta Real Estate Benchmark and Economic ReportMay 2017 - Alberta Real Estate Benchmark and Economic Report
May 2017 - Alberta Real Estate Benchmark and Economic Report
 
Monthly economic report real estate analysis benchmark - june 9 2017...
Monthly economic report   real estate analysis  benchmark - june 9 2017...Monthly economic report   real estate analysis  benchmark - june 9 2017...
Monthly economic report real estate analysis benchmark - june 9 2017...
 
December 2015 - Export Statistics of Turkish Citrus
December 2015 - Export Statistics of Turkish CitrusDecember 2015 - Export Statistics of Turkish Citrus
December 2015 - Export Statistics of Turkish Citrus
 
March 2015 - Export Statistics of Turkish Citrus
March 2015 - Export Statistics of Turkish CitrusMarch 2015 - Export Statistics of Turkish Citrus
March 2015 - Export Statistics of Turkish Citrus
 
Alex Shaw III - Information Technology Portfolio
Alex Shaw III - Information Technology PortfolioAlex Shaw III - Information Technology Portfolio
Alex Shaw III - Information Technology Portfolio
 
Dodo pizza monthly update - january 2019
Dodo pizza   monthly update - january 2019Dodo pizza   monthly update - january 2019
Dodo pizza monthly update - january 2019
 
Table 17 rate of growth (% yoy) gdp and its component at current prices
Table 17 rate of growth (% yoy) gdp and its component at current pricesTable 17 rate of growth (% yoy) gdp and its component at current prices
Table 17 rate of growth (% yoy) gdp and its component at current prices
 
Spring (77386) Home Sales Report - October 2015
Spring (77386) Home Sales Report - October 2015Spring (77386) Home Sales Report - October 2015
Spring (77386) Home Sales Report - October 2015
 
This is my scorecard, what I infer from my simplified worksheet (...)
This is my scorecard, what I infer from my simplified worksheet (...)This is my scorecard, what I infer from my simplified worksheet (...)
This is my scorecard, what I infer from my simplified worksheet (...)
 
Te dhena statistikore dhe analiza e tyre.
Te dhena statistikore dhe analiza e tyre.Te dhena statistikore dhe analiza e tyre.
Te dhena statistikore dhe analiza e tyre.
 
Links depreciation 2018
Links depreciation 2018Links depreciation 2018
Links depreciation 2018
 
iMPORTANT pRESENTATION.ppt
iMPORTANT pRESENTATION.pptiMPORTANT pRESENTATION.ppt
iMPORTANT pRESENTATION.ppt
 
Research_MSc
Research_MScResearch_MSc
Research_MSc
 
2019 05 Monthly Home Sales Stats for Calgary
2019 05 Monthly Home Sales Stats for Calgary2019 05 Monthly Home Sales Stats for Calgary
2019 05 Monthly Home Sales Stats for Calgary
 
Q1 2015 bta performance report may 5 media final
Q1 2015 bta performance report   may 5 media finalQ1 2015 bta performance report   may 5 media final
Q1 2015 bta performance report may 5 media final
 
March 2015 Magnolia 77354 Home Sales Report
March 2015 Magnolia 77354 Home Sales ReportMarch 2015 Magnolia 77354 Home Sales Report
March 2015 Magnolia 77354 Home Sales Report
 
August 2015 - Market snapshot - General Overview
August 2015 - Market snapshot - General OverviewAugust 2015 - Market snapshot - General Overview
August 2015 - Market snapshot - General Overview
 
Fundamental Equity Analysis - QMS Global Agriculture FlexIndex - The QMS Advi...
Fundamental Equity Analysis - QMS Global Agriculture FlexIndex - The QMS Advi...Fundamental Equity Analysis - QMS Global Agriculture FlexIndex - The QMS Advi...
Fundamental Equity Analysis - QMS Global Agriculture FlexIndex - The QMS Advi...
 

Recently uploaded

Integration and Automation in Practice: CI/CD in Mule Integration and Automat...
Integration and Automation in Practice: CI/CD in Mule Integration and Automat...Integration and Automation in Practice: CI/CD in Mule Integration and Automat...
Integration and Automation in Practice: CI/CD in Mule Integration and Automat...Patryk Bandurski
 
Understanding the Laravel MVC Architecture
Understanding the Laravel MVC ArchitectureUnderstanding the Laravel MVC Architecture
Understanding the Laravel MVC ArchitecturePixlogix Infotech
 
Salesforce Community Group Quito, Salesforce 101
Salesforce Community Group Quito, Salesforce 101Salesforce Community Group Quito, Salesforce 101
Salesforce Community Group Quito, Salesforce 101Paola De la Torre
 
Transcript: #StandardsGoals for 2024: What’s new for BISAC - Tech Forum 2024
Transcript: #StandardsGoals for 2024: What’s new for BISAC - Tech Forum 2024Transcript: #StandardsGoals for 2024: What’s new for BISAC - Tech Forum 2024
Transcript: #StandardsGoals for 2024: What’s new for BISAC - Tech Forum 2024BookNet Canada
 
How to Troubleshoot Apps for the Modern Connected Worker
How to Troubleshoot Apps for the Modern Connected WorkerHow to Troubleshoot Apps for the Modern Connected Worker
How to Troubleshoot Apps for the Modern Connected WorkerThousandEyes
 
Pigging Solutions in Pet Food Manufacturing
Pigging Solutions in Pet Food ManufacturingPigging Solutions in Pet Food Manufacturing
Pigging Solutions in Pet Food ManufacturingPigging Solutions
 
From Event to Action: Accelerate Your Decision Making with Real-Time Automation
From Event to Action: Accelerate Your Decision Making with Real-Time AutomationFrom Event to Action: Accelerate Your Decision Making with Real-Time Automation
From Event to Action: Accelerate Your Decision Making with Real-Time AutomationSafe Software
 
WhatsApp 9892124323 ✓Call Girls In Kalyan ( Mumbai ) secure service
WhatsApp 9892124323 ✓Call Girls In Kalyan ( Mumbai ) secure serviceWhatsApp 9892124323 ✓Call Girls In Kalyan ( Mumbai ) secure service
WhatsApp 9892124323 ✓Call Girls In Kalyan ( Mumbai ) secure servicePooja Nehwal
 
Injustice - Developers Among Us (SciFiDevCon 2024)
Injustice - Developers Among Us (SciFiDevCon 2024)Injustice - Developers Among Us (SciFiDevCon 2024)
Injustice - Developers Among Us (SciFiDevCon 2024)Allon Mureinik
 
[2024]Digital Global Overview Report 2024 Meltwater.pdf
[2024]Digital Global Overview Report 2024 Meltwater.pdf[2024]Digital Global Overview Report 2024 Meltwater.pdf
[2024]Digital Global Overview Report 2024 Meltwater.pdfhans926745
 
Presentation on how to chat with PDF using ChatGPT code interpreter
Presentation on how to chat with PDF using ChatGPT code interpreterPresentation on how to chat with PDF using ChatGPT code interpreter
Presentation on how to chat with PDF using ChatGPT code interpreternaman860154
 
FULL ENJOY 🔝 8264348440 🔝 Call Girls in Diplomatic Enclave | Delhi
FULL ENJOY 🔝 8264348440 🔝 Call Girls in Diplomatic Enclave | DelhiFULL ENJOY 🔝 8264348440 🔝 Call Girls in Diplomatic Enclave | Delhi
FULL ENJOY 🔝 8264348440 🔝 Call Girls in Diplomatic Enclave | Delhisoniya singh
 
08448380779 Call Girls In Friends Colony Women Seeking Men
08448380779 Call Girls In Friends Colony Women Seeking Men08448380779 Call Girls In Friends Colony Women Seeking Men
08448380779 Call Girls In Friends Colony Women Seeking MenDelhi Call girls
 
08448380779 Call Girls In Greater Kailash - I Women Seeking Men
08448380779 Call Girls In Greater Kailash - I Women Seeking Men08448380779 Call Girls In Greater Kailash - I Women Seeking Men
08448380779 Call Girls In Greater Kailash - I Women Seeking MenDelhi Call girls
 
The 7 Things I Know About Cyber Security After 25 Years | April 2024
The 7 Things I Know About Cyber Security After 25 Years | April 2024The 7 Things I Know About Cyber Security After 25 Years | April 2024
The 7 Things I Know About Cyber Security After 25 Years | April 2024Rafal Los
 
Factors to Consider When Choosing Accounts Payable Services Providers.pptx
Factors to Consider When Choosing Accounts Payable Services Providers.pptxFactors to Consider When Choosing Accounts Payable Services Providers.pptx
Factors to Consider When Choosing Accounts Payable Services Providers.pptxKatpro Technologies
 
Key Features Of Token Development (1).pptx
Key  Features Of Token  Development (1).pptxKey  Features Of Token  Development (1).pptx
Key Features Of Token Development (1).pptxLBM Solutions
 
Maximizing Board Effectiveness 2024 Webinar.pptx
Maximizing Board Effectiveness 2024 Webinar.pptxMaximizing Board Effectiveness 2024 Webinar.pptx
Maximizing Board Effectiveness 2024 Webinar.pptxOnBoard
 
How to Remove Document Management Hurdles with X-Docs?
How to Remove Document Management Hurdles with X-Docs?How to Remove Document Management Hurdles with X-Docs?
How to Remove Document Management Hurdles with X-Docs?XfilesPro
 
Handwritten Text Recognition for manuscripts and early printed texts
Handwritten Text Recognition for manuscripts and early printed textsHandwritten Text Recognition for manuscripts and early printed texts
Handwritten Text Recognition for manuscripts and early printed textsMaria Levchenko
 

Recently uploaded (20)

Integration and Automation in Practice: CI/CD in Mule Integration and Automat...
Integration and Automation in Practice: CI/CD in Mule Integration and Automat...Integration and Automation in Practice: CI/CD in Mule Integration and Automat...
Integration and Automation in Practice: CI/CD in Mule Integration and Automat...
 
Understanding the Laravel MVC Architecture
Understanding the Laravel MVC ArchitectureUnderstanding the Laravel MVC Architecture
Understanding the Laravel MVC Architecture
 
Salesforce Community Group Quito, Salesforce 101
Salesforce Community Group Quito, Salesforce 101Salesforce Community Group Quito, Salesforce 101
Salesforce Community Group Quito, Salesforce 101
 
Transcript: #StandardsGoals for 2024: What’s new for BISAC - Tech Forum 2024
Transcript: #StandardsGoals for 2024: What’s new for BISAC - Tech Forum 2024Transcript: #StandardsGoals for 2024: What’s new for BISAC - Tech Forum 2024
Transcript: #StandardsGoals for 2024: What’s new for BISAC - Tech Forum 2024
 
How to Troubleshoot Apps for the Modern Connected Worker
How to Troubleshoot Apps for the Modern Connected WorkerHow to Troubleshoot Apps for the Modern Connected Worker
How to Troubleshoot Apps for the Modern Connected Worker
 
Pigging Solutions in Pet Food Manufacturing
Pigging Solutions in Pet Food ManufacturingPigging Solutions in Pet Food Manufacturing
Pigging Solutions in Pet Food Manufacturing
 
From Event to Action: Accelerate Your Decision Making with Real-Time Automation
From Event to Action: Accelerate Your Decision Making with Real-Time AutomationFrom Event to Action: Accelerate Your Decision Making with Real-Time Automation
From Event to Action: Accelerate Your Decision Making with Real-Time Automation
 
WhatsApp 9892124323 ✓Call Girls In Kalyan ( Mumbai ) secure service
WhatsApp 9892124323 ✓Call Girls In Kalyan ( Mumbai ) secure serviceWhatsApp 9892124323 ✓Call Girls In Kalyan ( Mumbai ) secure service
WhatsApp 9892124323 ✓Call Girls In Kalyan ( Mumbai ) secure service
 
Injustice - Developers Among Us (SciFiDevCon 2024)
Injustice - Developers Among Us (SciFiDevCon 2024)Injustice - Developers Among Us (SciFiDevCon 2024)
Injustice - Developers Among Us (SciFiDevCon 2024)
 
[2024]Digital Global Overview Report 2024 Meltwater.pdf
[2024]Digital Global Overview Report 2024 Meltwater.pdf[2024]Digital Global Overview Report 2024 Meltwater.pdf
[2024]Digital Global Overview Report 2024 Meltwater.pdf
 
Presentation on how to chat with PDF using ChatGPT code interpreter
Presentation on how to chat with PDF using ChatGPT code interpreterPresentation on how to chat with PDF using ChatGPT code interpreter
Presentation on how to chat with PDF using ChatGPT code interpreter
 
FULL ENJOY 🔝 8264348440 🔝 Call Girls in Diplomatic Enclave | Delhi
FULL ENJOY 🔝 8264348440 🔝 Call Girls in Diplomatic Enclave | DelhiFULL ENJOY 🔝 8264348440 🔝 Call Girls in Diplomatic Enclave | Delhi
FULL ENJOY 🔝 8264348440 🔝 Call Girls in Diplomatic Enclave | Delhi
 
08448380779 Call Girls In Friends Colony Women Seeking Men
08448380779 Call Girls In Friends Colony Women Seeking Men08448380779 Call Girls In Friends Colony Women Seeking Men
08448380779 Call Girls In Friends Colony Women Seeking Men
 
08448380779 Call Girls In Greater Kailash - I Women Seeking Men
08448380779 Call Girls In Greater Kailash - I Women Seeking Men08448380779 Call Girls In Greater Kailash - I Women Seeking Men
08448380779 Call Girls In Greater Kailash - I Women Seeking Men
 
The 7 Things I Know About Cyber Security After 25 Years | April 2024
The 7 Things I Know About Cyber Security After 25 Years | April 2024The 7 Things I Know About Cyber Security After 25 Years | April 2024
The 7 Things I Know About Cyber Security After 25 Years | April 2024
 
Factors to Consider When Choosing Accounts Payable Services Providers.pptx
Factors to Consider When Choosing Accounts Payable Services Providers.pptxFactors to Consider When Choosing Accounts Payable Services Providers.pptx
Factors to Consider When Choosing Accounts Payable Services Providers.pptx
 
Key Features Of Token Development (1).pptx
Key  Features Of Token  Development (1).pptxKey  Features Of Token  Development (1).pptx
Key Features Of Token Development (1).pptx
 
Maximizing Board Effectiveness 2024 Webinar.pptx
Maximizing Board Effectiveness 2024 Webinar.pptxMaximizing Board Effectiveness 2024 Webinar.pptx
Maximizing Board Effectiveness 2024 Webinar.pptx
 
How to Remove Document Management Hurdles with X-Docs?
How to Remove Document Management Hurdles with X-Docs?How to Remove Document Management Hurdles with X-Docs?
How to Remove Document Management Hurdles with X-Docs?
 
Handwritten Text Recognition for manuscripts and early printed texts
Handwritten Text Recognition for manuscripts and early printed textsHandwritten Text Recognition for manuscripts and early printed texts
Handwritten Text Recognition for manuscripts and early printed texts
 

Oman market summary

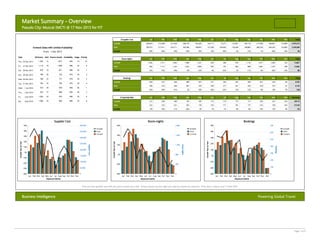
  • 1. Market Summary - Overview Pseudo City: Muscat (MCT) @ 17 Nov 2013 for FIT $ Supplier Cost Mar Apr May Jun Jul Aug Sep Oct Nov Dec Total 313,068 327,420 248,145 192,266 139,117 73,275 133,061 166,119 277,968 186,861 114,084 2,410,219 185,075 217,411 254,711 356,386 148,855 121,509 104,692 136,269 148,885 280,254 264,343 135,893 2,354,284 29% 44% 29% -30% 29% 14% -30% -2% 12% -1% -29% -16% 2% Growth From 1 Dec 2013 Date Feb 238,834 Prior Forward Dates with Limited Availability Jan Current All Rooms Sold Rooms Unsold Availability Usage Priority Thu, 26 Dec 2013 1,042 15 1,027 99% 1% Fri, Room-nights 10 Jan Feb Mar Apr May Jun Jul Aug Sep Oct Nov Dec Total 1,302 Current 1,711 1,855 1,480 1,231 939 506 919 1,110 1,417 1,004 353 13,827 27 Dec 2013 1,116 18 1,098 98% 2% 9 Prior 962 1,117 1,335 1,632 1,009 907 741 904 998 1,481 1,357 399 12,842 Sat, 28 Dec 2013 870 19 851 98% 2% 7 Growth 35% 53% 39% -9% 22% 4% -32% 2% 11% -4% -26% -12% 8% Sun, 29 Dec 2013 780 26 754 97% 3% 3 Mon, 30 Dec 2013 780 23 757 97% 3% 5 Jan Feb Mar Apr May Jun Jul Aug Sep Oct Nov Dec Total 458 537 626 489 447 371 204 293 399 451 344 83 4,702 Tue, 31 Dec 2013 785 25 760 97% 3% 4 Wed, 1 Jan 2014 916 38 878 96% 4% 1 Thu, 2 Jan 2014 925 37 888 96% 4% 2 Fri, 3 Jan 2014 1,003 24 979 98% 2% 6 Sat, 4 Jan 2014 1,006 20 986 98% 2% Bookings Current 8 Prior 346 414 444 481 379 294 271 261 356 418 375 81 4,120 Growth 32% 30% 41% 2% 18% 26% -25% 12% 12% 8% -8% 2% 14% Jan Feb Mar Apr May Jun Jul Aug Sep Oct Nov Dec Summary Current $ Avg Daily Rate 212 209 206 195 185 175 170 173 177 236 225 414 205.76 Prior 232 233 231 263 178 163 171 181 177 216 199 416 215.69 Growth -9% -10% -11% -26% 4% 7% -1% -4% 0% 10% 13% 0% -5% Supplier Cost Room-nights 400,000 40% 350,000 0% 150,000 -10% 100,000 -20% Growth Year on Year 200,000 1,600 20% 1,200 0% 800 -20% 400 50,000 -30% Jan Feb Mar Apr May Jun Jul Aug Sep Oct Nov Dec Departure Month 0 Growth Prior Current 700 40% 30% 500 20% 400 10% 300 0% 200 -10% 100 -20% -40% Jan Feb Mar Apr May Jun Jul Aug Sep Oct Nov Dec Departure Month 0 Growth Prior Current 600 Bookings 10% 50% Room-nights 250,000 Bookings 2,000 40% 300,000 20% -40% Growth Prior Current Supplier Cost Growth Year on Year 30% 60% Growth Year on Year 50% -30% Jan Feb Mar Apr May Jun Jul Aug Sep Oct Nov Dec 0 Departure Month Year-on-Year growth uses left axis and is shown by a line. Actual values use the right axis and are shown by columns. Prior year's values as at 17 Nov 2012 Business Intelligence Powering Global Travel Page 1 of 9
  • 2. Hotel Summary - Overview (Static) Pseudo City: Muscat (MCT) @ 17 Nov 2013 for FIT $ Supplier Cost 320,000 Growth Prior Current 280,000 40% 20% 200,000 0% 160,000 120,000 -20% Apr May Jun Jul Aug Sep Oct Nov Dec Total 254,959 212,858 183,417 126,185 64,800 114,441 135,716 183,831 133,268 96,815 1,944,564 131,605 175,848 232,195 298,724 130,149 116,737 91,646 127,232 119,770 230,804 222,201 107,672 1,984,582 40% 45% 10% -29% 41% 8% -29% -10% 13% -20% -40% -10% -2% Growth Room-nights Jan Apr May Jun Jul Aug Sep Oct Nov Dec Total 1,619 1,339 1,185 873 461 833 964 1,125 816 299 12,158 773 965 1,255 1,447 914 879 659 852 877 1,311 1,214 322 11,468 45% 58% 29% -7% 30% -1% -30% -2% 10% -14% -33% -7% 6% Jan Feb Mar Apr May Jun Jul Aug Sep Oct Nov Dec Total 403 485 549 436 431 344 184 259 348 365 297 68 4,169 Bookings Current Prior 280 364 409 425 338 275 243 240 316 375 330 71 3,666 Growth 44% 33% 34% 3% 28% 25% -24% 8% 10% -3% -10% -4% 14% 40,000 Jul Aug Sep Oct Nov Dec Jan Feb Mar Apr May Jun Jul Aug Sep Oct Nov Dec Summary Current $ Avg Daily Rate 188 188 184 186 183 171 166 167 167 200 197 421 188.96 Prior 209 218 225 250 173 162 170 180 161 199 183 412 203.92 -10% -14% -18% -26% 6% 6% -2% -7% 3% 0% 8% 2% -7% 0 Room-nights Bookings 1,800 50% Growth Prior Current 1,600 60% 1,400 40% 600 400 -20% Jan Feb Mar Apr May Jun Jul Aug Sep Oct Nov Dec Departure Month 400 10% 300 0% 200 -10% 0 -30% 300 -5% 250 -10% 200 -15% 150 -20% 100 -20% Jan Feb Mar Apr May Jun Jul Aug Sep Oct Nov Dec Departure Month 0 100 -25% -30% Growth Prior Current 350 0% 20% 200 400 Bookings 0% 500 450 5% Growth Prior Current Bookings 800 Room-nights 20% 10% 30% 1,200 1,000 Avg Daily Room Cost 600 40% Growth Year on Year 80% Growth Year on Year Jan Feb Mar Apr May Jun Growth Growth Year on Year Mar 1,527 Growth Departure Month -40% Feb 1,117 Prior 80,000 -40% -60% Mar 254,233 Current Supplier Cost Growth Year on Year 240,000 Feb 184,040 Prior Supplier Cost 60% Jan Current 50 Jan Feb Mar Apr May Jun Jul Aug Sep Oct Nov Dec 0 Departure Month Year-on-Year growth uses left axis and is shown by a line. Actual values use the right axis and are shown by columns. Prior year's values as at 17 Nov 2012 Business Intelligence Powering Global Travel Page 2 of 9
  • 3. Hotel Summary - Overview (DI) Pseudo City: Muscat (MCT) @ 17 Nov 2013 for FIT $ Supplier Cost 100,000 Growth Prior Current 200% Mar Apr May Jun Jul Aug Sep Oct Nov Dec Total 58,835 72,462 35,287 8,849 12,932 8,475 18,620 30,403 94,137 53,593 17,269 465,655 53,470 41,563 22,517 57,662 18,706 4,772 13,047 9,038 29,116 49,450 42,142 28,221 369,702 2% 42% 222% -39% -53% 171% -35% 106% 4% 90% 27% -39% 26% Growth 80% Mar Apr May Jun Jul Aug Sep Oct Nov Dec Total 184 236 141 46 66 45 86 146 292 188 54 1,669 189 152 80 185 95 28 82 52 121 170 143 77 1,374 Growth Supplier Cost 60,000 Feb 185 Prior 120% Jan Current 80,000 160% Growth Year on Year Feb 54,793 Prior Supplier Cost 240% Jan Current Room-nights -2% 21% 195% -24% -52% 136% -45% 65% 21% 72% 31% -30% 21% Bookings 20,000 Feb Mar Apr May Jun Jul Aug Sep Oct Nov Dec Total 55 52 77 53 16 27 20 34 51 86 47 15 533 Prior 0% Jan Current 40,000 40% 66 50 35 56 41 19 28 21 40 43 45 10 454 -17% 4% 120% -5% -61% 42% -29% 62% 28% 100% 4% 50% 17% Growth -40% Jan Feb Mar Apr May Jun Jan Feb Mar Apr May Jun Jul Aug Sep Oct Nov Dec Summary Current 356 381 358 290 229 224 209 238 244 379 345 375 328.20 Prior Jul Aug Sep Oct Nov Dec $ Avg Daily Rate 327 325 321 365 225 192 182 196 286 344 342 431 313.96 9% 17% 11% -21% 2% 17% 15% 21% -15% 10% 1% -13% 5% 0 Departure Month Growth Room-nights Bookings 240 120% 200 80% 160 40% 120 0% 80 -40% 40 -80% Jan Feb Mar Apr May Jun Jul Aug Sep Oct Nov Dec Departure Month 0 Growth Prior Current 120% Growth Year on Year 160% Growth Year on Year 280 Avg Daily Room Cost 100 25% 80 80% 60 40% 40 0% 450 20% Growth Prior Current 400 15% 350 10% 300 5% 250 0% 200 -5% 150 -10% 20 -40% 100 -15% 50 -20% -80% Jan Feb Mar Apr May Jun Jul Aug Sep Oct Nov Dec Departure Month 0 -25% Growth Prior Current Bookings 200% 160% Bookings 320 Room-nights 240% Growth Year on Year -80% Jan Feb Mar Apr May Jun Jul Aug Sep Oct Nov Dec 0 Departure Month Year-on-Year growth uses left axis and is shown by a line. Actual values use the right axis and are shown by columns. Prior year's values as at 17 Nov 2012 Business Intelligence Powering Global Travel Page 3 of 9
  • 4. Market Summary - Top Hotels Pseudo City: Muscat (MCT) @ 17 Nov 2013 for FIT Full Calendar Year 2013 $Supplier Cost Mar Apr May Jun Jul Aug Sep Oct Nov Dec Total 35,790 37,227 41,733 33,628 21,656 11,536 21,799 16,624 41,049 19,137 15,502 331,583 23,178 38,765 64,522 31,551 26,777 8,556 4,927 5,622 10,427 26,252 17,730 10,664 268,971 Shangri La Muscat (MCT_SHAC) 12,049 18,477 21,268 8,969 3,852 6,200 5,812 13,619 17,629 53,494 32,651 6,997 201,015 Crowne Plaza (MCT_CRO) Top Hotels YTD Feb 35,903 Intercontinental (MCT_INT) Top Hotels YTD Jan Grand Hyatt (MCT_GRA) 18,986 35,587 27,833 22,868 7,964 10,201 6,033 5,059 19,998 13,179 12,602 8,032 188,342 The Chedi (MCT_THE) 24,470 30,448 14,647 9,036 21,613 5,923 12,745 10,434 12,660 11,086 7,639 5,821 166,521 City Seasons (MCT_CIT) 24,219 31,103 25,974 17,996 9,540 12,307 5,232 6,736 14,556 11,030 5,876 867 165,435 Al Bustan Palace (MCT_ALB) 17,131 13,766 17,029 6,890 7,761 9,670 1,816 5,486 875 22,207 13,511 28,873 145,017 Park Inn (MCT_PAR1) 12,692 8,203 9,295 26,870 8,522 5,836 2,559 3,380 5,403 2,009 10,164 6,795 2,973 10,346 6,078 4,146 9,711 2,109 11,133 9,791 13,453 2,517 1,904 80,955 6,111 12,401 7,507 9,634 6,231 2,811 4,581 6,576 8,783 6,276 3,693 74,603 1,618 15,460 16,382 6,504 5,443 2,719 3,421 3,945 9,206 2,084 4,038 331 71,151 10,258 8,062 7,622 11,669 7,608 2,878 2,317 2,712 3,572 5,081 3,956 1,273 67,009 330 5,177 14,952 4,016 758 9,330 8,665 9,034 5,153 1,164 63,860 5,620 4,465 7,452 1,718 2,109 1,284 4,041 14,422 6,894 644 59,393 5,106 3,966 2,267 6,868 7,667 8,248 8,999 930 44,052 839 3,489 2,975 5,944 1,951 43,617 3,979 249 4,745 4,726 481 481 3,406 2,912 1,000 249 2,691 City Seasons (MCT_CIT) 5% 4% 4% 3% 6% Grand Hyatt (MCT_GRA) Intercontinental (MCT_INT) Millenium Resort Mussanah (MCT_MI... Shangri La Muscat (MCT_SHAC) 3% 3% Crowne Plaza (MCT_CRO) Golden Tulip Seeb (MCT_SEE) 2% 2% 6% 2% 6% 2% 6% Park Inn (MCT_PAR1) Tulip Inn Muscat (MCT_TUL) 2% Ibis (MCT_IBI) The Chedi (MCT_THE) Golden Oasis (MCT_GOL3) Best Western Premier Muscat (MCT_... 11% Radisson Blu (MCT_RAD) Al Bustan Palace (MCT_ALB) Millenium Resort Mussanah (MCT_MIL) Radisson Blu (MCT_RAD) Golden Tulip Seeb (MCT_SEE) Tulip Inn Muscat (MCT_TUL) Shangrila Al Waha (MCT_SHA2) 5,282 Ibis (MCT_IBI) 1,625 9,118 94,934 Muscat Holiday Hotel (MCT_HOL) Shangrila Al Waha (MCT_SHA2) 9,659 5,860 4,052 7,074 1,775 Muscat Holiday Hotel (MCT_HOL) 5,180 3,049 2,782 3,052 2,468 3,159 1,182 6,549 4,297 3,185 481 384 96 Waves International (MCT_WAV) 2,509 8,374 4,684 2,592 2,010 514 Golden Oasis (MCT_GOL3) 10% 9% Ramada Qurum Beach (MCT_RAM) Haffa House (MCT_HAF) 7% Best Western Premier Muscat (MCT_94) Waves International (MCT_WAV) Haffa House (MCT_HAF) 6% 4,813 1,762 4,161 2,400 592 595 229 1,270 807 2,325 1,956 455 21,365 217,550 279,458 290,473 225,614 179,315 117,734 67,290 118,555 152,966 257,551 172,680 90,102 2,169,288 Ramada Qurum Beach (MCT_RAM) Room-nights Total Top Hotels YTD Room-nights RN % Share Bookings $Supplier Cost City Seasons (MCT_CIT) 1,210 11% 392 162,328 Grand Hyatt (MCT_GRA) 1,120 10% 391 314,039 Intercontinental (MCT_INT) Room-nights 33,389 24,453 23,625 Jan Feb Mar Apr May Jun Jul Aug Sep Oct Nov Dec Total City Seasons (MCT_CIT) 184 230 191 136 70 94 40 50 109 78 45 7 1,234 Grand Hyatt (MCT_GRA) 107 108 108 122 163 114 58 117 52 120 57 27 1,153 Intercontinental (MCT_INT) 77 138 221 129 146 42 27 31 39 99 71 43 1,063 Millenium Resort Mussanah (MCT_MIL) 61 26 87 58 67 127 37 99 124 93 21 11 811 Shangri La Muscat (MCT_SHAC) 52 60 73 35 22 36 33 62 97 183 108 26 787 70,595 Crowne Plaza (MCT_CRO) 75 129 113 93 43 53 29 25 72 49 47 25 753 271 94,496 Golden Tulip Seeb (MCT_SEE) 13 140 164 67 59 31 38 39 101 16 33 2 703 6% 229 64,507 Tulip Inn Muscat (MCT_TUL) 99 75 79 118 76 29 26 25 39 53 43 11 673 602 5% 229 57,377 Park Inn (MCT_PAR1) 93 58 65 193 61 40 18 25 37 14 68 The Chedi (MCT_THE) 489 4% 119 157,502 Ibis (MCT_IBI) 17 91 59 48 82 18 23 14 41 152 71 8 624 Golden Oasis (MCT_GOL3) 422 4% 147 20,048 The Chedi (MCT_THE) 56 63 32 27 95 24 59 45 54 24 16 9 504 Radisson Blu (MCT_RAD) 385 3% 192 68,145 Golden Oasis (MCT_GOL3) 95 37 89 53 13 12 5 29 18 48 41 10 450 Best Western Premier Muscat (MCT_94) 385 3% 145 40,961 Radisson Blu (MCT_RAD) 33 67 41 54 41 18 29 36 47 34 20 420 Al Bustan Palace (MCT_ALB) 291 3% 93 110,793 45 35 23 74 76 72 78 8 411 Muscat Holiday Hotel (MCT_HOL) 269 2% 77 31,323 Al Bustan Palace (MCT_ALB) 41 24 31 12 30 51 8 32 4 35 37 52 357 Shangrila Al Waha (MCT_SHA2) 267 2% 73 62,697 Muscat Holiday Hotel (MCT_HOL) 38 23 21 23 25 32 47 3 36 38 Waves International (MCT_WAV) 258 2% 81 23,625 Shangrila Al Waha (MCT_SHA2) 18 1 20 71 22 48 40 26 17 4 271 Haffa House (MCT_HAF) 244 2% 90 23,452 Ramada Qurum Beach (MCT_RAM) 56 36 24 41 11 6 24 18 35 11 262 Ramada Qurum Beach (MCT_RAM) 227 2% 81 37,618 Waves International (MCT_WAV) 28 90 50 29 3 28 Haffa House (MCT_HAF) 13 71 45 34 1,123 1,432 1,520 Jan Feb 62 59 1,001 9% 376 253,446 Millenium Resort Mussanah (MCT_MIL) 788 7% 224 77,649 Shangri La Muscat (MCT_SHAC) 716 6% 214 182,245 Crowne Plaza (MCT_CRO) 708 6% 251 175,217 Golden Tulip Seeb (MCT_SEE) 699 6% 268 Park Inn (MCT_PAR1) 669 6% Tulip Inn Muscat (MCT_TUL) 649 Ibis (MCT_IBI) Best Western Premier Muscat (MCT_94) Total Bookings City Seasons (MCT_CIT) 4 672 286 24 6 5 4 1 5 5 32 29 10 258 254 1,279 1,138 829 453 802 974 1,223 889 284 11,946 Mar Apr May Jun Jul Aug Sep Oct Nov Dec Total 59 47 24 24 18 13 46 32 15 2 401 Page 4 of 9
  • 5. Market Summary - Top Hotels FIT Full Calendar Year 2013 Jan Feb Mar Apr May Jun Jul Aug Sep Oct Nov Dec Total Grand Hyatt (MCT_GRA) Bookings 39 41 46 40 52 33 22 31 25 42 21 4 396 Intercontinental (MCT_INT) 37 51 83 54 41 22 13 10 15 37 22 8 393 Park Inn (MCT_PAR1) 38 26 29 63 27 15 13 13 17 8 24 8 41 50 30 26 26 12 16 35 11 14 2 271 Crowne Plaza (MCT_CRO) 28 32 37 30 18 23 13 12 25 18 22 7 265 Tulip Inn Muscat (MCT_TUL) 39 24 33 25 31 10 10 12 14 21 15 2 236 8 32 19 25 27 7 9 10 18 51 27 2 235 Shangri La Muscat (MCT_SHAC) 15 19 25 8 5 13 11 22 32 47 26 8 231 Millenium Resort Mussanah (MCT_MIL) 12 9 25 11 30 48 11 28 26 22 3 4 229 20 28 21 26 29 7 15 18 15 20 6 205 16 20 15 6 8 3 14 9 16 15 3 157 18 12 16 19 33 26 30 2 156 Golden Tulip Seeb (MCT_SEE) Ibis (MCT_IBI) Radisson Blu (MCT_RAD) Golden Oasis (MCT_GOL3) 32 Best Western Premier Muscat (MCT_94) 273 10 16 5 4 23 15 11 12 17 3 5 2 123 Al Bustan Palace (MCT_ALB) 9 5 10 2 14 19 4 7 3 11 13 7 104 Haffa House (MCT_HAF) 7 14 21 11 3 2 1 1 2 16 12 3 93 Ramada Qurum Beach (MCT_RAM) 8 17 9 16 7 3 11 7 9 4 91 Waves International (MCT_WAV) 7 27 19 9 3 7 10 3 9 11 7 8 6 2 12 11 1 5 24 11 2 13 8 4 3 1 74 528 427 409 331 179 257 359 406 307 67 4,093 The Chedi (MCT_THE) Muscat Holiday Hotel (MCT_HOL) Shangrila Al Waha (MCT_SHA2) Total Business Intelligence 2 371 452 6 3 81 79 Powering Global Travel Page 5 of 9
  • 6. Market Summary - Booking Window Pseudo City: Muscat (MCT) @ 17 Nov 2013 for FIT Full Calendar Year 2013 $Supplier Cost Jan Feb Mar Apr May Jun Jul Aug Sep Oct Nov 10,378 11,630 11,662 13,930 13,129 8,257 7,180 3,137 13,022 8,740 6,248 107,313 1-5 110,407 149,252 156,977 119,532 91,085 80,018 40,585 57,128 82,693 116,440 63,285 1,067,401 6 - 10 38,147 42,948 37,716 28,811 23,099 19,803 7,910 20,798 19,243 41,235 24,092 11 - 20 30,407 46,459 42,309 43,340 30,302 17,559 8,763 14,358 22,506 36,871 26,639 3,940 323,454 21 - 30 14,955 13,393 22,256 17,700 16,961 5,920 1,312 14,631 7,205 19,364 24,947 3,518 162,164 31 - 50 15,286 29,846 28,555 13,764 9,525 3,277 2,439 9,016 10,001 17,880 14,344 50,244 204,176 Same Day 31 - 50 51 - 70 9,341 2,172 11,409 4,915 1,031 2,869 2,560 6,534 5,969 5,511 2,401 14,561 69,272 70 + 9,912 17,368 16,536 6,153 6,861 1,414 2,099 7,460 5,479 31,398 24,905 41,821 171,406 21 - 30 Total 238,834 313,068 327,420 248,145 191,993 139,117 72,846 133,061 166,119 277,438 186,861 114,084 2,408,988 Jan Feb Mar Apr May Jun Jul Aug Sep Oct Nov Dec Total 79 89 88 86 94 55 52 30 94 78 38 783 1-5 666 915 942 779 630 504 295 382 539 690 358 6,700 6 - 10 165 208 203 161 135 147 46 137 117 212 160 11 - 20 147 193 226 238 159 121 67 106 132 164 159 12 1,724 21 - 30 75 83 119 84 101 46 8 99 60 63 100 20 858 31 - 50 49 146 131 66 60 31 10 56 94 81 87 138 949 51 - 70 35 11 76 35 8 17 16 38 35 14 15 59 359 70 + 86 66 70 31 41 18 11 71 39 109 87 124 753 Total 1,302 1,711 1,855 1,480 1,228 939 505 919 1,110 1,411 1,004 353 13,817 Jan Feb Mar Apr May Jun Jul Aug Sep Oct Nov Dec Total 36 31 36 36 43 33 23 15 38 37 17 345 2,559 Same Day Booking Window last 12-Month Days 1-5 13% 6% 6 - 10 11 - 20 7% 6% 5% 12% 3% 70 + 51 - 70 Room-nights Same Day 48% Room-nights Lead Time 12-Month Room-nights RN % Share Bookings % Share $Supplier Cost Dec Total 303,802 1,691 1-5 6,669 48% 2,551 54% 1062805 11 - 20 1,735 13% 496 11% 320707 6 - 10 1,704 12% 582 12% 306798 Same Day 31 - 50 926 7% 218 5% 200011 1-5 257 315 348 284 263 201 126 139 222 245 159 21 - 30 863 6% 216 5% 165139 6 - 10 60 74 80 58 46 61 14 43 40 60 51 Same Day 783 6% 345 7% 107313 11 - 20 29 51 74 61 44 43 24 28 43 49 49 3 498 70 + 710 5% 170 4% 162193 21 - 30 21 19 29 19 25 12 4 20 17 14 29 6 215 51 - 70 452 3% 109 2% 100682 31 - 50 20 27 32 17 14 8 2 20 14 21 18 28 221 51 - 70 11 4 13 8 2 7 5 11 11 3 3 14 92 70 + 24 16 14 6 9 6 5 17 14 21 18 32 182 Total 458 537 626 489 446 371 203 293 399 450 344 83 4,699 Business Intelligence Bookings 587 Powering Global Travel Page 6 of 9
  • 7. Market Summary - Top Markets Pseudo City: Muscat (MCT) @ 17 Nov 2013 for FIT Full Calendar Year 2013 Jan Feb Mar Apr May Jun Jul Aug Sep Oct Nov Dec Total United Arab Emirates $Supplier Cost 59,288 81,401 89,763 70,878 52,163 51,551 26,072 30,134 62,125 91,467 45,715 4,151 664,707 United Kingdom 40,140 69,900 50,940 52,009 38,631 11,748 9,823 22,811 13,703 53,247 45,752 22,242 430,946 Saudi Arabia 15,018 10,819 20,632 16,653 10,199 17,149 1,620 11,271 12,603 18,897 5,900 Italy 17,752 7,881 6,991 4,737 3,953 6,730 515 5,763 7,666 5,304 10,914 26,870 105,077 488 13,394 15,280 2,656 7,399 390 2,350 994 7,926 15,371 11,280 24,982 102,511 Qatar 9,456 16,003 12,244 7,249 9,887 12,419 2,732 7,436 3,093 12,000 7,771 India 8,728 15,290 11,787 7,534 4,340 3,475 3,510 7,495 3,864 5,713 6,844 Turkey 3,133 7,855 4,816 6,432 4,288 3,160 2,984 8,232 7,837 13,713 9,968 Bahrain 6,671 3,166 6,484 7,932 8,532 5,233 2,784 8,722 10,099 10,939 2,944 Kuwait 4,685 7,004 5,336 5,160 6,055 3,666 1,626 9,185 3,571 5,782 291 2,030 54,390 11,309 1,297 3,792 2,961 7,570 1,511 2,291 5,148 3,266 6,592 4,190 4,119 54,047 Spain 3,555 4,610 5,192 1,938 1,689 3,194 2,519 1,623 4,431 6,892 7,955 9,374 52,974 Australia Greece 1,346 9,983 5,833 11,657 7,702 2,398 2,647 2,995 798 838 274 46,470 Switzerland France France 10,927 6,901 8,304 2,291 688 860 1,896 564 556 10,347 43,334 Oman 4,530 1,288 2,893 6,355 5,626 1,228 494 2,224 1,667 2,494 1,278 286 30,361 Lebanon 3,235 4,687 1,900 945 338 249 736 239 4,527 3,646 1,637 22,141 732 2,903 6,268 3,397 948 2,763 533 1,518 466 1,701 21,229 Jordan 1,466 1,623 3,915 2,424 4,121 2,223 1,331 273 97 1,473 1,465 20,410 Libya 1,669 4,417 5,608 2,348 1,416 662 675 Netherlands 5,392 821 4,260 Top Markets YTD Market YTD United Arab Emirates 4% 6% 4% United Kingdom Saudi Arabia 4% 4% 4% 3% 2% 2% 2% 2% 1% 2% 1% 1% 1% 1% 1% Qatar Turkey Bahrain India Italy Kuwait Spain Greece 18% 36% Oman Jordan Switzerland Australia Egypt Room-nights Market YTD Room-nights RN % Share Bookings $Supplier Cost Total United Arab Emirates 4,293 36% 1,892 2,133 18% 589 395,585 Saudi Arabia 738 6% 234 140,445 Qatar 479 4% 162 100,290 Turkey 457 4% 142 68,173 Bahrain 456 4% 165 73,057 India 452 4% 159 76,864 Italy 435 4% 121 76,905 Kuwait 318 3% 101 52,070 Spain 277 2% 82 38,764 Greece 274 2% 75 45,910 Australia 257 2% 79 48,525 Switzerland 250 2% 67 70,902 France 196 2% 56 32,987 Oman 174 1% 92 29,109 Australia Jordan 153 1% 53 20,410 Lebanon 138 1% 45 Egypt 136 1% Libya 108 97 268,800 219,815 175,546 129,947 78,581 2,530 65,231 125,219 151,377 74,948 73,507 17,413 348 12,308 2,146,405 255,976 167,001 107,553 651,655 United Kingdom 270,421 100,290 618 1,487 209,520 140,761 Netherlands Jan Feb Mar Apr May Jun Jul Aug Sep Oct Nov Dec Total United Arab Emirates Room-nights 359 512 542 477 380 374 189 215 439 577 281 24 4,369 United Kingdom 85 2,273 221 314 291 246 231 105 61 173 116 227 203 Saudi Arabia 82 58 128 80 43 81 12 76 70 81 32 Italy 72 58 40 29 25 40 4 33 50 27 67 64 509 Turkey 17 51 38 53 37 22 28 65 56 69 40 7 483 Qatar 37 86 52 28 55 60 15 51 26 37 32 479 India 56 64 58 43 31 27 27 53 28 36 43 466 Bahrain 54 21 40 48 54 36 17 56 55 62 17 Spain 29 40 44 14 8 25 15 10 19 45 60 26 335 Kuwait 33 42 39 30 33 30 13 44 23 31 4 8 330 3 44 42 16 33 2 12 7 38 40 37 47 321 36 14 21 16 42 10 10 25 33 31 31 25 294 Greece 5 53 27 74 49 17 16 20 8 6 4 279 21,958 France 47 41 71 10 5 6 5 4 7 23 219 28 21,229 Oman 26 14 13 49 28 9 3 17 10 4 7 2 182 1% 20 17,413 Jordan 7 11 31 17 38 13 12 3 1 13 7 153 1% 11 11,960 Lebanon 17 15 16 11 2 4 6 3 32 20 13 139 Egypt 2 15 31 37 11 11 6 15 3 5 136 Libya 13 24 21 15 17 Netherlands 38 3 41 1,548 1,334 Switzerland Total 1,154 1,477 4 12 872 450 863 460 2 108 15 1,122 743 1,031 2 1,317 892 99 317 12,377 Page 7 of 9
  • 8. Bookings Jan Feb Mar Apr May Jun Jul Aug Sep Oct Nov Dec Total United Arab Emirates 169 203 245 208 195 191 90 98 196 193 128 7 1,923 United Kingdom 71 88 84 66 59 28 20 34 31 69 56 20 626 Saudi Arabia 21 23 38 21 18 21 9 27 28 17 13 236 Bahrain 21 9 13 17 18 13 9 18 20 22 6 166 India 17 19 26 16 11 12 6 11 14 12 18 162 Qatar 14 29 20 12 14 19 8 12 11 13 10 Turkey 7 15 17 15 12 12 8 17 14 17 14 3 151 Italy 16 19 14 10 8 12 3 10 8 10 14 11 135 Kuwait 10 12 12 12 11 12 4 9 7 12 1 3 105 Oman 16 10 8 17 11 8 2 11 7 1 4 1 96 Spain 8 10 8 5 5 3 4 3 5 19 21 4 95 10 3 7 5 9 8 5 8 9 8 8 8 88 Switzerland 2 10 10 7 8 1 2 4 9 12 6 9 80 Greece 3 12 12 12 13 4 8 5 2 5 1 77 France 17 12 13 3 1 2 1 3 4 3 59 Jordan 4 4 8 6 13 5 6 1 1 3 2 53 Lebanon 5 4 7 4 1 1 2 3 9 6 4 46 Egypt 1 3 5 6 4 2 1 2 2 2 28 Libya 2 4 3 4 3 Netherlands 5 1 3 551 449 Australia Total Business Intelligence 419 489 1 2 1 20 2 414 354 188 273 162 374 1 422 316 12 71 4,320 Powering Global Travel Page 8 of 9
  • 9. Market Summary - Statistics Pseudo City: Muscat (MCT) @ 17 Nov 2013 for FIT Averages YTD Selection Criteria Metric Value Selection Value Avg Allotment Usage 13% Relative Year Current Date Avg Allotment Availability 87% Date Range 1 Jan -17 Nov 2013 as-at Sun, 17 Nov 2013 Avg Length of Stay 2.53 City Type Pseudo-city Avg Room-nights 2.91 City Muscat (MCT) Hotel Name Initial Any Initial % Auto & DI : On-request Bookings 79% : 21% Hotel All Hotels % Dynamic : Static Bookings 11% : 89% Star Any Star % FIT : Group Bookings 100% : 0% Business-type FIT Financial Metric Supplier Cost Currency USD ($ USA Dollar) Hotel Level Property (Group of hotel codes) Top N 20 Pages Summary, Summary (Static), Summary (DI), Top Hotels, Booking Window, Top Markets, Averages YTD Avg Room Cost $170 Report Details Selection Value Run On Tuesday, 19 November 2013 @ 06:54:56 Run By Ibrahim Laham (GTA-DXB) Report Version v5 Aggregates - Burst - City clusters Business Intelligence Powering Global Travel Page 9 of 9