SlideShare a Scribd company logo
1 of 2
Download to read offline
Financial Year Gross
Domestic
Product (GDP)
GDP:
Agriculture,
Forestry and
Fishing
GDP:
Agriculture
GDP:
Industry
GDP: Industry:
Mining and
Quarrying
GDP: Industry:
Manufacturing
GDP: Industry:
Construction
GDP:
Services
GDP: Services:
Trade, Hotels,
Transport and
Communication
GDP:
Services:
Hotels and
Restaurants
GDP: Services:
Transport, Storage
& Communication
2005-06 14.10 12.79 12.63 14.95 11.10 15.10 17.38 14.12 16.34 23.89 11.68
2006-07 16.60 13.36 12.64 19.53 13.05 21.69 20.03 16.19 17.93 22.41 15.50
2007-08 15.91 15.70 18.46 16.67 16.88 15.42 20.62 15.56 15.19 19.02 13.55
2008-09 15.75 12.75 12.62 12.78 12.03 11.68 15.97 18.42 13.98 4.69 13.26
2009-10 15.18 14.88 15.12 13.03 13.93 12.69 10.96 16.41 13.03 6.51 13.47
2010-11 18.66 21.80 23.15 16.08 28.60 16.30 14.20 18.96 20.11 23.09 12.25
2011-12 15.77 13.60 13.73 16.05 8.71 15.26 20.69 16.35 16.44 18.36 16.17
2012-13 11.88 9.73 8.99 7.71 -0.13 6.85 10.18 14.65 12.18 7.08 15.31
2013-14 (P) 11.54 15.89 5.44 0.11 2.21 7.99 13.63 9.33 9.94
2005-06 9.48 5.14 5.53 9.72 1.31 10.10 12.79 10.91 12.05 12.17 11.82
2006-07 9.57 4.16 4.13 12.17 7.47 14.32 10.33 10.06 11.61 11.12 12.56
2007-08 9.32 5.80 6.34 9.67 3.69 10.28 10.78 10.27 10.93 10.10 12.48
2008-09 6.72 0.09 -0.27 4.44 2.14 4.33 5.34 9.98 7.49 5.68 10.83
2009-10 8.59 0.81 0.41 9.16 5.89 11.30 6.65 10.50 10.39 7.92 14.75
2010-11 8.91 8.60 9.54 7.55 6.54 8.86 5.72 9.67 12.20 11.96 12.60
2011-12 6.69 5.02 5.34 7.81 0.10 7.41 10.80 6.57 4.33 1.23 9.45
2012-13 4.47 1.42 0.91 0.96 -2.16 1.14 1.11 6.96 5.07 4.45 6.01
2013-14 (P) 4.74 4.71 0.35 -1.38 -0.71 1.73 7.00 3.51 2.73 4.68
Sorce : CSO (updated as on 30th May, 2014)
Rate of Growth (% YoY) GDP and its Component at Current Prices
Rate of Growth (% YoY) GDP and its Component at Constant 2004-05 Prices
Databook for DCH; 3rd June, 2014 Page 17 of 337
Financial Year
2005-06
2006-07
2007-08
2008-09
2009-10
2010-11
2011-12
2012-13
2013-14 (P)
2005-06
2006-07
2007-08
2008-09
2009-10
2010-11
2011-12
2012-13
2013-14 (P)
GDP: at
Market Prices
GDP: Final
Consumption
Expenditure
GDP: Final
Consumption
Expenditure:
Private
GDP: Final
Consumption
Expenditure:
Private: Domestic
per Capita
GDP: Final
Consumption
Expenditure:
Government
GDP:
Gross
Capital
Formation
GDP:
Gross Fixed
Capital
Formation
GDP:
Change
in Stocks
GDP: Errors
and
Omissions
GDP:
Valuables
GDP:
Imports
GDP:
Exports
GDP:
Discre-
pancies
GDP: Net
Capital
Formation
13.92 12.42 12.27 10.43 13.29 20.27 20.33 30.24 15.84 0.82 29.96 25.14 1.96 23.10
16.28 14.32 15.05 13.60 10.42 19.67 19.95 40.92 -166.89 20.09 27.91 27.07 18.37 21.47
16.12 14.85 14.70 12.92 15.68 24.12 22.17 37.00 -143.31 7.81 17.16 12.60 108.36 27.26
12.89 15.23 14.38 12.72 19.94 1.61 10.93 -47.01 -1,834.16 34.75 32.40 30.41 -180.02 -3.52
15.06 15.89 14.10 12.24 25.32 22.35 12.89 67.78 -117.28 61.07 2.05 -2.26 -107.48 24.68
20.17 17.23 17.61 16.02 15.43 20.24 17.09 52.65 -116.48 40.00 24.47 31.68 -898.63 22.19
15.74 17.47 17.92 16.36 15.25 12.64 18.86 -37.63 3,870.26 51.49 4.88 59.16 347.30 11.51
12.25 12.86 12.26 10.87 15.91 10.02 7.36 0.34 -115.69 8.03 12.86 14.20 139.98 7.95
11.94 12.64 12.35 12.80 4.54 9.12 -36.00 16.11 3.79 13.57
9.28 8.68 8.65 7.31 8.88 16.25 16.19 26.65 11.86 -1.56 32.59 26.07 48.23 19.07
9.26 7.74 8.48 7.10 3.78 13.38 13.82 31.57 -163.48 13.66 21.48 20.36 47.50 14.74
9.80 9.39 9.36 7.67 9.57 18.15 16.20 31.34 -141.19 2.90 10.19 5.93 111.78 20.91
3.89 7.69 7.21 5.64 10.38 -5.22 3.51 -51.38 -1,718.15 26.92 22.71 14.60 -75.29 -10.40
8.48 8.39 7.39 5.64 13.88 17.25 7.67 67.72 -116.48 57.57 -2.14 -4.69 258.12 19.79
10.26 8.21 8.68 7.22 5.77 14.08 11.00 44.67 -115.62 32.44 15.61 19.62 43.65 15.98
6.64 8.87 9.25 7.80 6.86 3.94 12.25 -43.41 3,649.20 6.60 21.06 15.58 -18.86 1.65
4.74 5.19 5.00 3.71 6.17 5.25 0.78 -8.97 -114.73 35.78 6.55 4.97 -50.17 3.50
5.02 4.69 4.85 3.83 -0.11 1.63 -31.60 -2.55 8.44 28.15
Sorce : CSO (updated as on 30th May, 2014)
Rate of Growth (% YoY) at Current Prices
Rate of Growth (% YoY) at Constant 2004-05 Prices
Databook for DCH; 3rd June, 2014 Page 18 of 337

More Related Content

Similar to Table 17 rate of growth (% yoy) gdp and its component at current prices

Financial analysis of tata motors
Financial analysis of tata motorsFinancial analysis of tata motors
Financial analysis of tata motorsCA Ajay Biwal
 
This is my scorecard, what I infer from my simplified worksheet (...)
This is my scorecard, what I infer from my simplified worksheet (...)This is my scorecard, what I infer from my simplified worksheet (...)
This is my scorecard, what I infer from my simplified worksheet (...)Giuseppe Piazzolla
 
Boston Real Estate Report
Boston Real Estate ReportBoston Real Estate Report
Boston Real Estate ReportJoshua Stiles
 
Financial table
Financial tableFinancial table
Financial tabletumetr1
 
Macro Economic Analysis of Russia
Macro Economic Analysis of RussiaMacro Economic Analysis of Russia
Macro Economic Analysis of RussiaDhiraj Agarwal
 
Laporan Oktober 2010
Laporan Oktober 2010Laporan Oktober 2010
Laporan Oktober 2010hilman shodri
 
June 2015 - General Overview
June 2015 - General Overview June 2015 - General Overview
June 2015 - General Overview MLSListings Inc
 
Excel Model for Valuation of Natural Gas Firm
Excel Model for Valuation of Natural Gas FirmExcel Model for Valuation of Natural Gas Firm
Excel Model for Valuation of Natural Gas FirmFlevy.com Best Practices
 
July 2015 - Market Snapshot - General Overview
July 2015  - Market Snapshot - General OverviewJuly 2015  - Market Snapshot - General Overview
July 2015 - Market Snapshot - General OverviewMLSListings Inc
 
Moyno pump 2000 dimensions g2
Moyno pump 2000 dimensions g2Moyno pump 2000 dimensions g2
Moyno pump 2000 dimensions g2NelsonBort
 
Fundamental Equity Analysis - QMS Advisors HDAX FlexIndex 110
Fundamental Equity Analysis - QMS Advisors HDAX FlexIndex 110Fundamental Equity Analysis - QMS Advisors HDAX FlexIndex 110
Fundamental Equity Analysis - QMS Advisors HDAX FlexIndex 110BCV
 
August 2015 - Market snapshot - General Overview
August 2015 - Market snapshot - General OverviewAugust 2015 - Market snapshot - General Overview
August 2015 - Market snapshot - General OverviewMLSListings Inc
 
Fundamental Equity Analysis - World Gold Miners
Fundamental Equity Analysis - World Gold MinersFundamental Equity Analysis - World Gold Miners
Fundamental Equity Analysis - World Gold MinersBCV
 
(597922903) trabajo sobre aguas residuales 1
(597922903) trabajo sobre aguas residuales 1(597922903) trabajo sobre aguas residuales 1
(597922903) trabajo sobre aguas residuales 1Juliana Hincapié Rojo
 
Refrigerant properties charts 4-5
Refrigerant properties charts 4-5Refrigerant properties charts 4-5
Refrigerant properties charts 4-5Muhammad Asim
 
Fundamental analysis.pptx
Fundamental analysis.pptxFundamental analysis.pptx
Fundamental analysis.pptxvinayakhalemani
 

Similar to Table 17 rate of growth (% yoy) gdp and its component at current prices (20)

Financial analysis of tata motors
Financial analysis of tata motorsFinancial analysis of tata motors
Financial analysis of tata motors
 
This is my scorecard, what I infer from my simplified worksheet (...)
This is my scorecard, what I infer from my simplified worksheet (...)This is my scorecard, what I infer from my simplified worksheet (...)
This is my scorecard, what I infer from my simplified worksheet (...)
 
Ram sir PPT
Ram sir PPTRam sir PPT
Ram sir PPT
 
CorrelationMIDWPV
CorrelationMIDWPVCorrelationMIDWPV
CorrelationMIDWPV
 
Boston Real Estate Report
Boston Real Estate ReportBoston Real Estate Report
Boston Real Estate Report
 
GOLD
GOLDGOLD
GOLD
 
Financial table
Financial tableFinancial table
Financial table
 
Macro Economic Analysis of Russia
Macro Economic Analysis of RussiaMacro Economic Analysis of Russia
Macro Economic Analysis of Russia
 
Laporan Oktober 2010
Laporan Oktober 2010Laporan Oktober 2010
Laporan Oktober 2010
 
June 2015 - General Overview
June 2015 - General Overview June 2015 - General Overview
June 2015 - General Overview
 
Nps list
Nps listNps list
Nps list
 
Excel Model for Valuation of Natural Gas Firm
Excel Model for Valuation of Natural Gas FirmExcel Model for Valuation of Natural Gas Firm
Excel Model for Valuation of Natural Gas Firm
 
July 2015 - Market Snapshot - General Overview
July 2015  - Market Snapshot - General OverviewJuly 2015  - Market Snapshot - General Overview
July 2015 - Market Snapshot - General Overview
 
Moyno pump 2000 dimensions g2
Moyno pump 2000 dimensions g2Moyno pump 2000 dimensions g2
Moyno pump 2000 dimensions g2
 
Fundamental Equity Analysis - QMS Advisors HDAX FlexIndex 110
Fundamental Equity Analysis - QMS Advisors HDAX FlexIndex 110Fundamental Equity Analysis - QMS Advisors HDAX FlexIndex 110
Fundamental Equity Analysis - QMS Advisors HDAX FlexIndex 110
 
August 2015 - Market snapshot - General Overview
August 2015 - Market snapshot - General OverviewAugust 2015 - Market snapshot - General Overview
August 2015 - Market snapshot - General Overview
 
Fundamental Equity Analysis - World Gold Miners
Fundamental Equity Analysis - World Gold MinersFundamental Equity Analysis - World Gold Miners
Fundamental Equity Analysis - World Gold Miners
 
(597922903) trabajo sobre aguas residuales 1
(597922903) trabajo sobre aguas residuales 1(597922903) trabajo sobre aguas residuales 1
(597922903) trabajo sobre aguas residuales 1
 
Refrigerant properties charts 4-5
Refrigerant properties charts 4-5Refrigerant properties charts 4-5
Refrigerant properties charts 4-5
 
Fundamental analysis.pptx
Fundamental analysis.pptxFundamental analysis.pptx
Fundamental analysis.pptx
 

Table 17 rate of growth (% yoy) gdp and its component at current prices

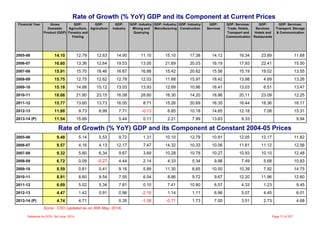
  • 1. Financial Year Gross Domestic Product (GDP) GDP: Agriculture, Forestry and Fishing GDP: Agriculture GDP: Industry GDP: Industry: Mining and Quarrying GDP: Industry: Manufacturing GDP: Industry: Construction GDP: Services GDP: Services: Trade, Hotels, Transport and Communication GDP: Services: Hotels and Restaurants GDP: Services: Transport, Storage & Communication 2005-06 14.10 12.79 12.63 14.95 11.10 15.10 17.38 14.12 16.34 23.89 11.68 2006-07 16.60 13.36 12.64 19.53 13.05 21.69 20.03 16.19 17.93 22.41 15.50 2007-08 15.91 15.70 18.46 16.67 16.88 15.42 20.62 15.56 15.19 19.02 13.55 2008-09 15.75 12.75 12.62 12.78 12.03 11.68 15.97 18.42 13.98 4.69 13.26 2009-10 15.18 14.88 15.12 13.03 13.93 12.69 10.96 16.41 13.03 6.51 13.47 2010-11 18.66 21.80 23.15 16.08 28.60 16.30 14.20 18.96 20.11 23.09 12.25 2011-12 15.77 13.60 13.73 16.05 8.71 15.26 20.69 16.35 16.44 18.36 16.17 2012-13 11.88 9.73 8.99 7.71 -0.13 6.85 10.18 14.65 12.18 7.08 15.31 2013-14 (P) 11.54 15.89 5.44 0.11 2.21 7.99 13.63 9.33 9.94 2005-06 9.48 5.14 5.53 9.72 1.31 10.10 12.79 10.91 12.05 12.17 11.82 2006-07 9.57 4.16 4.13 12.17 7.47 14.32 10.33 10.06 11.61 11.12 12.56 2007-08 9.32 5.80 6.34 9.67 3.69 10.28 10.78 10.27 10.93 10.10 12.48 2008-09 6.72 0.09 -0.27 4.44 2.14 4.33 5.34 9.98 7.49 5.68 10.83 2009-10 8.59 0.81 0.41 9.16 5.89 11.30 6.65 10.50 10.39 7.92 14.75 2010-11 8.91 8.60 9.54 7.55 6.54 8.86 5.72 9.67 12.20 11.96 12.60 2011-12 6.69 5.02 5.34 7.81 0.10 7.41 10.80 6.57 4.33 1.23 9.45 2012-13 4.47 1.42 0.91 0.96 -2.16 1.14 1.11 6.96 5.07 4.45 6.01 2013-14 (P) 4.74 4.71 0.35 -1.38 -0.71 1.73 7.00 3.51 2.73 4.68 Sorce : CSO (updated as on 30th May, 2014) Rate of Growth (% YoY) GDP and its Component at Current Prices Rate of Growth (% YoY) GDP and its Component at Constant 2004-05 Prices Databook for DCH; 3rd June, 2014 Page 17 of 337
  • 2. Financial Year 2005-06 2006-07 2007-08 2008-09 2009-10 2010-11 2011-12 2012-13 2013-14 (P) 2005-06 2006-07 2007-08 2008-09 2009-10 2010-11 2011-12 2012-13 2013-14 (P) GDP: at Market Prices GDP: Final Consumption Expenditure GDP: Final Consumption Expenditure: Private GDP: Final Consumption Expenditure: Private: Domestic per Capita GDP: Final Consumption Expenditure: Government GDP: Gross Capital Formation GDP: Gross Fixed Capital Formation GDP: Change in Stocks GDP: Errors and Omissions GDP: Valuables GDP: Imports GDP: Exports GDP: Discre- pancies GDP: Net Capital Formation 13.92 12.42 12.27 10.43 13.29 20.27 20.33 30.24 15.84 0.82 29.96 25.14 1.96 23.10 16.28 14.32 15.05 13.60 10.42 19.67 19.95 40.92 -166.89 20.09 27.91 27.07 18.37 21.47 16.12 14.85 14.70 12.92 15.68 24.12 22.17 37.00 -143.31 7.81 17.16 12.60 108.36 27.26 12.89 15.23 14.38 12.72 19.94 1.61 10.93 -47.01 -1,834.16 34.75 32.40 30.41 -180.02 -3.52 15.06 15.89 14.10 12.24 25.32 22.35 12.89 67.78 -117.28 61.07 2.05 -2.26 -107.48 24.68 20.17 17.23 17.61 16.02 15.43 20.24 17.09 52.65 -116.48 40.00 24.47 31.68 -898.63 22.19 15.74 17.47 17.92 16.36 15.25 12.64 18.86 -37.63 3,870.26 51.49 4.88 59.16 347.30 11.51 12.25 12.86 12.26 10.87 15.91 10.02 7.36 0.34 -115.69 8.03 12.86 14.20 139.98 7.95 11.94 12.64 12.35 12.80 4.54 9.12 -36.00 16.11 3.79 13.57 9.28 8.68 8.65 7.31 8.88 16.25 16.19 26.65 11.86 -1.56 32.59 26.07 48.23 19.07 9.26 7.74 8.48 7.10 3.78 13.38 13.82 31.57 -163.48 13.66 21.48 20.36 47.50 14.74 9.80 9.39 9.36 7.67 9.57 18.15 16.20 31.34 -141.19 2.90 10.19 5.93 111.78 20.91 3.89 7.69 7.21 5.64 10.38 -5.22 3.51 -51.38 -1,718.15 26.92 22.71 14.60 -75.29 -10.40 8.48 8.39 7.39 5.64 13.88 17.25 7.67 67.72 -116.48 57.57 -2.14 -4.69 258.12 19.79 10.26 8.21 8.68 7.22 5.77 14.08 11.00 44.67 -115.62 32.44 15.61 19.62 43.65 15.98 6.64 8.87 9.25 7.80 6.86 3.94 12.25 -43.41 3,649.20 6.60 21.06 15.58 -18.86 1.65 4.74 5.19 5.00 3.71 6.17 5.25 0.78 -8.97 -114.73 35.78 6.55 4.97 -50.17 3.50 5.02 4.69 4.85 3.83 -0.11 1.63 -31.60 -2.55 8.44 28.15 Sorce : CSO (updated as on 30th May, 2014) Rate of Growth (% YoY) at Current Prices Rate of Growth (% YoY) at Constant 2004-05 Prices Databook for DCH; 3rd June, 2014 Page 18 of 337