Hybridoma Technology ( Production , Purification , and Application )
Ac516
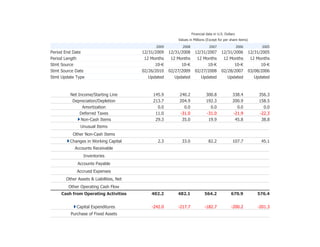
1. Financial data in U.S. Dollars Values in Millions (Except for per share items) <br /> 20092008200720062005Period End Date12/31/200912/31/200812/31/200712/31/200612/31/2005Period Length12 Months12 Months12 Months12 Months12 MonthsStmt Source10-K10-K10-K10-K10-KStmt Source Date02/26/201002/27/200902/27/200802/28/200703/08/2006Stmt Update TypeUpdatedUpdatedUpdatedUpdatedUpdated Net Income/Starting Line145.9240.2300.8338.4356.3Depreciation/Depletion213.7204.9192.3200.9158.5Amortization0.00.00.00.00.0Deferred Taxes11.0-31.0-31.0-21.9-22.3Non-Cash Items29.335.019.945.838.8Unusual Items0.0-1.1-3.50.00.0Other Non-Cash Items29.336.123.445.838.8Changes in Working Capital2.333.082.2107.745.1Accounts Receivable2.3150.55.566.693.5Inventories81.226.1-6.6-48.655.7Accounts Payable-47.8-80.136.627.5-97.8Accrued Expenses-16.0-39.7-7.462.0-134.7Other Assets & Liabilities, Net-17.4-23.854.10.2112.6Other Operating Cash Flow0.00.00.00.015.8Cash from Operating Activities402.2482.1564.2670.9576.4 Capital Expenditures-242.0-217.7-182.7-200.2-201.3Purchase of Fixed Assets-242.0-217.7-182.7-200.2-201.3Other Investing Cash Flow Items, Total13.8-209.9-104.7312.9206.2Acquisition of Business-10.10.00.00.00.0Sale of Business0.04.68.10.00.0Sale/Maturity of Investment894.7533.8855.31,721.01,824.7Purchase of Investments-870.5-744.4-968.2-1,406.2-1,604.3Other Investing Cash Flow-0.3-3.90.1-1.9-14.2Cash from Investing Activities-228.2-427.6-287.4112.74.9 Financing Cash Flow Items10.4-0.12.39.0-3.0Other Financing Cash Flow10.4-0.12.39.0-3.0Total Cash Dividends Paid0.00.00.00.00.0Issuance (Retirement) of Stock, Net0.0-548.2-149.3-817.7-1,032.4Issuance (Retirement) of Debt, Net-6.6500.20.00.0-1.5Cash from Financing Activities3.8-48.1-147.0-808.7-1,036.9 Foreign Exchange Effects2.3-4.22.61.4-2.3Net Change in Cash180.12.2132.4-23.7-457.9 Net Cash - Beginning Balance279.2277.0144.6168.3626.2Net Cash - Ending Balance459.3279.2277.0144.6168.3<br />Income statement<br />Financial data in U.S. Dollars Values in Millions (Except for per share items) <br /> 20092008200720062005Period End Date12/31/200912/31/200812/31/200712/31/200612/31/2005Period Length12 Months12 Months12 Months12 Months12 MonthsStmt Source10-K10-K10-K10-K10-KStmt Source Date02/26/201002/26/201002/27/200802/28/200703/08/2006Stmt Update TypeUpdatedReclassifiedUpdatedUpdatedUpdated Revenue3,879.94,528.44,973.95,108.15,221.5Total Revenue3,879.94,528.44,973.95,108.15,221.5 Cost of Revenue, Total2,570.12,993.83,410.33,462.13,585.9Gross Profit1,309.81,534.61,563.61,646.01,635.6 Selling/General/Administrative Expenses, Total647.8807.3812.8761.8755.1Research & Development375.3423.3403.8370.5336.4Depreciation/Amortization0.00.00.00.00.0Interest Expense (Income), Net Operating0.00.00.00.00.0Unusual Expense (Income)73.726.825.771.210.4Other Operating Expenses, Total0.00.00.00.00.0Operating Income213.0277.2321.3442.5533.7 Interest Income (Expense), Net Non-Operating0.00.00.00.00.0Gain (Loss) on Sale of Assets0.00.00.00.00.0Other, Net-4.6-7.47.0-5.3-6.5Income Before Tax187.0275.9349.5459.3553.7 Income Tax - Total41.135.748.7120.9197.4Income After Tax145.9240.2300.8338.4356.3 Minority Interest0.00.00.00.00.0Equity In Affiliates0.00.00.00.00.0U.S. GAAP Adjustment0.00.00.00.00.0Net Income Before Extra. Items145.9240.2300.8338.4356.3 Total Extraordinary Items0.00.00.00.00.0Net Income145.9240.2300.8338.4356.3 Total Adjustments to Net Income0.00.00.00.00.0Preferred Dividends0.00.00.00.00.0General Partners' Distributions0.00.00.00.00.0 Basic Weighted Average Shares78.288.995.3102.8121.0Basic EPS Excluding Extraordinary Items1.872.73.163.292.94Basic EPS Including Extraordinary Items1.872.73.163.292.94 Diluted Weighted Average Shares78.689.295.8103.5122.3Diluted EPS Excluding Extrordinary Items1.862.693.143.272.91Diluted EPS Including Extraordinary Items1.862.693.143.272.91 Dividends per Share - Common Stock Primary Issue0.00.00.00.00.0Gross Dividends - Common Stock0.00.00.00.00.0Interest Expense, Supplemental39.328.913.012.111.2Depreciation, Supplemental209.1203.2191.0199.5157.1 Normalized EBITDA525.0537.8559.2713.2701.2Normalized EBIT315.9334.6368.2513.7544.1Normalized Income Before Tax289.9333.3396.4530.5564.1Normalized Income After Taxes226.18290.17341.16390.86362.99Normalized Income Available to Common226.18290.17341.16390.86362.99 Basic Normalized EPS2.893.263.583.83.0Diluted Normalized EPS2.883.253.563.782.97<br />blance sheet<br />Financial data in U.S. Dollars Values in Millions (Except for per share items) <br /> 20092008200720062005Period End Date12/31/200912/31/200812/31/200712/31/200612/31/2005Stmt Source10-K10-K10-K10-K10-KStmt Source Date02/26/201002/27/200902/27/200802/28/200703/08/2006Stmt Update TypeUpdatedUpdatedUpdatedUpdatedUpdated Assets Cash and Short Term Investments1,132.5973.3796.1550.9888.8Cash & Equivalents459.3279.2277.0144.6168.3Short Term Investments673.2694.1519.1406.3720.5Total Receivables, Net424.9427.3578.8584.3650.9Accounts Receivable - Trade, Net424.9427.3578.8584.3650.9Accounts Receivable - Trade, Gross458.6463.4615.3622.3688.3Provision for Doubtful Accounts-33.7-36.1-36.5-38.0-37.4Total Inventory357.3438.3464.4457.8409.2Prepaid Expenses226.0223.8227.5237.0220.7Other Current Assets, Total0.00.00.00.00.0Total Current Assets2,140.72,062.72,066.81,830.02,169.6 Property/Plant/Equipment, Total - Net914.9863.2869.0846.8832.2Goodwill, Net0.00.00.00.00.0Intangibles, Net0.00.00.00.00.0Long Term Investments22.024.70.00.00.0Note Receivable - Long Term0.00.00.00.00.0Other Long Term Assets, Total276.6314.8185.3172.2328.3Other Assets, Total0.00.00.00.00.0Total Assets3,354.23,265.43,121.12,849.03,330.1 Liabilities and Shareholders' Equity Accounts Payable510.1557.1636.9600.3572.8Payable/Accrued0.00.00.00.00.0Accrued Expenses251.5302.7295.6365.7316.7Notes Payable/Short Term Debt0.05.50.00.00.0Current Port. of LT Debt/Capital Leases0.00.0149.90.00.0Other Current Liabilities, Total430.2392.2414.9358.0344.2Total Current Liabilities1,191.81,257.51,497.31,324.01,233.7 Total Long Term Debt648.9648.70.0149.8149.6Long Term Debt648.9648.70.0149.8149.6Deferred Income Tax0.00.00.00.00.0Minority Interest0.00.00.00.00.0Other Liabilities, Total499.9547.1345.5340.0518.1Total Liabilities2,340.62,453.31,842.81,813.81,901.4 Redeemable Preferred Stock0.00.00.00.00.0Preferred Stock - Non Redeemable, Net0.00.00.00.00.0Common Stock0.90.91.11.11.2Additional Paid-In Capital820.0803.5887.8827.3832.5Retained Earnings (Accumulated Deficit)839.8692.5935.7627.5988.8Treasury Stock - Common-404.5-404.5-454.7-289.8-230.5Other Equity, Total-242.6-280.3-91.6-130.9-163.3Total Equity1,013.6812.11,278.31,035.21,428.7 Total Liabilities & Shareholders’ Equity3,354.23,265.43,121.12,849.03,330.1 Total Common Shares Outstanding78.177.794.797.0111.9Total Preferred Shares Outstanding0.00.00.00.00.0<br />