SlideShare a Scribd company logo
1 of 4
Microsoft Corporation
            Income Statements
            (In millions, except earnings per share)

                                                                    Three Months Ended                 Year Ended Y/Y Growth
                                                                           June 30                        June 30
                                                                   2003(1)         2004            2003 (1)       2004 Q4
            Revenue                                                   $8,065        $9,292          $32,187       $36,835
                                                                                                                        ###
            Operating expenses:
                  Cost of revenue                                      1,304         1,481             6,059         6,716
                                                                                                                         ###
                  Research and development                             1,681         1,659             6,595         7,779
                                                                                                                         ###
                  Sales and marketing                                  2,288         2,409             7,562         8,309
                                                                                                                         ###
              General and administrative                               1,252           610            2,426         4,997###
                Total operating expenses                               6,525         6,159           22,642        27,801###
            Operating income                                           1,540         3,133            9,545         9,034###
            Gains / (losses) on equity investees and other               (15)
                                                                           ###           1              (68)
                                                                                                          ###         (25)
            Investment income                                            689           570            1,577         3,187
            Income before income taxes                                 2,214         3,704           11,054        12,196###
            Provision for income taxes                                   731         1,014            3,523         4,028
            Net income                                                $1,483
                                                                           ###      $2,690           $7,531
                                                                                                          ###      $8,168###

            Earnings per share:
             Basic                                                    $ 0.14        $ 0.25           $ 0.70        $ 0.76
                                                                                                                        ###
             Diluted                                                  $ 0.14        $ 0.25           $ 0.69        $ 0.75
                                                                                                                        ###

            Weighted average shares outstanding:
             Basic                                                     10,737        10,806           10,723        10,803
             Diluted                                                   10,862        10,864           10,882        10,894


              The three months and year ended June 30, 2003 results have been restated to reflect the retroactive adoption
            (1)

            of SFAS 123, Accounting for Stock-Based Compensation.


01/20/2009,01:47:36
Microsoft Corporation
            Balance Sheets
            (In millions)

                                                                                  June 30, 2003 (1)        June 30, 2004
            Assets
            Current assets:
               Cash and equivalents                                                       $ 6,438              $ 15,982
               Short-term investments                                                      42,610                44,610
                Total cash and short-term investments                                      49,048                60,592
             Accounts receivable, net                                                       5,196                 5,890
             Inventories                                                                      640                   421
             Deferred income taxes                                                          2,506                 2,097
             Other                                                                          1,583                 1,566
               Total current assets                                                        58,973                70,566
            Property and equipment, net                                                     2,223                 2,326
            Equity and other investments                                                   13,692                12,210
            Goodwill                                                                        3,128                 3,115
            Intangible assets, net                                                            384                   569
            Deferred income taxes                                                           2,161                 1,829
            Other long-term assets                                                          1,171                 1,774
                Total assets                                                              $81,732               $92,389

            Liabilities and stockholders' equity
            Current liabilities:
             Accounts payable                                                             $ 1,573                $ 1,717
             Accrued compensation                                                           1,416                  1,339
             Income taxes                                                                   2,044                  3,478
             Short-term unearned revenue                                                    7,225                  6,514
             Other                                                                          1,716                  1,921
              Total current liabilities                                                    13,974                 14,969
            Long-term unearned revenue                                                      1,790                  1,663
            Other long-term liabilities                                                     1,056                    932
            Stockholders' equity:
             Common stock and paid-in capital - shares authorized 24,000;
             Shares issued and outstanding 10,771 and 10,862                               49,234                 56,396
             Retained earnings, including accumulated other
             comprehensive income of $1,840 and $1,119                                     15,678                 18,429
              Total stockholders' equity                                                   64,912                 74,825
               Total liabilities and stockholders' equity                                 $81,732                $92,389

              June 30, 2003 balance sheet has been restated to reflect the retroactive adoption of SFAS 123, Accounting
            (1)

            for Stock-Based Compensation.


01/20/2009/01:47:36
Microsoft Corporation
            Cash Flows Statements
            (In millions)


                                                                             Three Months Ended                  Year Ended
                                                                                     June 30                        June 30
                                                                            2003                             2003
                                                                                             2004                           2004
                                                                                 (1)                              (1)


            Operations
              Net income                                                       $1,483        $2,690            $7,531       $8,168
              Depreciation, amortization, and other non-cash items                462           309             1,393        1,186
              Stock based compensation                                            665           739             3,749        5,734
              Net recognized (gains) / losses on investments                     (218)         (184)              380       (1,296)
              Stock option income tax benefits                                    375           328             1,365        1,100
              Deferred income taxes                                               468          (554)             (894)      (1,479)
              Unearned revenue                                                  3,463         3,996            12,519       11,777
              Recognition of unearned revenue                                  (2,984)       (3,259)          (11,292)     (12,527)
              Accounts receivable                                              (1,038)       (1,056)              187         (687)
              Other current assets                                                 (6)          122               412          478
              Other long-term assets                                                3            (1)              (28)          34
              Other current liabilities                                            (3)         (868)               35        2,063
              Other long-term liabilities                                          19          (604)              440           75
                Net cash from operations                                       $2,689        $1,658           $15,797      $14,626
            Financing
              Common stock issued                                                 731         1,296             2,120        2,748
              Common stock repurchased                                         (1,214)            0            (6,486)      (3,383)
              Common stock dividends                                                0             0              (857)      (1,729)
                Net cash from financing                                         ($483)       $1,296           ($5,223)     ($2,364)
            Investing
              Additions to property and equipment                                (273)         (557)             (891)      (1,109)
              Acquisition of companies, net of cash acquired                     (172)            0            (1,063)          (4)
              Purchases of investments                                        (18,424)      (25,940)          (89,621)     (92,495)
              Maturities of investments                                         1,963         1,725             9,205        5,561
              Sales of investments                                             16,816        28,462            75,157       85,302
                Net cash from investing                                          ($90)       $3,690           ($7,213)     ($2,745)
            Net change in cash and equivalents                                  2,116         6,644             3,361        9,517
            Effect of exchange rates on cash and equivalents                       22           (10)               61           27
            Cash and equivalents, beginning of period                           4,300         9,348             3,016        6,438
            Cash and equivalents, end of period                                $6,438       $15,982            $6,438      $15,982

              The three months and year ended June 30, 2003 cash flows statements have been restated to reflect the retroactive
            (1)

            adoption of SFAS 123, Accounting for Stock-Based Compensation.


01/20/2009,01:47:36
Microsoft Corporation
            Segment Revenue and Operating Income / (Loss)
            (In millions)

                                                           Three Months Ended                    Year Ended
            Revenue                                              June 30                           June 30
                                                             2003        2004                 2003         2004
            Segments
            Client                                            $2,526         $2,754           $10,394      $11,546
            Server and Tools                                   1,925          2,306             7,140        8,483
            Information Worker                                 2,349          2,879             9,229       10,800
            Microsoft Business Solutions                         179            196               567          667
            MSN                                                  559            588             1,953        2,216
            Mobile and Embedded Devices                           44             70               156          247
            Home and Entertainment                               483            499             2,748        2,876
             Total revenue                                    $8,065         $9,292           $32,187      $36,835


                                                           Three Months Ended                   Year Ended
            Operating Income / (Loss)                            June 30                             June 30
                                                                         2004                                2004
                                                            2003(1)                          2003(1)
            Segments
            Client                                           $1,869          $2,061            $8,017       $8,015
            Server and Tools                                    307             567             1,121           96
            Information Worker                                1,475           1,960             6,486        7,151
            Microsoft Business Solutions                        (73)            (42)             (309)        (255)
            MSN                                                 (83)             35              (567)         121
            Mobile and Embedded Devices                         (68)            (42)             (277)        (224)
            Home and Entertainment                             (245)           (339)           (1,191)      (1,215)
            Other                                            (1,642)         (1,067)           (3,735)      (4,655)
             Total operating income / (loss)                 $1,540          $3,133            $9,545       $9,034

            (1) The three months and year ended June 30, 2003 results have been restated to reflect the retroactive
            adoption of SFAS 123, Accounting for Stock-Based Compensation.


01/20/2009,01:47:36

More Related Content

What's hot

dominion resources GAAP Reconciliations and Footnotes
dominion resources GAAP Reconciliations and Footnotesdominion resources GAAP Reconciliations and Footnotes
dominion resources GAAP Reconciliations and Footnotesfinance17
 
ConAgra Q4Jul04
ConAgra Q4Jul04ConAgra Q4Jul04
ConAgra Q4Jul04finance21
 
alltel 2Q06_Supplement
alltel  2Q06_Supplementalltel  2Q06_Supplement
alltel 2Q06_Supplementfinance27
 
danaher 07_4Q_Release
danaher 07_4Q_Releasedanaher 07_4Q_Release
danaher 07_4Q_Releasefinance24
 
danaher 05-4Q-REL
danaher 05-4Q-RELdanaher 05-4Q-REL
danaher 05-4Q-RELfinance24
 
alltel 3Q06_InvestorSupplementa
alltel  3Q06_InvestorSupplementaalltel  3Q06_InvestorSupplementa
alltel 3Q06_InvestorSupplementafinance27
 
Cteep presentation 3_q11
Cteep presentation 3_q11Cteep presentation 3_q11
Cteep presentation 3_q11Cteep
 
AT&T Financial and Operational Results
AT&T Financial and Operational ResultsAT&T Financial and Operational Results
AT&T Financial and Operational Resultsfinance1
 
TechStars presentation - Financial presentations for investors
TechStars presentation - Financial presentations for investorsTechStars presentation - Financial presentations for investors
TechStars presentation - Financial presentations for investorsDavid Fogel
 
Company information acct 370 excel projectjohnson & johnsoncompany
Company information acct 370 excel projectjohnson & johnsoncompany Company information acct 370 excel projectjohnson & johnsoncompany
Company information acct 370 excel projectjohnson & johnsoncompany nand15
 
jacobs2002ar_comp
jacobs2002ar_compjacobs2002ar_comp
jacobs2002ar_compfinance28
 
Financial Forecasting
Financial ForecastingFinancial Forecasting
Financial ForecastingTravonnLee
 
How to Prepare Budgets & Projections
How to Prepare Budgets &  ProjectionsHow to Prepare Budgets &  Projections
How to Prepare Budgets & ProjectionsTraklight.com
 
Uniliver's financial modeling
Uniliver's financial modeling Uniliver's financial modeling
Uniliver's financial modeling Tooba Shafique
 

What's hot (17)

dominion resources GAAP Reconciliations and Footnotes
dominion resources GAAP Reconciliations and Footnotesdominion resources GAAP Reconciliations and Footnotes
dominion resources GAAP Reconciliations and Footnotes
 
ConAgra Q4Jul04
ConAgra Q4Jul04ConAgra Q4Jul04
ConAgra Q4Jul04
 
11. merger of qualcomm and atheros (deb sahoo)
11. merger of qualcomm and atheros (deb sahoo)11. merger of qualcomm and atheros (deb sahoo)
11. merger of qualcomm and atheros (deb sahoo)
 
alltel 2Q06_Supplement
alltel  2Q06_Supplementalltel  2Q06_Supplement
alltel 2Q06_Supplement
 
Q1 2009 Financial Report of Torchmark Corp.
Q1 2009 Financial Report of Torchmark Corp.Q1 2009 Financial Report of Torchmark Corp.
Q1 2009 Financial Report of Torchmark Corp.
 
danaher 07_4Q_Release
danaher 07_4Q_Releasedanaher 07_4Q_Release
danaher 07_4Q_Release
 
danaher 05-4Q-REL
danaher 05-4Q-RELdanaher 05-4Q-REL
danaher 05-4Q-REL
 
alltel 3Q06_InvestorSupplementa
alltel  3Q06_InvestorSupplementaalltel  3Q06_InvestorSupplementa
alltel 3Q06_InvestorSupplementa
 
Cteep presentation 3_q11
Cteep presentation 3_q11Cteep presentation 3_q11
Cteep presentation 3_q11
 
AT&T Financial and Operational Results
AT&T Financial and Operational ResultsAT&T Financial and Operational Results
AT&T Financial and Operational Results
 
TechStars presentation - Financial presentations for investors
TechStars presentation - Financial presentations for investorsTechStars presentation - Financial presentations for investors
TechStars presentation - Financial presentations for investors
 
Company information acct 370 excel projectjohnson & johnsoncompany
Company information acct 370 excel projectjohnson & johnsoncompany Company information acct 370 excel projectjohnson & johnsoncompany
Company information acct 370 excel projectjohnson & johnsoncompany
 
jacobs2002ar_comp
jacobs2002ar_compjacobs2002ar_comp
jacobs2002ar_comp
 
Financial Forecasting
Financial ForecastingFinancial Forecasting
Financial Forecasting
 
How to Prepare Budgets & Projections
How to Prepare Budgets &  ProjectionsHow to Prepare Budgets &  Projections
How to Prepare Budgets & Projections
 
itw_10qq102
itw_10qq102itw_10qq102
itw_10qq102
 
Uniliver's financial modeling
Uniliver's financial modeling Uniliver's financial modeling
Uniliver's financial modeling
 

Similar to Financial Statements

danaher 04-4Q-REL
danaher 04-4Q-RELdanaher 04-4Q-REL
danaher 04-4Q-RELfinance24
 
conoco phillips 2007Third Quarter
conoco phillips 2007Third Quarterconoco phillips 2007Third Quarter
conoco phillips 2007Third Quarterfinance1
 
Maxim 2Q FISCAL 2009 RESULTS
Maxim 2Q FISCAL 2009 RESULTSMaxim 2Q FISCAL 2009 RESULTS
Maxim 2Q FISCAL 2009 RESULTSearningsreport
 
conoco phillips 2007Fourth Quarter
conoco phillips 2007Fourth Quarterconoco phillips 2007Fourth Quarter
conoco phillips 2007Fourth Quarterfinance1
 
Q1 2006 Earnings Release Financial Tables
Q1 2006 Earnings Release Financial TablesQ1 2006 Earnings Release Financial Tables
Q1 2006 Earnings Release Financial Tablesfinance7
 
coventry health care annual reports 2006
coventry health care annual reports 2006coventry health care annual reports 2006
coventry health care annual reports 2006finance27
 
advanced micro devices Q307Financials
advanced micro devices Q307Financialsadvanced micro devices Q307Financials
advanced micro devices Q307Financialsfinance34
 
allstate Financial Section 2001
allstate Financial Section 2001allstate Financial Section 2001
allstate Financial Section 2001finance7
 
advanced micro devices Q106Results
advanced micro devices Q106Resultsadvanced micro devices Q106Results
advanced micro devices Q106Resultsfinance34
 
qwest communications 020807_Non-GAAP_Measures_Reconciliation_excel
qwest communications 020807_Non-GAAP_Measures_Reconciliation_excelqwest communications 020807_Non-GAAP_Measures_Reconciliation_excel
qwest communications 020807_Non-GAAP_Measures_Reconciliation_excelfinance19
 
reliance steel & aluminum 2005_Annual_Report
reliance steel & aluminum  2005_Annual_Reportreliance steel & aluminum  2005_Annual_Report
reliance steel & aluminum 2005_Annual_Reportfinance32
 
advanced micro devices Q207Financials
advanced micro devices Q207Financialsadvanced micro devices Q207Financials
advanced micro devices Q207Financialsfinance34
 
conoco phillips 2006Third Quarter
conoco phillips 2006Third Quarterconoco phillips 2006Third Quarter
conoco phillips 2006Third Quarterfinance1
 
danaher 05-4Q-REL
danaher 05-4Q-RELdanaher 05-4Q-REL
danaher 05-4Q-RELfinance24
 
advanced micro devices Q308Financials
advanced micro devices Q308Financialsadvanced micro devices Q308Financials
advanced micro devices Q308Financialsfinance34
 
tjx Annual Reports1997
tjx Annual Reports1997tjx Annual Reports1997
tjx Annual Reports1997finance14
 
state street corp stt_finrev02
state street corp stt_finrev02state street corp stt_finrev02
state street corp stt_finrev02finance23
 
state street corp stt_finrev02
state street corp stt_finrev02state street corp stt_finrev02
state street corp stt_finrev02finance23
 

Similar to Financial Statements (20)

danaher 04-4Q-REL
danaher 04-4Q-RELdanaher 04-4Q-REL
danaher 04-4Q-REL
 
conoco phillips 2007Third Quarter
conoco phillips 2007Third Quarterconoco phillips 2007Third Quarter
conoco phillips 2007Third Quarter
 
Maxim 2Q FISCAL 2009 RESULTS
Maxim 2Q FISCAL 2009 RESULTSMaxim 2Q FISCAL 2009 RESULTS
Maxim 2Q FISCAL 2009 RESULTS
 
conoco phillips 2007Fourth Quarter
conoco phillips 2007Fourth Quarterconoco phillips 2007Fourth Quarter
conoco phillips 2007Fourth Quarter
 
Q1 2006 Earnings Release Financial Tables
Q1 2006 Earnings Release Financial TablesQ1 2006 Earnings Release Financial Tables
Q1 2006 Earnings Release Financial Tables
 
coventry health care annual reports 2006
coventry health care annual reports 2006coventry health care annual reports 2006
coventry health care annual reports 2006
 
advanced micro devices Q307Financials
advanced micro devices Q307Financialsadvanced micro devices Q307Financials
advanced micro devices Q307Financials
 
Amd Q307 Financials
Amd Q307 FinancialsAmd Q307 Financials
Amd Q307 Financials
 
allstate Financial Section 2001
allstate Financial Section 2001allstate Financial Section 2001
allstate Financial Section 2001
 
advanced micro devices Q106Results
advanced micro devices Q106Resultsadvanced micro devices Q106Results
advanced micro devices Q106Results
 
qwest communications 020807_Non-GAAP_Measures_Reconciliation_excel
qwest communications 020807_Non-GAAP_Measures_Reconciliation_excelqwest communications 020807_Non-GAAP_Measures_Reconciliation_excel
qwest communications 020807_Non-GAAP_Measures_Reconciliation_excel
 
reliance steel & aluminum 2005_Annual_Report
reliance steel & aluminum  2005_Annual_Reportreliance steel & aluminum  2005_Annual_Report
reliance steel & aluminum 2005_Annual_Report
 
advanced micro devices Q207Financials
advanced micro devices Q207Financialsadvanced micro devices Q207Financials
advanced micro devices Q207Financials
 
Amd Q207 Financials
Amd Q207 FinancialsAmd Q207 Financials
Amd Q207 Financials
 
conoco phillips 2006Third Quarter
conoco phillips 2006Third Quarterconoco phillips 2006Third Quarter
conoco phillips 2006Third Quarter
 
danaher 05-4Q-REL
danaher 05-4Q-RELdanaher 05-4Q-REL
danaher 05-4Q-REL
 
advanced micro devices Q308Financials
advanced micro devices Q308Financialsadvanced micro devices Q308Financials
advanced micro devices Q308Financials
 
tjx Annual Reports1997
tjx Annual Reports1997tjx Annual Reports1997
tjx Annual Reports1997
 
state street corp stt_finrev02
state street corp stt_finrev02state street corp stt_finrev02
state street corp stt_finrev02
 
state street corp stt_finrev02
state street corp stt_finrev02state street corp stt_finrev02
state street corp stt_finrev02
 

More from earnirgsreports

More from earnirgsreports (20)

Recovery Bill01 15 09
Recovery Bill01 15 09Recovery Bill01 15 09
Recovery Bill01 15 09
 
microsoft 2000
microsoft 2000microsoft 2000
microsoft 2000
 
Notes to Financial Statements
Notes to Financial StatementsNotes to Financial Statements
Notes to Financial Statements
 
Balance Sheets
Balance SheetsBalance Sheets
Balance Sheets
 
Cash Flows Statements 78 Kb
Cash Flows Statements  	78 KbCash Flows Statements  	78 Kb
Cash Flows Statements 78 Kb
 
Cash Flows Statements
Cash Flows StatementsCash Flows Statements
Cash Flows Statements
 
Income Statements
Income StatementsIncome Statements
Income Statements
 
Management's Discussion and Analysis
Management's Discussion and AnalysisManagement's Discussion and Analysis
Management's Discussion and Analysis
 
Letter to Shareholders2002
Letter to Shareholders2002Letter to Shareholders2002
Letter to Shareholders2002
 
2002 Form 10-k
2002 Form 10-k2002 Form 10-k
2002 Form 10-k
 
Financial Tables
Financial TablesFinancial Tables
Financial Tables
 
Front Copy and Letter to Shareholders
Front Copy and Letter to ShareholdersFront Copy and Letter to Shareholders
Front Copy and Letter to Shareholders
 
Intl Financial Highlights
Intl Financial HighlightsIntl Financial Highlights
Intl Financial Highlights
 
Letter to Shareholders
Letter to ShareholdersLetter to Shareholders
Letter to Shareholders
 
Microsoft 2004 Annual Report
Microsoft 2004 Annual ReportMicrosoft 2004 Annual Report
Microsoft 2004 Annual Report
 
Microsoft 2004 10-K
 Microsoft 2004 10-K Microsoft 2004 10-K
Microsoft 2004 10-K
 
Letter to Shareholders
Letter to ShareholdersLetter to Shareholders
Letter to Shareholders
 
Microsoft 2006 Annual Report
Microsoft 2006 Annual ReportMicrosoft 2006 Annual Report
Microsoft 2006 Annual Report
 
Microsoft 2006 10-K
Microsoft 2006 10-KMicrosoft 2006 10-K
Microsoft 2006 10-K
 
Letter to Shareholders
Letter to ShareholdersLetter to Shareholders
Letter to Shareholders
 

Recently uploaded

Intro to BCG's Carbon Emissions Benchmark_vF.pdf
Intro to BCG's Carbon Emissions Benchmark_vF.pdfIntro to BCG's Carbon Emissions Benchmark_vF.pdf
Intro to BCG's Carbon Emissions Benchmark_vF.pdfpollardmorgan
 
Call Girls In Connaught Place Delhi ❤️88604**77959_Russian 100% Genuine Escor...
Call Girls In Connaught Place Delhi ❤️88604**77959_Russian 100% Genuine Escor...Call Girls In Connaught Place Delhi ❤️88604**77959_Russian 100% Genuine Escor...
Call Girls In Connaught Place Delhi ❤️88604**77959_Russian 100% Genuine Escor...lizamodels9
 
2024 Numerator Consumer Study of Cannabis Usage
2024 Numerator Consumer Study of Cannabis Usage2024 Numerator Consumer Study of Cannabis Usage
2024 Numerator Consumer Study of Cannabis UsageNeil Kimberley
 
RE Capital's Visionary Leadership under Newman Leech
RE Capital's Visionary Leadership under Newman LeechRE Capital's Visionary Leadership under Newman Leech
RE Capital's Visionary Leadership under Newman LeechNewman George Leech
 
Call Girls In Sikandarpur Gurgaon ❤️8860477959_Russian 100% Genuine Escorts I...
Call Girls In Sikandarpur Gurgaon ❤️8860477959_Russian 100% Genuine Escorts I...Call Girls In Sikandarpur Gurgaon ❤️8860477959_Russian 100% Genuine Escorts I...
Call Girls In Sikandarpur Gurgaon ❤️8860477959_Russian 100% Genuine Escorts I...lizamodels9
 
BEST Call Girls In Greater Noida ✨ 9773824855 ✨ Escorts Service In Delhi Ncr,
BEST Call Girls In Greater Noida ✨ 9773824855 ✨ Escorts Service In Delhi Ncr,BEST Call Girls In Greater Noida ✨ 9773824855 ✨ Escorts Service In Delhi Ncr,
BEST Call Girls In Greater Noida ✨ 9773824855 ✨ Escorts Service In Delhi Ncr,noida100girls
 
Sales & Marketing Alignment: How to Synergize for Success
Sales & Marketing Alignment: How to Synergize for SuccessSales & Marketing Alignment: How to Synergize for Success
Sales & Marketing Alignment: How to Synergize for SuccessAggregage
 
Progress Report - Oracle Database Analyst Summit
Progress  Report - Oracle Database Analyst SummitProgress  Report - Oracle Database Analyst Summit
Progress Report - Oracle Database Analyst SummitHolger Mueller
 
rishikeshgirls.in- Rishikesh call girl.pdf
rishikeshgirls.in- Rishikesh call girl.pdfrishikeshgirls.in- Rishikesh call girl.pdf
rishikeshgirls.in- Rishikesh call girl.pdfmuskan1121w
 
NewBase 22 April 2024 Energy News issue - 1718 by Khaled Al Awadi (AutoRe...
NewBase  22 April  2024  Energy News issue - 1718 by Khaled Al Awadi  (AutoRe...NewBase  22 April  2024  Energy News issue - 1718 by Khaled Al Awadi  (AutoRe...
NewBase 22 April 2024 Energy News issue - 1718 by Khaled Al Awadi (AutoRe...Khaled Al Awadi
 
BEST Call Girls In Old Faridabad ✨ 9773824855 ✨ Escorts Service In Delhi Ncr,
BEST Call Girls In Old Faridabad ✨ 9773824855 ✨ Escorts Service In Delhi Ncr,BEST Call Girls In Old Faridabad ✨ 9773824855 ✨ Escorts Service In Delhi Ncr,
BEST Call Girls In Old Faridabad ✨ 9773824855 ✨ Escorts Service In Delhi Ncr,noida100girls
 
Pitch Deck Teardown: NOQX's $200k Pre-seed deck
Pitch Deck Teardown: NOQX's $200k Pre-seed deckPitch Deck Teardown: NOQX's $200k Pre-seed deck
Pitch Deck Teardown: NOQX's $200k Pre-seed deckHajeJanKamps
 
Call Girls In ⇛⇛Chhatarpur⇚⇚. Brings Offer Delhi Contact Us 8377877756
Call Girls In ⇛⇛Chhatarpur⇚⇚. Brings Offer Delhi Contact Us 8377877756Call Girls In ⇛⇛Chhatarpur⇚⇚. Brings Offer Delhi Contact Us 8377877756
Call Girls In ⇛⇛Chhatarpur⇚⇚. Brings Offer Delhi Contact Us 8377877756dollysharma2066
 
(8264348440) 🔝 Call Girls In Hauz Khas 🔝 Delhi NCR
(8264348440) 🔝 Call Girls In Hauz Khas 🔝 Delhi NCR(8264348440) 🔝 Call Girls In Hauz Khas 🔝 Delhi NCR
(8264348440) 🔝 Call Girls In Hauz Khas 🔝 Delhi NCRsoniya singh
 
Call Girls In Kishangarh Delhi ❤️8860477959 Good Looking Escorts In 24/7 Delh...
Call Girls In Kishangarh Delhi ❤️8860477959 Good Looking Escorts In 24/7 Delh...Call Girls In Kishangarh Delhi ❤️8860477959 Good Looking Escorts In 24/7 Delh...
Call Girls In Kishangarh Delhi ❤️8860477959 Good Looking Escorts In 24/7 Delh...lizamodels9
 
Lowrate Call Girls In Sector 18 Noida ❤️8860477959 Escorts 100% Genuine Servi...
Lowrate Call Girls In Sector 18 Noida ❤️8860477959 Escorts 100% Genuine Servi...Lowrate Call Girls In Sector 18 Noida ❤️8860477959 Escorts 100% Genuine Servi...
Lowrate Call Girls In Sector 18 Noida ❤️8860477959 Escorts 100% Genuine Servi...lizamodels9
 
The CMO Survey - Highlights and Insights Report - Spring 2024
The CMO Survey - Highlights and Insights Report - Spring 2024The CMO Survey - Highlights and Insights Report - Spring 2024
The CMO Survey - Highlights and Insights Report - Spring 2024christinemoorman
 
Cash Payment 9602870969 Escort Service in Udaipur Call Girls
Cash Payment 9602870969 Escort Service in Udaipur Call GirlsCash Payment 9602870969 Escort Service in Udaipur Call Girls
Cash Payment 9602870969 Escort Service in Udaipur Call GirlsApsara Of India
 
Call Girls Miyapur 7001305949 all area service COD available Any Time
Call Girls Miyapur 7001305949 all area service COD available Any TimeCall Girls Miyapur 7001305949 all area service COD available Any Time
Call Girls Miyapur 7001305949 all area service COD available Any Timedelhimodelshub1
 

Recently uploaded (20)

Intro to BCG's Carbon Emissions Benchmark_vF.pdf
Intro to BCG's Carbon Emissions Benchmark_vF.pdfIntro to BCG's Carbon Emissions Benchmark_vF.pdf
Intro to BCG's Carbon Emissions Benchmark_vF.pdf
 
Call Girls In Connaught Place Delhi ❤️88604**77959_Russian 100% Genuine Escor...
Call Girls In Connaught Place Delhi ❤️88604**77959_Russian 100% Genuine Escor...Call Girls In Connaught Place Delhi ❤️88604**77959_Russian 100% Genuine Escor...
Call Girls In Connaught Place Delhi ❤️88604**77959_Russian 100% Genuine Escor...
 
2024 Numerator Consumer Study of Cannabis Usage
2024 Numerator Consumer Study of Cannabis Usage2024 Numerator Consumer Study of Cannabis Usage
2024 Numerator Consumer Study of Cannabis Usage
 
Best Practices for Implementing an External Recruiting Partnership
Best Practices for Implementing an External Recruiting PartnershipBest Practices for Implementing an External Recruiting Partnership
Best Practices for Implementing an External Recruiting Partnership
 
RE Capital's Visionary Leadership under Newman Leech
RE Capital's Visionary Leadership under Newman LeechRE Capital's Visionary Leadership under Newman Leech
RE Capital's Visionary Leadership under Newman Leech
 
Call Girls In Sikandarpur Gurgaon ❤️8860477959_Russian 100% Genuine Escorts I...
Call Girls In Sikandarpur Gurgaon ❤️8860477959_Russian 100% Genuine Escorts I...Call Girls In Sikandarpur Gurgaon ❤️8860477959_Russian 100% Genuine Escorts I...
Call Girls In Sikandarpur Gurgaon ❤️8860477959_Russian 100% Genuine Escorts I...
 
BEST Call Girls In Greater Noida ✨ 9773824855 ✨ Escorts Service In Delhi Ncr,
BEST Call Girls In Greater Noida ✨ 9773824855 ✨ Escorts Service In Delhi Ncr,BEST Call Girls In Greater Noida ✨ 9773824855 ✨ Escorts Service In Delhi Ncr,
BEST Call Girls In Greater Noida ✨ 9773824855 ✨ Escorts Service In Delhi Ncr,
 
Sales & Marketing Alignment: How to Synergize for Success
Sales & Marketing Alignment: How to Synergize for SuccessSales & Marketing Alignment: How to Synergize for Success
Sales & Marketing Alignment: How to Synergize for Success
 
Progress Report - Oracle Database Analyst Summit
Progress  Report - Oracle Database Analyst SummitProgress  Report - Oracle Database Analyst Summit
Progress Report - Oracle Database Analyst Summit
 
rishikeshgirls.in- Rishikesh call girl.pdf
rishikeshgirls.in- Rishikesh call girl.pdfrishikeshgirls.in- Rishikesh call girl.pdf
rishikeshgirls.in- Rishikesh call girl.pdf
 
NewBase 22 April 2024 Energy News issue - 1718 by Khaled Al Awadi (AutoRe...
NewBase  22 April  2024  Energy News issue - 1718 by Khaled Al Awadi  (AutoRe...NewBase  22 April  2024  Energy News issue - 1718 by Khaled Al Awadi  (AutoRe...
NewBase 22 April 2024 Energy News issue - 1718 by Khaled Al Awadi (AutoRe...
 
BEST Call Girls In Old Faridabad ✨ 9773824855 ✨ Escorts Service In Delhi Ncr,
BEST Call Girls In Old Faridabad ✨ 9773824855 ✨ Escorts Service In Delhi Ncr,BEST Call Girls In Old Faridabad ✨ 9773824855 ✨ Escorts Service In Delhi Ncr,
BEST Call Girls In Old Faridabad ✨ 9773824855 ✨ Escorts Service In Delhi Ncr,
 
Pitch Deck Teardown: NOQX's $200k Pre-seed deck
Pitch Deck Teardown: NOQX's $200k Pre-seed deckPitch Deck Teardown: NOQX's $200k Pre-seed deck
Pitch Deck Teardown: NOQX's $200k Pre-seed deck
 
Call Girls In ⇛⇛Chhatarpur⇚⇚. Brings Offer Delhi Contact Us 8377877756
Call Girls In ⇛⇛Chhatarpur⇚⇚. Brings Offer Delhi Contact Us 8377877756Call Girls In ⇛⇛Chhatarpur⇚⇚. Brings Offer Delhi Contact Us 8377877756
Call Girls In ⇛⇛Chhatarpur⇚⇚. Brings Offer Delhi Contact Us 8377877756
 
(8264348440) 🔝 Call Girls In Hauz Khas 🔝 Delhi NCR
(8264348440) 🔝 Call Girls In Hauz Khas 🔝 Delhi NCR(8264348440) 🔝 Call Girls In Hauz Khas 🔝 Delhi NCR
(8264348440) 🔝 Call Girls In Hauz Khas 🔝 Delhi NCR
 
Call Girls In Kishangarh Delhi ❤️8860477959 Good Looking Escorts In 24/7 Delh...
Call Girls In Kishangarh Delhi ❤️8860477959 Good Looking Escorts In 24/7 Delh...Call Girls In Kishangarh Delhi ❤️8860477959 Good Looking Escorts In 24/7 Delh...
Call Girls In Kishangarh Delhi ❤️8860477959 Good Looking Escorts In 24/7 Delh...
 
Lowrate Call Girls In Sector 18 Noida ❤️8860477959 Escorts 100% Genuine Servi...
Lowrate Call Girls In Sector 18 Noida ❤️8860477959 Escorts 100% Genuine Servi...Lowrate Call Girls In Sector 18 Noida ❤️8860477959 Escorts 100% Genuine Servi...
Lowrate Call Girls In Sector 18 Noida ❤️8860477959 Escorts 100% Genuine Servi...
 
The CMO Survey - Highlights and Insights Report - Spring 2024
The CMO Survey - Highlights and Insights Report - Spring 2024The CMO Survey - Highlights and Insights Report - Spring 2024
The CMO Survey - Highlights and Insights Report - Spring 2024
 
Cash Payment 9602870969 Escort Service in Udaipur Call Girls
Cash Payment 9602870969 Escort Service in Udaipur Call GirlsCash Payment 9602870969 Escort Service in Udaipur Call Girls
Cash Payment 9602870969 Escort Service in Udaipur Call Girls
 
Call Girls Miyapur 7001305949 all area service COD available Any Time
Call Girls Miyapur 7001305949 all area service COD available Any TimeCall Girls Miyapur 7001305949 all area service COD available Any Time
Call Girls Miyapur 7001305949 all area service COD available Any Time
 

Financial Statements

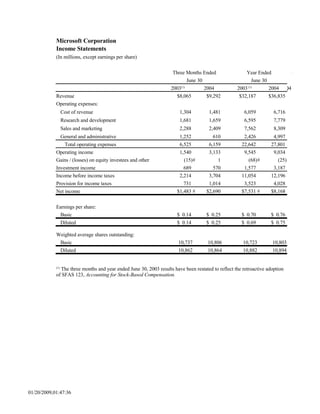
  • 1. Microsoft Corporation Income Statements (In millions, except earnings per share) Three Months Ended Year Ended Y/Y Growth June 30 June 30 2003(1) 2004 2003 (1) 2004 Q4 Revenue $8,065 $9,292 $32,187 $36,835 ### Operating expenses: Cost of revenue 1,304 1,481 6,059 6,716 ### Research and development 1,681 1,659 6,595 7,779 ### Sales and marketing 2,288 2,409 7,562 8,309 ### General and administrative 1,252 610 2,426 4,997### Total operating expenses 6,525 6,159 22,642 27,801### Operating income 1,540 3,133 9,545 9,034### Gains / (losses) on equity investees and other (15) ### 1 (68) ### (25) Investment income 689 570 1,577 3,187 Income before income taxes 2,214 3,704 11,054 12,196### Provision for income taxes 731 1,014 3,523 4,028 Net income $1,483 ### $2,690 $7,531 ### $8,168### Earnings per share: Basic $ 0.14 $ 0.25 $ 0.70 $ 0.76 ### Diluted $ 0.14 $ 0.25 $ 0.69 $ 0.75 ### Weighted average shares outstanding: Basic 10,737 10,806 10,723 10,803 Diluted 10,862 10,864 10,882 10,894 The three months and year ended June 30, 2003 results have been restated to reflect the retroactive adoption (1) of SFAS 123, Accounting for Stock-Based Compensation. 01/20/2009,01:47:36
  • 2. Microsoft Corporation Balance Sheets (In millions) June 30, 2003 (1) June 30, 2004 Assets Current assets: Cash and equivalents $ 6,438 $ 15,982 Short-term investments 42,610 44,610 Total cash and short-term investments 49,048 60,592 Accounts receivable, net 5,196 5,890 Inventories 640 421 Deferred income taxes 2,506 2,097 Other 1,583 1,566 Total current assets 58,973 70,566 Property and equipment, net 2,223 2,326 Equity and other investments 13,692 12,210 Goodwill 3,128 3,115 Intangible assets, net 384 569 Deferred income taxes 2,161 1,829 Other long-term assets 1,171 1,774 Total assets $81,732 $92,389 Liabilities and stockholders' equity Current liabilities: Accounts payable $ 1,573 $ 1,717 Accrued compensation 1,416 1,339 Income taxes 2,044 3,478 Short-term unearned revenue 7,225 6,514 Other 1,716 1,921 Total current liabilities 13,974 14,969 Long-term unearned revenue 1,790 1,663 Other long-term liabilities 1,056 932 Stockholders' equity: Common stock and paid-in capital - shares authorized 24,000; Shares issued and outstanding 10,771 and 10,862 49,234 56,396 Retained earnings, including accumulated other comprehensive income of $1,840 and $1,119 15,678 18,429 Total stockholders' equity 64,912 74,825 Total liabilities and stockholders' equity $81,732 $92,389 June 30, 2003 balance sheet has been restated to reflect the retroactive adoption of SFAS 123, Accounting (1) for Stock-Based Compensation. 01/20/2009/01:47:36
  • 3. Microsoft Corporation Cash Flows Statements (In millions) Three Months Ended Year Ended June 30 June 30 2003 2003 2004 2004 (1) (1) Operations Net income $1,483 $2,690 $7,531 $8,168 Depreciation, amortization, and other non-cash items 462 309 1,393 1,186 Stock based compensation 665 739 3,749 5,734 Net recognized (gains) / losses on investments (218) (184) 380 (1,296) Stock option income tax benefits 375 328 1,365 1,100 Deferred income taxes 468 (554) (894) (1,479) Unearned revenue 3,463 3,996 12,519 11,777 Recognition of unearned revenue (2,984) (3,259) (11,292) (12,527) Accounts receivable (1,038) (1,056) 187 (687) Other current assets (6) 122 412 478 Other long-term assets 3 (1) (28) 34 Other current liabilities (3) (868) 35 2,063 Other long-term liabilities 19 (604) 440 75 Net cash from operations $2,689 $1,658 $15,797 $14,626 Financing Common stock issued 731 1,296 2,120 2,748 Common stock repurchased (1,214) 0 (6,486) (3,383) Common stock dividends 0 0 (857) (1,729) Net cash from financing ($483) $1,296 ($5,223) ($2,364) Investing Additions to property and equipment (273) (557) (891) (1,109) Acquisition of companies, net of cash acquired (172) 0 (1,063) (4) Purchases of investments (18,424) (25,940) (89,621) (92,495) Maturities of investments 1,963 1,725 9,205 5,561 Sales of investments 16,816 28,462 75,157 85,302 Net cash from investing ($90) $3,690 ($7,213) ($2,745) Net change in cash and equivalents 2,116 6,644 3,361 9,517 Effect of exchange rates on cash and equivalents 22 (10) 61 27 Cash and equivalents, beginning of period 4,300 9,348 3,016 6,438 Cash and equivalents, end of period $6,438 $15,982 $6,438 $15,982 The three months and year ended June 30, 2003 cash flows statements have been restated to reflect the retroactive (1) adoption of SFAS 123, Accounting for Stock-Based Compensation. 01/20/2009,01:47:36
  • 4. Microsoft Corporation Segment Revenue and Operating Income / (Loss) (In millions) Three Months Ended Year Ended Revenue June 30 June 30 2003 2004 2003 2004 Segments Client $2,526 $2,754 $10,394 $11,546 Server and Tools 1,925 2,306 7,140 8,483 Information Worker 2,349 2,879 9,229 10,800 Microsoft Business Solutions 179 196 567 667 MSN 559 588 1,953 2,216 Mobile and Embedded Devices 44 70 156 247 Home and Entertainment 483 499 2,748 2,876 Total revenue $8,065 $9,292 $32,187 $36,835 Three Months Ended Year Ended Operating Income / (Loss) June 30 June 30 2004 2004 2003(1) 2003(1) Segments Client $1,869 $2,061 $8,017 $8,015 Server and Tools 307 567 1,121 96 Information Worker 1,475 1,960 6,486 7,151 Microsoft Business Solutions (73) (42) (309) (255) MSN (83) 35 (567) 121 Mobile and Embedded Devices (68) (42) (277) (224) Home and Entertainment (245) (339) (1,191) (1,215) Other (1,642) (1,067) (3,735) (4,655) Total operating income / (loss) $1,540 $3,133 $9,545 $9,034 (1) The three months and year ended June 30, 2003 results have been restated to reflect the retroactive adoption of SFAS 123, Accounting for Stock-Based Compensation. 01/20/2009,01:47:36