More Related Content
Similar to occidental petroleum Core Results and Reported Earnings Release
Similar to occidental petroleum Core Results and Reported Earnings Release (20)
occidental petroleum Core Results and Reported Earnings Release
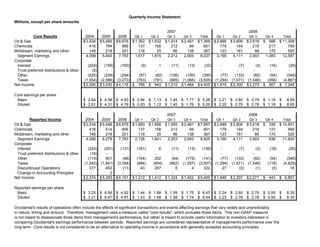
- 1. Quarterly Income Statement
Millions, except per share amounts
2007 2008
Core Results 2004 2005 2006 Qtr 1 Qtr 2 Qtr 3 Qtr 4 Total Qtr 1 Qtr 2 Qtr 3 Qtr 4 Total
Oil & Gas $ 3,534 $ 5,490 $ 6,676 $ 1,362 $ 1,632 $ 1,914 $ 2,461 $ 7,369 $ 2,888 $ 3,806 $ 3,618 $ 996 $ 11,308
Chemicals 416 784 906 137 158 212 94 601 179 144 219 217 759
Midstream, marketing and other 148 219 201 118 25 86 138 367 123 161 66 170 520
Segment Earnings 4,098 6,493 7,783 1,617 1,815 2,212 2,693 8,337 3,190 4,111 3,903 1,383 12,587
Corporate
Interest (224) (159) (100) (9) 1 (11) (13) (32) - (7) (3) (16) (26)
Trust preferred distributions & other (5) - - - - - - - - - -
Other (225) (238) (294) (57) (82) (106) (150) (395) (77) (133) (82) (54) (346)
Taxes (1,554) (2,566) (3,273) (763) (791) (885) (1,066) (3,505) (1,294) (1,671) (1,546) (356) (4,867)
Net Income $ 2,090 $ 3,530 $ 4,116 $ 788 $ 943 $ 1,210 $ 1,464 $ 4,405 $ 1,819 $ 2,300 $ 2,272 $ 957 $ 7,348
Core earnings per share
Basic $ 2.64 $ 4.38 $ 4.83 $ 0.94 $ 1.13 $ 1.45 $ 1.77 $ 5.28 $ 2.21 $ 2.80 $ 2.79 $ 1.18 $ 8.99
Diluted $ 2.61 $ 4.31 $ 4.78 $ 0.93 $ 1.12 $ 1.45 $ 1.76 $ 5.25 $ 2.20 $ 2.79 $ 2.78 $ 1.18 $ 8.95
2007 2008
Reported Income 2004 2005 2006 Qtr 1 Qtr 2 Qtr 3 Qtr 4 Total Qtr 1 Qtr 2 Qtr 3 Qtr 4 Total
Oil & Gas $ 3,534 $ 5,446 $ 6,676 $ 1,883 $ 1,658 $ 1,955 $ 2,461 $ 7,957 $ 2,888 $ 3,806 $ 3,618 $ 339 $ 10,651
Chemicals 416 614 906 137 158 212 94 601 179 144 219 127 669
Midstream, marketing and other 148 219 201 118 25 86 138 367 123 161 66 170 520
Segment Earnings 4,098 6,279 7,783 2,138 1,841 2,253 2,693 8,925 3,190 4,111 3,903 636 11,840
Corporate
Interest (224) (201) (131) (181) 6 (11) (13) (199) - (7) (3) (16) (26)
Trust preferred distributions & other (16) - - - - - - - - - - -
Other (119) 601 (96) (104) 202 (64) (175) (141) (77) (133) (82) (54) (346)
Taxes (1,542) (1,841) (3,354) (684) (904) (862) (1,057) (3,507) (1,294) (1,671) (1,546) (118) (4,629)
Discontinued Operations 377 452 (11) 43 267 8 4 322 27 (3) (1) (5) 18
Change in Accounting Principles - 3 - - - - - - - - -
Net Income $ 2,574 $ 5,293 $ 4,191 $ 1,212 $ 1,412 $ 1,324 $ 1,452 $ 5,400 $ 1,846 $ 2,297 $ 2,271 $ 443 $ 6,857
Reported earnings per share
Basic $ 3.25 $ 6.56 $ 4.92 $ 1.44 $ 1.68 $ 1.59 $ 1.75 $ 6.47 $ 2.24 $ 2.80 $ 2.79 $ 0.55 $ 8.39
Diluted $ 3.21 $ 6.47 $ 4.87 $ 1.43 $ 1.68 $ 1.58 $ 1.74 $ 6.44 $ 2.23 $ 2.78 $ 2.78 $ 0.55 $ 8.35
Occidental's results of operations often include the effects of significant transactions and events affecting earnings that vary widely and unpredictably
in nature, timing and amount. Therefore, management uses a measure called quot;core resultsquot;, which excludes those items. This non-GAAP measure
is not meant to disassociate those items from management's performance, but rather is meant to provide useful information to investors interested in
comparing Occidental's earnings performance between periods. Reported earnings are considered representative of management's performance over the
long term. Core results is not considered to be an alternative to operating income in accordance with generally accepted accounting principles.