SlideShare a Scribd company logo
1 of 54
Sheet1VARIABLE INFORMATION - POPULATION - 50
WAITERSGENDERMale27Female2350AGE20-301330-402640
more 1150QUALIFICATION1 - Professional152 -
Paraprofessional233 - Nonprofessional1250WORSITEOn-
Site50Off-site050KNOWLEDGE BEFORE TRAININGwe will
use some questions of the questionnaire that is in our research
scenario. I dont know how you can use it. Level 1 -
weak22Level 2 - medium19Level 3 -
advanced950KNOWLEDGE AFTER TRAININGWE MUST
DECIDE based on the quantitative analysis Level 1 -
weak0Level 2 - medium0Level 3 - advanced0YEARS OF
EXPERIENCE1-3 Years93-5 Years215 plus Years2050LEVEL
OF CONFIDENCEwe also can use the answers from our
questionnaire. Based on their correct answers we can measure
their confidence1 to 33 to 66 to 10EXAM - cetificate of
knowledgeReceived 38Non received 1250
I. A Feedback Model of the Research Process
II. Strategies for Statistical Thinking
The purpose of this section is to provide students basic
strategies to practice statistical thinking, in addition to
fundamental applications.
Teaching statistical thinking and improving performance
involves learning how to resolve a number of ambiguities
during the statistical inquiry process that are not found in
typical homework problems and exams. Inquiry with ill-
structured problems requires a number of skills that need to be
developed during the course:
a. “Generating a curiosity about the world that identifies “I
wonder problems”;
b. Writing a measurable question that provides insight into
these problems;
c. Determining relevant valid and accessible data;
d. Planning and carrying out data collection;
e. Checking, cleaning and organizing data;
f. Recognizing the data's limitations;
g. Analyzing and interpreting data;
h. Articulating findings;
i. Seeking explanations; and,
j. Generating further questions (4)”.
This iterative process often requires revision as new
understandings develop and unanticipated problems or
opportunities arise. The weekly discussion questions provide an
opportunity to develop inquiry skills throughout the course.
Inquiry is a well-accepted (but not always implemented) process
in other subjects, such as science and social studies, but
requires development of skills often absent in statistics courses,
like the ones listed below:
· “Ability to cope with ambiguity and uncertainty;
· Re-balance between instructor guidance and student
independence;
· Recognition of opportunities for learning in unexpected
outcomes;
· Flexible and creative thinking;
· Deep understanding of disciplinary content; and
· Tolerance for periods of noise and disorganization (4)”.
This overview discusses the thought processes involved in
statistical problem solving in the broad sense from problem
formulation to conclusions. It draws on the literature and on the
article published by C. J. Wild and M. Pfannkuch, Statistical
Thinking in Empirical Enquiry,aimed at uncovering the
statistical reasoning processes. The content for this overview
has been excerpted from this article and has been modified and
adapted to help students develop a framework for statistical
thinking throughout the course.
The process from problem specification to outcome is complex
and iterative. Not only is the process iterative, but at each stage
one often looks back to the previous step and re-evaluates the
validity of the decisions made. The process is described in
terms of a sequence of steps labeled PPDAC: Problem; Plan;
Data; Analysis; and Conclusions, that is useful for statistical
thinking (1). The PPDAC approach is shown in the figure
below.
Figure I. PPDAC Model: Problem; Plan; Data; Analysis; and
Conclusions (1)
This diagram(1) shows that, although the clockwise sequence
(1→5) applies as the principal flow, each stage may, and often
will, feed back to the previous stage. In addition, it may well be
beneficial to examine the process in the reverse direction,
starting with Problem definition and then examining
expectations as to the format and structure of the Conclusions.
This procedure then continues, step-by-step, in a
counterclockwise manner (e→a) determining the implications of
these expectations for each stage of the process (The
Pennsylvania State University, 2010).
The PPDAC model develops information that is gathered by the
analysis data, such as detecting and describing patterns, trends,
and relations in data. As something relevant is detected in data,
new questions arise, causing specific parts to be viewed in more
detail.
Applied statistics is part of the information gathering and
learning process which is undertaken to inform decisions and
actions. Multiple sectors of society increasingly rely on data for
decision making, therefore, statistics has become an integral
part of the emerging information era that is used to expand the
body of knowledge in many fields. As shown in Figure III (3),
learning is much more than collecting information, it involves
synthesizing the new ideas and information with existing ideas
and information into an improved understanding.
Figure II. Triggers for stimulating descriptive, inferential, and
contextual thoughts (Pfannkuch, M., 2010)
Wild and Pfannkuch (1999) paper on statistical thinking
describes a four dimensional framework for statistical thinking
and inquiry, which is shown in Figure IV (2). It includes an
investigative cycle, an interrogative cycle, types of thinking and
dispositions. The authors characterize these processes through
models that can be used as a basis for thinking tools for the
enhancement of problem-solving. A brief description for each of
these models is presented in the subsequent paragraphs.
Figure IV.A 4-Dimensional Framework for Statistical Thinking
(C. J. Wild and M. Pfannkuch, 1999)
1. Dimension One: The Investigative Cycle
The first dimension is illustrated in Figure (a) Dimension 1(2).
It concerns the way one acts and what one thinks about during
the course of a statistical investigation. Certain learning goals
must be met to arrive at the desired level of understanding. A
PPDAC investigative cycle is set off to achieve each learning
goal. Knowledge gained and needs identified within these
cycles may initiate further investigative cycles. The conclusions
from the investigations feed into an expanded context-
knowledge base which can then inform any actions (C. J. Wild,
1999).
(C. J. Wild and M. Pfannkuch, 1999)
2. Dimension Two: Types of Thinking
A number of general and fundamental types of thinking are
shown in Figure (b) Dimension 2(2). The four dimensional
framework seeks to organize some of the elements of statistical
thinking during data-based enquiry. The thinker operates in all
four dimensions at once. For example the thinker could be
categorized as currently being in the planning stage of the
Investigative Cycle (Dimension I), dealing with some aspect of
variation in Dimension 2 (Types of Thinking) by criticizing a
tentative plan in Dimension 3 (Interrogative Cycle) driven by
skepticism in Dimension 4 (Dispositions). Who is doing this
thinking? Anyone involved in enquiry, either individually or as
a member of a team. While this approach is not peculiar to
statisticians, the quality of the thinking can be improved by
gaining more statistical knowledge (C. J. Wild, 1999).
3. Dimension Three: The Interrogative Cycle
The Interrogative Cycle illustrated in Figure (c) Dimension
3(2), is a generic thinking process in constant use in statistical
problem solving. It appears that the thinker is always in one of
the interrogative states while problem solving. The cycle
applies at macro levels, but also at very detailed levels of
thinking because the interrogative cycle is recursive. Sub-cycles
are initiated within major cycles, e.g. the "checking" step of any
cycle can initiate a full interrogative sub-cycle. The ordered
depiction on a wheel is an idealization of what perhaps should
happen. In reality steps are often missed. We discuss the
Interrogative Cycle as we observed it, being applied to
statistical enquiry and statistical critique. The "thinker" is
anyone involved in these activities (C. J. Wild, 1999).
(C. J. Wild and M. Pfannkuch, 1999)
4. Dimension Four: Dispositions
Dispositions are the personal qualities that affect, or even
initiate, entry into a thinking mode; they are summarized in
Figure (d) Dimension 4 (2). While these elements are generic,
they are discussed in the context of statistical problem solving.
(C. J. Wild and M. Pfannkuch, 1999)
· Curiosity and Awareness - Discoveries are triggered by
someone noticing something and reacting to internal questions
like "Why?', or "How did that happen?", or "Is this something
that happens more generally?', or "How can I exploit this?"
Being observant (aware) and curious are the well-springs of the
question generation process that all innovative learning results
from. Wild (1994) formed the slogan "Questions are more
important than answers" to emphasize this point (C. J. Wild,
1999).
· Engagement - It occurs when you become intensely interested
in a problem or area; a heightened sensitivity and awareness
develops towards information on the peripheries of the
experience that might be related to the problem. People are most
observant in those areas that they find most interesting.
Engagement intensifies each of the "dispositional" elements
curiosity, awareness, imagination and perseverance (C. J. Wild,
1999).
How do we become engaged? Spontaneous interest is innate;
background knowledge helps - it is hard to be interested in
something one knows nothing about. Being paid to do a job
helps, as does the problem being important to people we care
about. This may be our main difficulty in getting statistics
students to think. They simply do not find the problems they are
asked to think about interesting enough to be really engaged by
them. We observed the effects on performance of engagement
with some tasks and not others in the statistics students (C. J.
Wild, 1999).
· Imagination - It is hard to overemphasize the importance of
imagination to statistical thinking. The formation of mental
models that grasp the essential dynamics of a problem is a
deeply imaginative process, as is viewing a situation from
different perspectives, and generating possible explanations or
confounding explanations for phenomena and features of data
(C. J. Wild, 1999).
· Skepticism: By skepticism, we mean a tendency to be
constantly on the lookout for logical and factual flaws when
receiving new ideas and information. It is a quality statisticians
both possess and value. Some writers refer to this as "adopting a
critical attitude" (C. J. Wild, 1999).
· Being logical - The ability to detect when one idea follows
from another and when it does not and, to construct a logical
argument is clearly important to all thinking. Synthesis of new
information with existing knowledge is largely a matter of
seeing implications. Logical reasoning is the only sure way to
arrive at valid conclusions. To be useful, skepticism must be
supported by ability to reason from assumptions or information
to implications that can be checked against data (C. J. Wild,
1999).
A propensity to seek deeper meaning means not simply taking
things at face value and being prepared to dig a little deeper. Of
the other "dispositions", openness helps us to register and
consider new ideas and information that conflict with our own
assumptions and perseverance is self-evident (C. J. Wild, 1999).
Can "dispositions" be taught? - A person's "dispositions" are
typically problem dependent - they change according to the
degree to which the person is engaged by the problem. While
some people are skeptical and others are credulous, it seems
that credulousness in a particular area is a result of ignorance.
That is, as you gain experience and see ways in which certain
types of information can be unsoundly based and turn out to be
false, you become more skeptical. What we want from
skepticism is a prompting to raise certain types question
concerning the reliability of information, which can be taught
(C. J. Wild, 1999).
INFERENTIAL
15
Research
Questions
Research
Design
Research
Topic
Purpose
Literature
Review
Value of
the Study
Expected
Results
Research Process Feedback Loops
1. Turn your idea into a research question
First stages
Where do you start?
o What is your aim? (In general terms)
o What is your hypothesis? (In specific terms)
o Is your idea novel? (See Section 2 on reviewing the literature)
o Why does it matter?
o How will NHS patients or service users benefit form your
research?
Consult
o colleagues and other researchers
Juan
Typewritten Text
Research Methods Lectures
http://www.learningdomain.com/PhD/HOMEphd.html
Juan
Typewritten Text
Student Researcher's Toolkit
http://global.oup.com/uk/orc/sociology/brymansrm4e/01student/
toolkit/
Juan
Typewritten Text
Your Dissertation Proposal
http://www.le.ac.uk/oerresources/internationalrelations/dissertat
ionwriting/index.htm
Juan
Typewritten Text
© 2012 Juan C. Hernandez, PhD.
o These eight tutorials will teach you how to become an
effective researcher
develop your information literacy and critical thinking skills.
Approaches
2. Review the Literature
It is essential that existing sources of evidence, especially
systematic reviews, are
considered carefully prior to undertaking research. Research
which duplicates other
work unnecessarily or which is not of sufficient quality to
contribute something
useful to existing knowledge is in itself unethical.
Conducting a literature review will expand your knowledge
about the topic hone your
information seeking skills, i.e., the ability to scan the literature
efficiently to identify a
set of useful articles and books.
To be effective, a literature review must satisfy the following
requirements:
1. be organized around and related directly to the research
questions you are
developing;
2. synthesize results into a summary of what is and is not
known;
3. identify areas of controversy in the literature;
4. formulate questions that need further research.
Where do I start?
(available at most
university libraries)
or
action
incomplete information
The purpose of writing a literature review is to convey the
knowledge and ideas have
been established on a topic, and their strengths and weaknesses.
The literature
review must be defined by a guiding concept, such as your
research objective or the
problem or issue you are discussing; it is not just a descriptive
list of the material
available, or a set of summaries
http://www.southalabama.edu/coe/bset/johnson/dr_johnson/2lect
ures.htm
http://www.sagepub.com/bjohnsonstudy/index.htm
Please see the following references for additional information.
They provide excellent
tips and questions you should ask yourself about conducting a
literature review and
each book or article you include.
3. Design the Study and Develop Methods
Qualitative and Quantitative Research Methods
Which research method is most appropriate to your research
project? Do
you know the difference between quantitative and qualitative
research
methods?
n appropriate method of research
Adapted from material by Keith Chantler, R&D Manager,
Central Manchester and
Manchester Children's University Hospitals (Page 11 - Table of
comparison)
Participant Involvement
Consider the effect of your research on the participants.
problems for those
taking part?
study works well in
the real world. Engagement should:
o Be as early as possible in the process
o Could be in the form of a small focus group, users on your
study design
team or speaking to a relevant patient support or other group.
Writing Qualitative and Quantitative Research Questions
The following sites offer useful steps for writing good
qualitative and quantitative
research questions:
Survey Design
Do you know what is the most appropriate survey method for
your research project?
What method will give you the most useful data for the project
you
are working on? The Research Methods Knowledge Base has
many useful
http://www.writing.utoronto.ca/advice/specific-types-of-
writing/literature-review
http://www.writing.utoronto.ca/advice/specific-types-of-
writing/literature-review
http://www.writing.utoronto.ca/advice/specific-types-of-
writing/literature-review
http://library.ucsc.edu/help/howto/write-a-literature-review
http://www.writing.utoronto.ca/advice/specific-types-of-
writing/literature-review
http://writingcenter.unc.edu/resources/handouts-demos
http://www.southalabama.edu/coe/bset/johnson/dr_johnson/2lect
ures.htm
http://www.rdinfo.org.uk/flowchart/Characteristics.htm
http://masscommtheory.com/2011/05/05/writing-good-
qualitative-research-questions/
http://www.southalabama.edu/coe/bset/johnson/oh_master/Ch3/
Tab03-07.pdf
http://www.socialresearchmethods.net/kb/index.php
sections on social research methods including: Survey Research
Sampling
What method of sampling will give you the most useful data for
the project
you are working on?
Guide
-
probability sampling
methods
Statistical Issues
Are you familiar with the statistics you may need to use? If not,
consider
enrolling on a suitable course. Other tools and guidance:
g Terms
Andrews University
Questionnaire Design
Do you know how to design a questionnaire for survey
research?
s Sampling
4. Writing your research proposal
Starting your research proposal
development process (see
section 3) and ideally have several involved throughout the
development process
proposal.
that are
scientifically sound and ethical.
two proposals are the same, but they will all have a
similar structure:
(Adapted from material by Keith Chantler, R&D Manager,
Central Manchester
and Manchester Children's Hospitals)
o title
http://www.socialresearchmethods.net/kb/survey.php
http://www.nao.org.uk/publications/samplingguide.pdf
http://www.socialresearchmethods.net/kb/sampprob.php
http://www.socialresearchmethods.net/kb/sampnon.php
http://www.statsoft.com/textbook/
http://www.socialresearchmethods.net/kb/sampstat.php
http://psy.st-andrews.ac.uk/resources/glossary.shtml
http://iss.leeds.ac.uk/info/312/surveys/217/guide_to_the_design
_of_questionnaires
http://home.ubalt.edu/ntsbarsh/stat-data/surveys.htm
o abstract/summary
o background or rationale of the project
o aims/objectives
o experimental design and methods
o ethical considerations
o benefits of the study
o resources and costs
Key elements in a research proposal (from Hull & East
Yorkshire
Hospitals NHS Trust R&D Resource pack)
Use the following to check if you have included everything you
need in
your research proposal:
o What is your research question?
o Why does it matter?
o How will you address this question? (i.e. what will be your
methodology?)
o What is the significance of this research study?
o Is your research question clear?
o Are your research methods appropriate?
o How many subjects do you need? How will you choose them?
o What statistic will you use? See the following useful web
sites.
When writing a proposal it is important to consider who will be
reviewing it, such as
members of dissertation committees. The following offers
advice on writing clearly &
effectively.
1. Understand your task
Lack of understanding is a common cause of confused writing,
(eg. rambling
sentences, jumbled paragraphs, vagueness). Unless you
understand clearly
what you
have to do, you can't hope to write plainly about it. Before you
begin, ask
yourself:
o What has to be done? Why?
o For whom? In what form?
o Ways to clarify understanding include: asking, conferring,
consulting
brainstorming, doodling, 'free writing', outlining, note taking
using a
'critical friend' making diagrams, drawings, flowcharts, lists,
summaries
reading instructions and checking requirements.
The earlier efforts to clarify understandings are made the more
likely they are to
be
effective. In the early stages of writing, you are more likely to
be receptive to
comments and ideas of others and be able to make changes
easily. At first,
http://www.rdinfo.org.uk/flowchart/Design%20of%20the%20res
earch%20proposal.doc
http://www.rddirect.org.uk/queries/Website.asp#4
concentrate on putting down ideas and information without
assigning value to
them. If
you are unsure about how or where to begin, just start writing,
i.e., 'free write'. As
you
do, your understanding should become clearer and you can start
grouping like
points. (Try to keep all your preliminary notes and jottings.
Refer back to them as
your
writing develops to ensure nothing important has been
overlooked).
2. Write for your reader(s)
o Who is the reader? (eg. influence, position, etc.)
o How informed is the reader?
o What background information will the reader need? (e.g.,
circumstances,
o conditions, history, local context.)
o How does the reader want to use what you write?
o What writing style is appropriate? (If background information
interrupts
o the flow of your writing, include it in footnotes and/or
appendices.)
3. Put first things first
Give the most prominence and space to what is most important.
When writing a
report, put the most important information first. Put the most
important
information
first when writing a report.
4. Arrange your points logically
Logical organization is the basis of clarity. Ways to do this
include: advantages
and disadvantages; ascending/descending order; causes/effects;
chronology;
general and specific; priority; proximity; significance. (Where
items are of equal
importance and/or there is no preferred order, arrange
alphabetically.)
5. Write direct sentences
Ways to do this include:
o Using strong verbs rather than overused adjectives. Many
commonly used
adjectives have lost their impact. Words like magnificent,
wonderful, and
interesting mean very little. Reserve your adjectival sledge
hammers for
when they actually mean something.
o Using the active rather than passive voice. The active voice
indicates the
subject is doing the action of the verb. The move is from subject
to verb to
object (where there is an object). e.g.,: The director will return
incomplete
forms. The passive voice indicates the action is taking place but
not
necessarily who or what is committing the action. e.g.,:
Incomplete forms
will be returned by the director Active voice sentences are more
direct and
forceful than passive voice ones.
o Keeping sentences correct and simple. Keep sentences short.
Use two
sentences rather than join with 'and'. Have only one idea or
point per
sentence. Make sure subject agrees with verb. Be unfailingly
consistent
with person and tense.
o Being specific. If numbers continue to increase at the present
rate, more
staff will be needed in the future. Two further staff will be
required from 1st
January if increased enrolments continue, i.e., from 85 in
August to 120 in
October.
6. Distinguish fact from opinion
An acceptable discharge rate is being maintained, with 61% of
patients returning
home within two days. 61% of patients return home within two
days. Medical staff
consider this acceptable.
Use conventions as guidelines rather than rules
Use writing conventions to support and strengthen your writing.
'Do's' don't mean
always and 'Don'ts' don't mean never. Your first responsibility
is to write to
achieve
your goals, i.e., accurate, immediate, effective communication.
Review, revise and re-write
Writing is an art; Editing is a craft - both take time. Check
progressively for
accuracy and appropriateness, particularly of facts, spelling and
sentence
construction. Seek the advice and opinion of others. Remove all
unnecessary
words and information from finished copy.
5. Certification of Research Projects
This Institutional Review Board Handbook contains descriptions
of procedures and
forms required by Argosy University for any research project
conducted by employees
or students of Argosy University, and for the conduct of
research by outside
organizations or institutions seeking the involvement of any
Argosy University employee
or student. This includes research done for dissertations,
Clinical Research Projects
(CRPs), and other significant research, but it also includes
research done for student
posters, PowerPoint presentations, and class assignments where
research is being
done.
view Board Handbook
6. Analyze the data and interpret findings
Quantitative Data Analysis
that need to be
summarized, described and analyzed.
escribed and explored by
drawing graphs
and charts, doing cross tabulations and calculating means and
standard
deviations.
patterns and
relationships in the data by comparing means, exploring
correlations, performing
multiple regressions, or analyses of variance.
build sophisticated
explanations of how the data addresses the original question.
greatly, the following steps
are common in
quantitative data analysis:
o Identifying a data entry and analysis manager (e.g., SPSS)
o Reviewing data (e.g., surveys, questionnaires etc) for
completeness
o Coding data
o Conducting Data Entry
o Analyzing Data (e.g. statistical tests).
Qualitative Data Analysis
of words
generated by interviews or observational data.
themes that have
been identified or relate behavior or ideas to biographical
characteristics of
respondents.
data, or interpretation
sought of puzzling findings from previous studies.
tely theory could be developed and tested using
advanced analytical
techniques.
steps are typical for
qualitative data analysis:
o Familiarization with the data through repeated reading,
listening
http://www.ausfba.com/IRB/AU%20Institutional%20Review%2
0Board%20Handbook%20revised%20Oct%202010.pdf
o etc.
o Transcription of interview etc. material.
o Organization and indexing of data for easy retrieval and
o identification (e.g. by hand or computerized programs such as
(Nvivo)
o Maintaining anonymity of sensitive data.
o Coding (may be called indexing).
o Identification of themes.
o Development of provisional categories.
o Exploration of relationships between categories.
o Refinement of themes and categories.
o Development of theory and incorporation of pre-existing
knowledge.
For more information see 'Qualitative Research' from Trent
RDSU.
Interpreting Data
relevant information on
statistics
findings to see whether
they support your initial study hypotheses, theory or research
questions.
the
theoretical focus (i.e.,
Qualitative or Quantitative research) and methods (e.g.,
Multiple Regression,
Grounded Theory).
o Computer Package Manuals (e.g., SPSS, Nvivo) and
methodology books
o The material in Section 3 of this flowchart on statistics and
sampling
issues
http://www.qsrinternational.com/products_nvivo.aspx
http://www.rddirect.org.uk/queries/Website.asp#4
http://www.statsoft.com/textbook/multiple-regression/#general
http://www-01.ibm.com/software/analytics/spss/
http://www.qsrinternational.com/products_nvivo.aspx
Information Competence Tutorials
Information Competency Tutorials
Main Menu
Bilingual Version
Bilingual Version
Feedback
Feedback
Credits
● Welcome
● Technical
Requirements
● Additional Help
● Credits
Information for
Students
Information for Faculty
1. What you will
learn
2. Additional Help
3. How students
can use the
CUNY ICT
4. Choosing a
Topic and
Research
Strategies-
Tutorials 1 and
2
5. Finding
Information-
Tutorials 3 and
4
6. Evaluate the
Quality and
Bias of
Information
and Credit
Sources
Responsibly-
Tutorials 5, 6,
7 and 8
1. Information Literacy
2. How faculty can use the
CUNY ICT
3. Tutorial Content-
Quick Look
�❍ Tutorials 1 & 2:
Choosing a
Topic and
Research
Strategies
�❍ Tutorials 3 & 4:
Finding
Information
�❍ Tutorials 5, 6, 7
& 8: Evaluation
the Quality and
Bias of
Information and
Credit Sources
Responsibly
4. Assignment Resources
5. Additional Help
Welcome to the City University of New York Information
Competency Tutorials
(ICT).
These eight tutorials will not only teach you how to become an
A+ researcher but will
develop your information literacy and critical thinking skills.
The tutorials follow a set
of CUNY information literacy learning goals and objectives that
all students should
achieve by the time they have completed 60 credits.
Technical requirements
This tutorial requires the free Flash (version 5 or higher) player.
Click here for help
downloading Flash. You may be able to use Tutorial more
smoothly with FireFox
http://www.hostos.cuny.edu/library/info_lit/library/guide.html
(1 of 2) [3/23/2012 9:50:46 AM]
http://www.hostos.cuny.edu/library/info_lit/library/
http://www.hostos.cuny.edu/library/info_lit/library/indexSPA.ht
ml
http://www.hostos.cuny.edu/library/HHCL_New_Web/New_Spa
nish_Tutorial/revised/tutorialespanol/feedback.htm
http://www.hostos.cuny.edu/library/HHCL_New_Web/New_Spa
nish_Tutorial/revised/tutorialespanol/feedback.htm
http://www.hostos.cuny.edu/library/info_lit/library/feedback.ht
ml
http://www.hostos.cuny.edu/library/info_lit/library/credits.html
http://www.hostos.cuny.edu/library/info_lit/library/guidestudent
s.html#facultyinfo
http://www.hostos.cuny.edu/library/info_lit/library/guidestudent
s.html#facultyinfo
http://www.hostos.cuny.edu/library/info_lit/library/guidefac.ht
ml#studentinfo
http://www.hostos.cuny.edu/library/info_lit/library/guidestudent
s.html#youlearn
http://www.hostos.cuny.edu/library/info_lit/library/guidestudent
s.html#youlearn
http://www.hostos.cuny.edu/library/info_lit/library/guidestudent
s.html#additional
http://www.hostos.cuny.edu/library/info_lit/library/guidestudent
s.html#studenthow
http://www.hostos.cuny.edu/library/info_lit/library/guidestudent
s.html#studenthow
http://www.hostos.cuny.edu/library/info_lit/library/guidestudent
s.html#studenthow
http://www.hostos.cuny.edu/library/info_lit/library/guidestudent
s.html#topic
http://www.hostos.cuny.edu/library/info_lit/library/guidestudent
s.html#topic
http://www.hostos.cuny.edu/library/info_lit/library/guidestudent
s.html#topic
http://www.hostos.cuny.edu/library/info_lit/library/guidestudent
s.html#topic
http://www.hostos.cuny.edu/library/info_lit/library/guidestudent
s.html#topic
http://www.hostos.cuny.edu/library/info_lit/library/guidestudent
s.html#topic
http://www.hostos.cuny.edu/library/info_lit/library/guidestudent
s.html#findinfo
http://www.hostos.cuny.edu/library/info_lit/library/guidestudent
s.html#findinfo
http://www.hostos.cuny.edu/library/info_lit/library/guidestudent
s.html#findinfo
http://www.hostos.cuny.edu/library/info_lit/library/guidestudent
s.html#findinfo
http://www.hostos.cuny.edu/library/info_lit/library/guidestudent
s.html#evaluate
http://www.hostos.cuny.edu/library/info_lit/library/guidestudent
s.html#evaluate
http://www.hostos.cuny.edu/library/info_lit/library/guidestudent
s.html#evaluate
http://www.hostos.cuny.edu/library/info_lit/library/guidestudent
s.html#evaluate
http://www.hostos.cuny.edu/library/info_lit/library/guidestudent
s.html#evaluate
http://www.hostos.cuny.edu/library/info_lit/library/guidestudent
s.html#evaluate
http://www.hostos.cuny.edu/library/info_lit/library/guidestudent
s.html#evaluate
http://www.hostos.cuny.edu/library/info_lit/library/guidestudent
s.html#evaluate
http://www.hostos.cuny.edu/library/info_lit/library/guidestudent
s.html#evaluate
http://www.hostos.cuny.edu/library/info_lit/library/guidefac.ht
ml#infolit
http://www.hostos.cuny.edu/library/info_lit/library/guidefac.ht
ml#howfacultyuse
http://www.hostos.cuny.edu/library/info_lit/library/guidefac.ht
ml#howfacultyuse
http://www.hostos.cuny.edu/library/info_lit/library/guidefac.ht
ml#topic
http://www.hostos.cuny.edu/library/info_lit/library/guidefac.ht
ml#topic
http://www.hostos.cuny.edu/library/info_lit/library/guidefac.ht
ml#topic
http://www.hostos.cuny.edu/library/info_lit/library/guidefac.ht
ml#topic
http://www.hostos.cuny.edu/library/info_lit/library/guidefac.ht
ml#topic
http://www.hostos.cuny.edu/library/info_lit/library/guidefac.ht
ml#findinfo
http://www.hostos.cuny.edu/library/info_lit/library/guidefac.ht
ml#findinfo
http://www.hostos.cuny.edu/library/info_lit/library/guidefac.ht
ml#findinfo
http://www.hostos.cuny.edu/library/info_lit/library/guidefac.ht
ml#evaluate
http://www.hostos.cuny.edu/library/info_lit/library/guidefac.ht
ml#evaluate
http://www.hostos.cuny.edu/library/info_lit/library/guidefac.ht
ml#evaluate
http://www.hostos.cuny.edu/library/info_lit/library/guidefac.ht
ml#evaluate
http://www.hostos.cuny.edu/library/info_lit/library/guidefac.ht
ml#evaluate
http://www.hostos.cuny.edu/library/info_lit/library/guidefac.ht
ml#evaluate
http://www.hostos.cuny.edu/library/info_lit/library/guidefac.ht
ml#evaluate
http://www.hostos.cuny.edu/library/info_lit/library/guidefac.ht
ml#assignments
http://www.hostos.cuny.edu/library/info_lit/library/guidefac.ht
ml#help2
http://www.adobe.com/products/flashplayer/
Information Competence Tutorials
browser
Additional Help
Stop in, call or email your local campus library. Click here for a
list of CUNY Campus
Libraries
Credits
Web pages on which this introduction is based include:
California State University (CSU)
– Introductory Competencies in Specific Disciplines and CSU –
Information Competence
Project – Module Outlines
Spanish translation of the CUNY Information Competency
Tutorials was made possible by a grant from
the CUNY Office of Compliance and Diversity, Diversity
Projects Development Fund. Prof. José Diaz,
Hostos Community College and Prof. George Thorsen,
Queensborough Community College translated
these modules into Spanish. The Hostos Community College
Instructional Technology support center
staff migrated all of the IL Competency modules into a new,
more attractive format as part of a Perkins
Grant to provide 24/6 online tutorial resources to students. A
special thanks goes to Hostos Community
College and George Rosa, Elkin Urrea, and Carlos Victoria for
their work on the migration and design.
http://www.hostos.cuny.edu/library/info_lit/library/guide.html
(2 of 2) [3/23/2012 9:50:46 AM]
http://www1.cuny.edu/academics/info-
central/library/libinfo/CampusLibraryList.html
http://www1.cuny.edu/academics/info-
central/library/libinfo/CampusLibraryList.html
http://www.lib.calpoly.edu/infocomp/specific.html
http://www.lib.calpoly.edu/infocomp/project/outline.html
http://www.lib.calpoly.edu/infocomp/project/outline.htmlcuny.e
duInformation Competence Tutorials
I. A Feedback Model of the Research Process
II. Strategies for Statistical Thinking
The purpose of this section is to provide students basic
strategies to practice statistical thinking, in addition to
fundamental applications.
Teaching statistical thinking and improving performance
involves learning how to resolve a number of ambiguities
during the statistical inquiry process that are not found in
typical homework problems and exams. Inquiry with ill-
structured problems requires a number of skills that need to be
developed during the course:
a. “Generating a curiosity about the world that identifies “I
wonder problems”;
b. Writing a measurable question that provides insight into
these problems;
c. Determining relevant valid and accessible data;
d. Planning and carrying out data collection;
e. Checking, cleaning and organizing data;
f. Recognizing the data's limitations;
g. Analyzing and interpreting data;
h. Articulating findings;
i. Seeking explanations; and,
j. Generating further questions (4)”.
This iterative process often requires revision as new
understandings develop and unanticipated problems or
opportunities arise. The weekly discussion questions provide an
opportunity to develop inquiry skills throughout the course.
Inquiry is a well-accepted (but not always implemented) process
in other subjects, such as science and social studies, but
requires development of skills often absent in statistics courses,
like the ones listed below:
· “Ability to cope with ambiguity and uncertainty;
· Re-balance between instructor guidance and student
independence;
· Recognition of opportunities for learning in unexpected
outcomes;
· Flexible and creative thinking;
· Deep understanding of disciplinary content; and
· Tolerance for periods of noise and disorganization (4)”.
This overview discusses the thought processes involved in
statistical problem solving in the broad sense from problem
formulation to conclusions. It draws on the literature and on the
article published by C. J. Wild and M. Pfannkuch, Statistical
Thinking in Empirical Enquiry,aimed at uncovering the
statistical reasoning processes. The content for this overview
has been excerpted from this article and has been modified and
adapted to help students develop a framework for statistical
thinking throughout the course.
The process from problem specification to outcome is complex
and iterative. Not only is the process iterative, but at each stage
one often looks back to the previous step and re-evaluates the
validity of the decisions made. The process is described in
terms of a sequence of steps labeled PPDAC: Problem; Plan;
Data; Analysis; and Conclusions, that is useful for statistical
thinking (1). The PPDAC approach is shown in the figure
below.
Figure I. PPDAC Model: Problem; Plan; Data; Analysis; and
Conclusions (1)
This diagram(1) shows that, although the clockwise sequence
(1→5) applies as the principal flow, each stage may, and often
will, feed back to the previous stage. In addition, it may well be
beneficial to examine the process in the reverse direction,
starting with Problem definition and then examining
expectations as to the format and structure of the Conclusions.
This procedure then continues, step-by-step, in a
counterclockwise manner (e→a) determining the implications of
these expectations for each stage of the process (The
Pennsylvania State University, 2010).
The PPDAC model develops information that is gathered by the
analysis data, such as detecting and describing patterns, trends,
and relations in data. As something relevant is detected in data,
new questions arise, causing specific parts to be viewed in more
detail.
Applied statistics is part of the information gathering and
learning process which is undertaken to inform decisions and
actions. Multiple sectors of society increasingly rely on data for
decision making, therefore, statistics has become an integral
part of the emerging information era that is used to expand the
body of knowledge in many fields. As shown in Figure III (3),
learning is much more than collecting information, it involves
synthesizing the new ideas and information with existing ideas
and information into an improved understanding.
Figure II. Triggers for stimulating descriptive, inferential, and
contextual thoughts (Pfannkuch, M., 2010)
Wild and Pfannkuch (1999) paper on statistical thinking
describes a four dimensional framework for statistical thinking
and inquiry, which is shown in Figure IV (2). It includes an
investigative cycle, an interrogative cycle, types of thinking and
dispositions. The authors characterize these processes through
models that can be used as a basis for thinking tools for the
enhancement of problem-solving. A brief description for each of
these models is presented in the subsequent paragraphs.
Figure IV.A 4-Dimensional Framework for Statistical Thinking
(C. J. Wild and M. Pfannkuch, 1999)
1. Dimension One: The Investigative Cycle
The first dimension is illustrated in Figure (a) Dimension 1(2).
It concerns the way one acts and what one thinks about during
the course of a statistical investigation. Certain learning goals
must be met to arrive at the desired level of understanding. A
PPDAC investigative cycle is set off to achieve each learning
goal. Knowledge gained and needs identified within these
cycles may initiate further investigative cycles. The conclusions
from the investigations feed into an expanded context-
knowledge base which can then inform any actions (C. J. Wild,
1999).
(C. J. Wild and M. Pfannkuch, 1999)
2. Dimension Two: Types of Thinking
A number of general and fundamental types of thinking are
shown in Figure (b) Dimension 2(2). The four dimensional
framework seeks to organize some of the elements of statistical
thinking during data-based enquiry. The thinker operates in all
four dimensions at once. For example the thinker could be
categorized as currently being in the planning stage of the
Investigative Cycle (Dimension I), dealing with some aspect of
variation in Dimension 2 (Types of Thinking) by criticizing a
tentative plan in Dimension 3 (Interrogative Cycle) driven by
skepticism in Dimension 4 (Dispositions). Who is doing this
thinking? Anyone involved in enquiry, either individually or as
a member of a team. While this approach is not peculiar to
statisticians, the quality of the thinking can be improved by
gaining more statistical knowledge (C. J. Wild, 1999).
3. Dimension Three: The Interrogative Cycle
The Interrogative Cycle illustrated in Figure (c) Dimension
3(2), is a generic thinking process in constant use in statistical
problem solving. It appears that the thinker is always in one of
the interrogative states while problem solving. The cycle
applies at macro levels, but also at very detailed levels of
thinking because the interrogative cycle is recursive. Sub-cycles
are initiated within major cycles, e.g. the "checking" step of any
cycle can initiate a full interrogative sub-cycle. The ordered
depiction on a wheel is an idealization of what perhaps should
happen. In reality steps are often missed. We discuss the
Interrogative Cycle as we observed it, being applied to
statistical enquiry and statistical critique. The "thinker" is
anyone involved in these activities (C. J. Wild, 1999).
(C. J. Wild and M. Pfannkuch, 1999)
4. Dimension Four: Dispositions
Dispositions are the personal qualities that affect, or even
initiate, entry into a thinking mode; they are summarized in
Figure (d) Dimension 4 (2). While these elements are generic,
they are discussed in the context of statistical problem solving.
(C. J. Wild and M. Pfannkuch, 1999)
· Curiosity and Awareness - Discoveries are triggered by
someone noticing something and reacting to internal questions
like "Why?', or "How did that happen?", or "Is this something
that happens more generally?', or "How can I exploit this?"
Being observant (aware) and curious are the well-springs of the
question generation process that all innovative learning results
from. Wild (1994) formed the slogan "Questions are more
important than answers" to emphasize this point (C. J. Wild,
1999).
· Engagement - It occurs when you become intensely interested
in a problem or area; a heightened sensitivity and awareness
develops towards information on the peripheries of the
experience that might be related to the problem. People are most
observant in those areas that they find most interesting.
Engagement intensifies each of the "dispositional" elements
curiosity, awareness, imagination and perseverance (C. J. Wild,
1999).
How do we become engaged? Spontaneous interest is innate;
background knowledge helps - it is hard to be interested in
something one knows nothing about. Being paid to do a job
helps, as does the problem being important to people we care
about. This may be our main difficulty in getting statistics
students to think. They simply do not find the problems they are
asked to think about interesting enough to be really engaged by
them. We observed the effects on performance of engagement
with some tasks and not others in the statistics students (C. J.
Wild, 1999).
· Imagination - It is hard to overemphasize the importance of
imagination to statistical thinking. The formation of mental
models that grasp the essential dynamics of a problem is a
deeply imaginative process, as is viewing a situation from
different perspectives, and generating possible explanations or
confounding explanations for phenomena and features of data
(C. J. Wild, 1999).
· Skepticism: By skepticism, we mean a tendency to be
constantly on the lookout for logical and factual flaws when
receiving new ideas and information. It is a quality statisticians
both possess and value. Some writers refer to this as "adopting a
critical attitude" (C. J. Wild, 1999).
· Being logical - The ability to detect when one idea follows
from another and when it does not and, to construct a logical
argument is clearly important to all thinking. Synthesis of new
information with existing knowledge is largely a matter of
seeing implications. Logical reasoning is the only sure way to
arrive at valid conclusions. To be useful, skepticism must be
supported by ability to reason from assumptions or information
to implications that can be checked against data (C. J. Wild,
1999).
A propensity to seek deeper meaning means not simply taking
things at face value and being prepared to dig a little deeper. Of
the other "dispositions", openness helps us to register and
consider new ideas and information that conflict with our own
assumptions and perseverance is self-evident (C. J. Wild, 1999).
Can "dispositions" be taught? - A person's "dispositions" are
typically problem dependent - they change according to the
degree to which the person is engaged by the problem. While
some people are skeptical and others are credulous, it seems
that credulousness in a particular area is a result of ignorance.
That is, as you gain experience and see ways in which certain
types of information can be unsoundly based and turn out to be
false, you become more skeptical. What we want from
skepticism is a prompting to raise certain types question
concerning the reliability of information, which can be taught
(C. J. Wild, 1999).
INFERENTIAL
15
1. The project needs to have a ''Problem"" to be resolved (What
is the problem?)/survey technique
2. Define the population
3. Development the research question
4. Presentation Of final:
* Cover page
*Abstract - No more than 120 words. Use key words.
*Introduction
* Part I
* Part II
*Part III/V
*Conclusion
*References (at least 10, it is not necessary more than 10)
20% maximum of citations
Maximum length 15/16 pages full project/ 10 pages parts I to V
STEPS
1. (P) PROBLEM
2. (P) PLAN
3. (D) DATA - SECONDARY DATA?? How many restaurants
have done this kind of training? Did it work? Look for another
business in the same segment to compare.
4. (A) ANALYSIS
5. (C) CONCLUSIONS
STAGES SELECTING OF A SAMPLE
1. Define the target population
2. Select a sampling frame
3. Determine if a probability or nonprobability sampling
methods will be chosen
4. Plan procedure for selecting simple units
5. Determine sample size
6. Select actual sampling units
FIRST PART – THE RESEARCH SCENARIO
We are the management group of three high-end Italian-food
restaurants distributed in South Beach, Aventura and Brickell,
employing 25 waiters all of whom work on-site. We have been
in the business for the past five years making good profit, but
after been analyzing the new market of Miami and to see where
we would like to be positioned in the industry within the next
three years, we had reach to the conclusion that there is more
room to keep growing, so we had a meeting where we used the
brainstorming method to come up with fresh ideas. One of the
most important question that came up in the meeting to increase
the revenues was, how can we do to increase the average check
of the customers? This question took us to set a new short-term
goal, increase the average check. There are some different ways
to do it, but the most applicable, reachable, easier and with a
win-win way for our servers’ staff to be motivated and reach the
goal was increase the knowledge about the different types of
wines.
After agreeing to aim for the goal through this way, we needed
to train our staff, which will not be easy because they will have
to come to the trainings before the shift being motivated and
willing to learn. We convinced them that this training not only
will enrich their career in the hospitality industry, but also, it
will serve them in life, because knowing about wine is a tool
which you can use it for example when you go out to have a
dinner and discuss business with a probably investor, partner,
etc.
The process we established was, first, we hired a sommelier
(man who knows everything about wine) whose was going to be
in charge of doing the training. Then, he will do a test before
the training for our servers with the purpose to know how is
their current knowledge about wines (red wine, white wine,
champagne) where he divided in different categories to attend to
different classes based in the knowledge they had.
Subsequently, the training was presented in three categories
once a week for the next eight weeks. Once the training is over,
they will be conducting another assessment to categorize them
into different levels of knowledge, where the best will serve the
best tables in the restaurants (this means having the best
clientele and consequently more money for the worker). This is
because the best middlemen are more able to sell more wine, to
create a better customer relationship because they are more
knowledgeable about wine. For example, which region the wine
is from, which menu item will best match, what its taste, history
and other related thing.
This could sound meaningless but the clients after having this
experience where he is able to see how informed are the
workers at the restaurant, how good are the recommendations
they received, they will talk to their friends and will recommend
to come to visit the place and will be more likely to spend more
money.
PROBLEM STATED BY THE GROUP
The business is not selling so much wine as it could because the
waiters are not properly trained to sell it. They (the waiters)
have lack of knowledge about the wine, they don’t know from
where it comes, which grapes they are done, resulting in lost
profit and not satisfaction by consumers Comment by Adriana
Rigotti: This is your problem. . . .
Who are they? Waiters
How would you provide an adequate solution? Training
Purpose Comment by Adriana Rigotti: What is the difference
between white and red wine?
Offer the waiters an adequate training to leverage their
knowledge about wine.
QUESTIONS THAT WE SHOULD DO AND ANSWER
1. How are we going to train our staff? What is the solution?
2. Use descriptive Statistics (use chart name brand, quality and
cost. It is below)
3. We are measuring our staff in level 1, 2 and 3, based on their
knowledge about wine thought the questionnaire.
4. We should, by database, find out companies in the same field
that recently have done this kind of research and training and
compare with our business.
QUESTIONNAIRE that should be answered by waiters. We
should choose 5 to 6 questions to be answered. Comment by
Adriana Rigotti: How would you compare wine brands one over
the other?
1. What is corked wine?
2. Why does wine get its tannins from?
3. Why should you swirl a wine before smelling it?
4. How do red grapes make white wines?
5. What kind/taste of wine fits better with meat?
6. What kind/taste of wine fits better with pasta?
7. In which French wine region, you can find a grape
Chardonnay?
8. Why are the traditional 5 Bordeaux Grapes?
9. Chablis is made from which grape?
10. What are the 3 grapes that go into making Champagne?
11. The process of making Champagne is called?
12. What is a Blanc de Blanc Champagne?
13. What is a Blanc the Noir Champagne?
14. Name New Zealand 3 main grapes varieties
15. What’s the difference between Pouilly Fume and Pouilly
Fuisse?
16. Which Valley in France is Sancerre located?
17. Name 1 major wine producing region in Argentina.
Wine
Brand Name
Quality
Cost
Cost Volume Profit Analysis (CVP)
Number of units – assign a cost value?
Revenue = Cost
Why does variable cost per unit stay the same but total cost
varies with the number of units you produce?
How do you choose what activity base to use?
Why does fixed cost remain the same in total dollar
amount but increase or decrease per unit as the level of activity
changes?
What do increases in fixed cost do to break-even analysis?
What do increases in variable cost do to break-even analysis?
Pricing?
FIRST PART – THE RESEARCH SCENARIO
We are the management group of three Italian-food restaurants
distributed in South Beach, Aventura and Brickell, employing
around 50 employees. We have been in the business for the past
five years making good profit, but after been analyzing the new
market of Miami and to see where we would like to be
positioned in the industry within the next three years, we had
reach to the conclusion that there is more room to keep
growing, so we had a meeting where we used the brainstorming
method to come up with fresh ideas. One of the most important
question that came up in the meeting to increase the revenues
was, how can we do to increase the average check of the
customers? This question took us to set a new short-term goal,
increase the average check. There are some different ways to do
it, but the most applicable, reachable, easier and with a win-win
way for our servers’ staff to be motivated and reach the goal
was increase the knowledge about the different types of wines.
After agreeing to aim for the goal through this way, we needed
to train our staff, which will not be easy because they will have
to come to the trainings before the shift being motivated and
willing to learn. We convinced them that this training not only
will enrich their career in the hospitality industry, but also, it
will serve them in life, because knowing about wine is a tool
which you can use it for example when you go out to have a
dinner and discuss business with a probably investor, partner,
etc.
The process we established was, first, we hired a sommelier
(man who knows everything about wine) whose was going to be
in charge of doing the training. Then, he will do a test before
the training for our servers with the purpose to know how is
their current knowledge about wines (red wine, white wine,
champagne, sake) where he divided in different categories to
attend to different classes based in the knowledge they had.
Subsequently, the training was presented in three categories
once a week for the next eight weeks. Once the training is over,
they will be conducting another assessment to categorize them
into different levels of knowledge, where the best will serve the
best tables in the restaurants (this means having the best
clientele and consequently more money for the worker). This is
because the best middlemen are more able to sell more wine, to
create a better customer relationship because they are more
knowledgeable about wine. For example, which region the wine
is from, which menu item will best match, what its taste, history
and other related thing.
This could sound meaningless but the clients after having this
experience where he is able to see how informed are the
workers at the restaurant, how good are the recommendations
they received, they will talk to their friends and will recommend
to come to visit the place and will be more likely to spend more
money.
QUESTIONNAIRE
1. What is carked wine?
2. Why does wine get its tannins from?
3. Why should you swirl a wine before smelling it?
4. How do red grapes make white wines?
5. In which French wine region, you can find a grape
Chardonnay?
6. Why are the traditional 5 Bordeaux Grapes?
7. Chablis is made from which grape?
8. What are the 3 grapes that go into making Champagne?
9. The process of making Champagne is called?
10. What is a Blanc de Blanc Champagne?
11. What is a Blanc the Noir Champagne?
12. Name New Zealand 3 main grapes varieties
13. What’s the difference between Pouilly Fume and Pouilly
Fuisse?
14. Which Valley in France is Sancerre located?
15. Name 1 major wine producing region in Argentina.
Research Project
The purpose of this final research project is to give you the
opportunity to formulate research questions, run the analyses,
and interpret the results of the statistics covered in this class.
The final research paper is due by midnight on the due date,
Sunday, October 27, 2019, as a single Microsoft Word
document placed in the last week. The document must be in
APA format.
Please read through the instructions.
The final research project consists of three sections
I. The research scenario—to provide the context for the data.
Please note that the data are “content-neutral,” i.e., they do not
refer to a specific discipline or field.
II. The codebook—this identifies the variables (names, labels,
and measurement scale) in the database.
III. The final research paper instructions—for completing the
research paper. Be sure to read each question carefully and
answer each question completely.
I. Research Scenario:
An organization wants to know if participants with varying
levels of expertise (professionals, paraprofessionals, and
nonprofessionals) improve their knowledge after completing a
training program.
The organization collected demographic information: gender,
age, type of training (professional, paraprofessional, or
nonprofessional), location of the worksite (on-site or off-site)
and years of experience.
A pre-training test of knowledge, a training program, and post-
training test of knowledge was developed. Participants were
tested, then participated in the three-week training program, and
then were tested again.
The dataset also includes (1) a measure of participant
confidence in knowledge and (2) a certification exam score.
The data are discipline-neutral. Therefore, part of your final
project is to create a context for the research that is associated
with your discipline or area of interest (e.g., training to assess
mental health status; training to work with special education
children; training to become a technician or consultant).
II. Codebook
Variable Information
Variable
Label
Measurement Scale
Category Name
ID
N/A
N/A
N/A
Gender
Gender
Nominal
1 = Male
2 = Female
age
Age in Years
Ratio
qualification
Professional Qualification
Nominal
1 = Professional
2 = Paraprofessional
3 = Nonprofessional
worksite
Location of Work
Nominal
1 = On-Site
2 = Off-Site
knowledge1
Level of knowledge before Training
Interval
N/A
knowledge2
Level of knowledge after Training
Interval
N/A
years
Years of Experience
Ratio
N/A
confidence
Confidence in knowledge
Interval
N/A
exam
Certification in knowledge
Interval
N/A
III. Final Research Paper Instructions
Overview
Your task is to review the dataset, formulate a context, and then
use your knowledge of statistics to answer the research
questions and test hypotheses that will help the organization
evaluate the effectiveness of the program.
Part I. Create your context.
Using the research scenario and variables identified in the
codebook, create a “story” that describes the purpose and focus
of the study. In a few paragraphs describe the intent of your
investigation in the form of a problem background and purpose
statement.
Part II. Describe your sample.
Generate frequency tables and bar charts for the nominal
variables. Generate and interpret descriptive statistics of central
tendency, variability, skewness, and kurtosis for the continuous
(scale) variables. Generate frequency tables and histograms
with the normal curve superimposed for each scale variable.
Label your tables and graphs according to APA format.
Conclude with a paragraph summarizing the demographic
characteristics of this sample.
1. Gender (nominal)
2. Age (scale)
3. Qualification (nominal)
4. Worksite (nominal)
5. Knowledge1 (scale)
6. Knowledge2 (scale)
7. Years (scale)
8. Confidence (scale)
9. Exam (scale)
Part III. Describe relationships among the variables.
Select the variables that are measured on interval or ratio
scales. Create a correlation matrix. Label the table according to
APA format. Identify and discuss the strongest and weakest
correlations.
Part V. Summarize your findings.
Synthesize the results of your five analyses. Include a brief
summary of the sample characteristics and the major findings.
Interpret the findings so that the organization’s leaders will
have an understanding of the similarities and differences in
knowledge, and how effective the training program is in
improving knowledge.
All written assignments and responses should follow APA rules
for attributing sources.
Rev. 10 July 2019
14

More Related Content

Similar to Sheet1VARIABLE INFORMATION - POPULATION - 50 WAITERSGENDERMale27Fe.docx

Reading 1 need assessment
Reading 1 need assessmentReading 1 need assessment
Reading 1 need assessment
Alex Tsang
 

Similar to Sheet1VARIABLE INFORMATION - POPULATION - 50 WAITERSGENDERMale27Fe.docx (20)

Applied Research Design A Practical Approach
Applied Research Design  A Practical ApproachApplied Research Design  A Practical Approach
Applied Research Design A Practical Approach
 
MBA
MBAMBA
MBA
 
Research process
Research processResearch process
Research process
 
Research Methodology
Research MethodologyResearch Methodology
Research Methodology
 
Dr. Balamurugan_Research Process_Bala.pdf
Dr. Balamurugan_Research Process_Bala.pdfDr. Balamurugan_Research Process_Bala.pdf
Dr. Balamurugan_Research Process_Bala.pdf
 
Exploratory Essay Example
Exploratory Essay ExampleExploratory Essay Example
Exploratory Essay Example
 
EBP-2.ppt
EBP-2.pptEBP-2.ppt
EBP-2.ppt
 
Unit 3 Qualitative Data
Unit 3 Qualitative DataUnit 3 Qualitative Data
Unit 3 Qualitative Data
 
formulating a research problem
formulating a research problemformulating a research problem
formulating a research problem
 
Unveiling the Journey: Data Collection, Processing, and Analysis in Geography
Unveiling the Journey: Data Collection, Processing, and Analysis in GeographyUnveiling the Journey: Data Collection, Processing, and Analysis in Geography
Unveiling the Journey: Data Collection, Processing, and Analysis in Geography
 
23146_Chapter_2.pdf
23146_Chapter_2.pdf23146_Chapter_2.pdf
23146_Chapter_2.pdf
 
Reading 1 need assessment
Reading 1 need assessmentReading 1 need assessment
Reading 1 need assessment
 
L4 Basic steps of doing research.pdf
L4 Basic steps of doing research.pdfL4 Basic steps of doing research.pdf
L4 Basic steps of doing research.pdf
 
IntroductiontoResearch.pdf
IntroductiontoResearch.pdfIntroductiontoResearch.pdf
IntroductiontoResearch.pdf
 
Research methodology
Research methodologyResearch methodology
Research methodology
 
1 complete research
1 complete research1 complete research
1 complete research
 
Brm
BrmBrm
Brm
 
Brm
BrmBrm
Brm
 
Workshop on graduation attachment_085511.pptx
Workshop on graduation attachment_085511.pptxWorkshop on graduation attachment_085511.pptx
Workshop on graduation attachment_085511.pptx
 
Ch. 2. The Research Process.pptx
Ch. 2. The Research Process.pptxCh. 2. The Research Process.pptx
Ch. 2. The Research Process.pptx
 

More from bjohn46

Sheet1Rate your skills using the following scaleChapter 1 You Ma.docx
Sheet1Rate your skills using the following scaleChapter 1 You Ma.docxSheet1Rate your skills using the following scaleChapter 1 You Ma.docx
Sheet1Rate your skills using the following scaleChapter 1 You Ma.docx
bjohn46
 
Sheet1Quarter Sales PersonRegionQuarterly Sales31-MarSmithEast$750.docx
Sheet1Quarter Sales PersonRegionQuarterly Sales31-MarSmithEast$750.docxSheet1Quarter Sales PersonRegionQuarterly Sales31-MarSmithEast$750.docx
Sheet1Quarter Sales PersonRegionQuarterly Sales31-MarSmithEast$750.docx
bjohn46
 
Sheet1project codeproject nameEmployeesQB280001Account Management .docx
Sheet1project codeproject nameEmployeesQB280001Account Management .docxSheet1project codeproject nameEmployeesQB280001Account Management .docx
Sheet1project codeproject nameEmployeesQB280001Account Management .docx
bjohn46
 
Sheet1Quantity (miles of pipeline)Total CostTotal Fixed CostTotal .docx
Sheet1Quantity (miles of pipeline)Total CostTotal Fixed CostTotal .docxSheet1Quantity (miles of pipeline)Total CostTotal Fixed CostTotal .docx
Sheet1Quantity (miles of pipeline)Total CostTotal Fixed CostTotal .docx
bjohn46
 
Sheet1Pro Forma Income StatementYear 1Year 2Year 3Year 4Year 5Visi.docx
Sheet1Pro Forma Income StatementYear 1Year 2Year 3Year 4Year 5Visi.docxSheet1Pro Forma Income StatementYear 1Year 2Year 3Year 4Year 5Visi.docx
Sheet1Pro Forma Income StatementYear 1Year 2Year 3Year 4Year 5Visi.docx
bjohn46
 
Sheet1PMGT 576 Assignment Rubric – Unit 8 Assignment20Is the Lean .docx
Sheet1PMGT 576 Assignment Rubric – Unit 8 Assignment20Is the Lean .docxSheet1PMGT 576 Assignment Rubric – Unit 8 Assignment20Is the Lean .docx
Sheet1PMGT 576 Assignment Rubric – Unit 8 Assignment20Is the Lean .docx
bjohn46
 
Sheet1Presentation by Tony StudentSlide NumberSlide TitleSlide Tex.docx
Sheet1Presentation by Tony StudentSlide NumberSlide TitleSlide Tex.docxSheet1Presentation by Tony StudentSlide NumberSlide TitleSlide Tex.docx
Sheet1Presentation by Tony StudentSlide NumberSlide TitleSlide Tex.docx
bjohn46
 
Sheet1Pretax IncomeYang, Ziyun make sure to add back income t.docx
Sheet1Pretax IncomeYang, Ziyun make sure to add back income t.docxSheet1Pretax IncomeYang, Ziyun make sure to add back income t.docx
Sheet1Pretax IncomeYang, Ziyun make sure to add back income t.docx
bjohn46
 
Sheet1PMGT 576 Assignment Rubric – Unit 7 Assignment20Are all of t.docx
Sheet1PMGT 576 Assignment Rubric – Unit 7 Assignment20Are all of t.docxSheet1PMGT 576 Assignment Rubric – Unit 7 Assignment20Are all of t.docx
Sheet1PMGT 576 Assignment Rubric – Unit 7 Assignment20Are all of t.docx
bjohn46
 
Sheet1Phase of Business Financal Management needsDebt FinancingEq.docx
Sheet1Phase of Business Financal Management needsDebt FinancingEq.docxSheet1Phase of Business Financal Management needsDebt FinancingEq.docx
Sheet1Phase of Business Financal Management needsDebt FinancingEq.docx
bjohn46
 
Sheet1PeriodEngine Failures(a) 4-period moving average(b) weighted.docx
Sheet1PeriodEngine Failures(a) 4-period moving average(b) weighted.docxSheet1PeriodEngine Failures(a) 4-period moving average(b) weighted.docx
Sheet1PeriodEngine Failures(a) 4-period moving average(b) weighted.docx
bjohn46
 
Sheet1Participant#Verbal Label Condition (Smashed or Hit)Age Condi.docx
Sheet1Participant#Verbal Label Condition (Smashed or Hit)Age Condi.docxSheet1Participant#Verbal Label Condition (Smashed or Hit)Age Condi.docx
Sheet1Participant#Verbal Label Condition (Smashed or Hit)Age Condi.docx
bjohn46
 
Sheet1No.Strengths (3)Weaknesses (2)Recommendations (2)Evidence (u.docx
Sheet1No.Strengths (3)Weaknesses (2)Recommendations (2)Evidence (u.docxSheet1No.Strengths (3)Weaknesses (2)Recommendations (2)Evidence (u.docx
Sheet1No.Strengths (3)Weaknesses (2)Recommendations (2)Evidence (u.docx
bjohn46
 
Sheet1Moisture content analysis final resultsGroupValue of m3 (g)A.docx
Sheet1Moisture content analysis final resultsGroupValue of m3 (g)A.docxSheet1Moisture content analysis final resultsGroupValue of m3 (g)A.docx
Sheet1Moisture content analysis final resultsGroupValue of m3 (g)A.docx
bjohn46
 
Sheet1ManhattanBrooklynQueensThe BronxStaten IslandEducationMarita.docx
Sheet1ManhattanBrooklynQueensThe BronxStaten IslandEducationMarita.docxSheet1ManhattanBrooklynQueensThe BronxStaten IslandEducationMarita.docx
Sheet1ManhattanBrooklynQueensThe BronxStaten IslandEducationMarita.docx
bjohn46
 
Sheet1Learning Solultions NameVersion NumberMediumTypeLessonSc.docx
Sheet1Learning Solultions NameVersion NumberMediumTypeLessonSc.docxSheet1Learning Solultions NameVersion NumberMediumTypeLessonSc.docx
Sheet1Learning Solultions NameVersion NumberMediumTypeLessonSc.docx
bjohn46
 
Sheet1LMH10090H80M70L605040302010NumberRisk NameFull Risk CostRisk.docx
Sheet1LMH10090H80M70L605040302010NumberRisk NameFull Risk CostRisk.docxSheet1LMH10090H80M70L605040302010NumberRisk NameFull Risk CostRisk.docx
Sheet1LMH10090H80M70L605040302010NumberRisk NameFull Risk CostRisk.docx
bjohn46
 
Sheet1Item Price# of ItemsTotal PriceCups$1.896$11.34Plates$1.506$.docx
Sheet1Item Price# of ItemsTotal PriceCups$1.896$11.34Plates$1.506$.docxSheet1Item Price# of ItemsTotal PriceCups$1.896$11.34Plates$1.506$.docx
Sheet1Item Price# of ItemsTotal PriceCups$1.896$11.34Plates$1.506$.docx
bjohn46
 
Sheet1In_OutAustralian_CityInternational_CityAirlineRoutePort_Coun.docx
Sheet1In_OutAustralian_CityInternational_CityAirlineRoutePort_Coun.docxSheet1In_OutAustralian_CityInternational_CityAirlineRoutePort_Coun.docx
Sheet1In_OutAustralian_CityInternational_CityAirlineRoutePort_Coun.docx
bjohn46
 

More from bjohn46 (20)

Sheet1Rate your skills using the following scaleChapter 1 You Ma.docx
Sheet1Rate your skills using the following scaleChapter 1 You Ma.docxSheet1Rate your skills using the following scaleChapter 1 You Ma.docx
Sheet1Rate your skills using the following scaleChapter 1 You Ma.docx
 
Sheet1Quarter Sales PersonRegionQuarterly Sales31-MarSmithEast$750.docx
Sheet1Quarter Sales PersonRegionQuarterly Sales31-MarSmithEast$750.docxSheet1Quarter Sales PersonRegionQuarterly Sales31-MarSmithEast$750.docx
Sheet1Quarter Sales PersonRegionQuarterly Sales31-MarSmithEast$750.docx
 
Sheet1project codeproject nameEmployeesQB280001Account Management .docx
Sheet1project codeproject nameEmployeesQB280001Account Management .docxSheet1project codeproject nameEmployeesQB280001Account Management .docx
Sheet1project codeproject nameEmployeesQB280001Account Management .docx
 
Sheet1Quantity (miles of pipeline)Total CostTotal Fixed CostTotal .docx
Sheet1Quantity (miles of pipeline)Total CostTotal Fixed CostTotal .docxSheet1Quantity (miles of pipeline)Total CostTotal Fixed CostTotal .docx
Sheet1Quantity (miles of pipeline)Total CostTotal Fixed CostTotal .docx
 
Sheet1Pro Forma Income StatementYear 1Year 2Year 3Year 4Year 5Visi.docx
Sheet1Pro Forma Income StatementYear 1Year 2Year 3Year 4Year 5Visi.docxSheet1Pro Forma Income StatementYear 1Year 2Year 3Year 4Year 5Visi.docx
Sheet1Pro Forma Income StatementYear 1Year 2Year 3Year 4Year 5Visi.docx
 
Sheet1PMGT 576 Assignment Rubric – Unit 8 Assignment20Is the Lean .docx
Sheet1PMGT 576 Assignment Rubric – Unit 8 Assignment20Is the Lean .docxSheet1PMGT 576 Assignment Rubric – Unit 8 Assignment20Is the Lean .docx
Sheet1PMGT 576 Assignment Rubric – Unit 8 Assignment20Is the Lean .docx
 
Sheet1Presentation by Tony StudentSlide NumberSlide TitleSlide Tex.docx
Sheet1Presentation by Tony StudentSlide NumberSlide TitleSlide Tex.docxSheet1Presentation by Tony StudentSlide NumberSlide TitleSlide Tex.docx
Sheet1Presentation by Tony StudentSlide NumberSlide TitleSlide Tex.docx
 
Sheet1Pretax IncomeYang, Ziyun make sure to add back income t.docx
Sheet1Pretax IncomeYang, Ziyun make sure to add back income t.docxSheet1Pretax IncomeYang, Ziyun make sure to add back income t.docx
Sheet1Pretax IncomeYang, Ziyun make sure to add back income t.docx
 
Sheet1PMGT 576 Assignment Rubric – Unit 7 Assignment20Are all of t.docx
Sheet1PMGT 576 Assignment Rubric – Unit 7 Assignment20Are all of t.docxSheet1PMGT 576 Assignment Rubric – Unit 7 Assignment20Are all of t.docx
Sheet1PMGT 576 Assignment Rubric – Unit 7 Assignment20Are all of t.docx
 
Sheet1Plan APlan BPro Forma Income Statement AccountsEBIT700100013.docx
Sheet1Plan APlan BPro Forma Income Statement AccountsEBIT700100013.docxSheet1Plan APlan BPro Forma Income Statement AccountsEBIT700100013.docx
Sheet1Plan APlan BPro Forma Income Statement AccountsEBIT700100013.docx
 
Sheet1Phase of Business Financal Management needsDebt FinancingEq.docx
Sheet1Phase of Business Financal Management needsDebt FinancingEq.docxSheet1Phase of Business Financal Management needsDebt FinancingEq.docx
Sheet1Phase of Business Financal Management needsDebt FinancingEq.docx
 
Sheet1PeriodEngine Failures(a) 4-period moving average(b) weighted.docx
Sheet1PeriodEngine Failures(a) 4-period moving average(b) weighted.docxSheet1PeriodEngine Failures(a) 4-period moving average(b) weighted.docx
Sheet1PeriodEngine Failures(a) 4-period moving average(b) weighted.docx
 
Sheet1Participant#Verbal Label Condition (Smashed or Hit)Age Condi.docx
Sheet1Participant#Verbal Label Condition (Smashed or Hit)Age Condi.docxSheet1Participant#Verbal Label Condition (Smashed or Hit)Age Condi.docx
Sheet1Participant#Verbal Label Condition (Smashed or Hit)Age Condi.docx
 
Sheet1No.Strengths (3)Weaknesses (2)Recommendations (2)Evidence (u.docx
Sheet1No.Strengths (3)Weaknesses (2)Recommendations (2)Evidence (u.docxSheet1No.Strengths (3)Weaknesses (2)Recommendations (2)Evidence (u.docx
Sheet1No.Strengths (3)Weaknesses (2)Recommendations (2)Evidence (u.docx
 
Sheet1Moisture content analysis final resultsGroupValue of m3 (g)A.docx
Sheet1Moisture content analysis final resultsGroupValue of m3 (g)A.docxSheet1Moisture content analysis final resultsGroupValue of m3 (g)A.docx
Sheet1Moisture content analysis final resultsGroupValue of m3 (g)A.docx
 
Sheet1ManhattanBrooklynQueensThe BronxStaten IslandEducationMarita.docx
Sheet1ManhattanBrooklynQueensThe BronxStaten IslandEducationMarita.docxSheet1ManhattanBrooklynQueensThe BronxStaten IslandEducationMarita.docx
Sheet1ManhattanBrooklynQueensThe BronxStaten IslandEducationMarita.docx
 
Sheet1Learning Solultions NameVersion NumberMediumTypeLessonSc.docx
Sheet1Learning Solultions NameVersion NumberMediumTypeLessonSc.docxSheet1Learning Solultions NameVersion NumberMediumTypeLessonSc.docx
Sheet1Learning Solultions NameVersion NumberMediumTypeLessonSc.docx
 
Sheet1LMH10090H80M70L605040302010NumberRisk NameFull Risk CostRisk.docx
Sheet1LMH10090H80M70L605040302010NumberRisk NameFull Risk CostRisk.docxSheet1LMH10090H80M70L605040302010NumberRisk NameFull Risk CostRisk.docx
Sheet1LMH10090H80M70L605040302010NumberRisk NameFull Risk CostRisk.docx
 
Sheet1Item Price# of ItemsTotal PriceCups$1.896$11.34Plates$1.506$.docx
Sheet1Item Price# of ItemsTotal PriceCups$1.896$11.34Plates$1.506$.docxSheet1Item Price# of ItemsTotal PriceCups$1.896$11.34Plates$1.506$.docx
Sheet1Item Price# of ItemsTotal PriceCups$1.896$11.34Plates$1.506$.docx
 
Sheet1In_OutAustralian_CityInternational_CityAirlineRoutePort_Coun.docx
Sheet1In_OutAustralian_CityInternational_CityAirlineRoutePort_Coun.docxSheet1In_OutAustralian_CityInternational_CityAirlineRoutePort_Coun.docx
Sheet1In_OutAustralian_CityInternational_CityAirlineRoutePort_Coun.docx
 

Recently uploaded

Jual Obat Aborsi Hongkong ( Asli No.1 ) 085657271886 Obat Penggugur Kandungan...
Jual Obat Aborsi Hongkong ( Asli No.1 ) 085657271886 Obat Penggugur Kandungan...Jual Obat Aborsi Hongkong ( Asli No.1 ) 085657271886 Obat Penggugur Kandungan...
Jual Obat Aborsi Hongkong ( Asli No.1 ) 085657271886 Obat Penggugur Kandungan...
ZurliaSoop
 
Salient Features of India constitution especially power and functions
Salient Features of India constitution especially power and functionsSalient Features of India constitution especially power and functions
Salient Features of India constitution especially power and functions
KarakKing
 

Recently uploaded (20)

Basic Civil Engineering first year Notes- Chapter 4 Building.pptx
Basic Civil Engineering first year Notes- Chapter 4 Building.pptxBasic Civil Engineering first year Notes- Chapter 4 Building.pptx
Basic Civil Engineering first year Notes- Chapter 4 Building.pptx
 
Application orientated numerical on hev.ppt
Application orientated numerical on hev.pptApplication orientated numerical on hev.ppt
Application orientated numerical on hev.ppt
 
HMCS Max Bernays Pre-Deployment Brief (May 2024).pptx
HMCS Max Bernays Pre-Deployment Brief (May 2024).pptxHMCS Max Bernays Pre-Deployment Brief (May 2024).pptx
HMCS Max Bernays Pre-Deployment Brief (May 2024).pptx
 
HMCS Vancouver Pre-Deployment Brief - May 2024 (Web Version).pptx
HMCS Vancouver Pre-Deployment Brief - May 2024 (Web Version).pptxHMCS Vancouver Pre-Deployment Brief - May 2024 (Web Version).pptx
HMCS Vancouver Pre-Deployment Brief - May 2024 (Web Version).pptx
 
UGC NET Paper 1 Mathematical Reasoning & Aptitude.pdf
UGC NET Paper 1 Mathematical Reasoning & Aptitude.pdfUGC NET Paper 1 Mathematical Reasoning & Aptitude.pdf
UGC NET Paper 1 Mathematical Reasoning & Aptitude.pdf
 
Food safety_Challenges food safety laboratories_.pdf
Food safety_Challenges food safety laboratories_.pdfFood safety_Challenges food safety laboratories_.pdf
Food safety_Challenges food safety laboratories_.pdf
 
Python Notes for mca i year students osmania university.docx
Python Notes for mca i year students osmania university.docxPython Notes for mca i year students osmania university.docx
Python Notes for mca i year students osmania university.docx
 
Jual Obat Aborsi Hongkong ( Asli No.1 ) 085657271886 Obat Penggugur Kandungan...
Jual Obat Aborsi Hongkong ( Asli No.1 ) 085657271886 Obat Penggugur Kandungan...Jual Obat Aborsi Hongkong ( Asli No.1 ) 085657271886 Obat Penggugur Kandungan...
Jual Obat Aborsi Hongkong ( Asli No.1 ) 085657271886 Obat Penggugur Kandungan...
 
Single or Multiple melodic lines structure
Single or Multiple melodic lines structureSingle or Multiple melodic lines structure
Single or Multiple melodic lines structure
 
Unit 3 Emotional Intelligence and Spiritual Intelligence.pdf
Unit 3 Emotional Intelligence and Spiritual Intelligence.pdfUnit 3 Emotional Intelligence and Spiritual Intelligence.pdf
Unit 3 Emotional Intelligence and Spiritual Intelligence.pdf
 
On_Translating_a_Tamil_Poem_by_A_K_Ramanujan.pptx
On_Translating_a_Tamil_Poem_by_A_K_Ramanujan.pptxOn_Translating_a_Tamil_Poem_by_A_K_Ramanujan.pptx
On_Translating_a_Tamil_Poem_by_A_K_Ramanujan.pptx
 
Salient Features of India constitution especially power and functions
Salient Features of India constitution especially power and functionsSalient Features of India constitution especially power and functions
Salient Features of India constitution especially power and functions
 
Interdisciplinary_Insights_Data_Collection_Methods.pptx
Interdisciplinary_Insights_Data_Collection_Methods.pptxInterdisciplinary_Insights_Data_Collection_Methods.pptx
Interdisciplinary_Insights_Data_Collection_Methods.pptx
 
Wellbeing inclusion and digital dystopias.pptx
Wellbeing inclusion and digital dystopias.pptxWellbeing inclusion and digital dystopias.pptx
Wellbeing inclusion and digital dystopias.pptx
 
General Principles of Intellectual Property: Concepts of Intellectual Proper...
General Principles of Intellectual Property: Concepts of Intellectual  Proper...General Principles of Intellectual Property: Concepts of Intellectual  Proper...
General Principles of Intellectual Property: Concepts of Intellectual Proper...
 
Graduate Outcomes Presentation Slides - English
Graduate Outcomes Presentation Slides - EnglishGraduate Outcomes Presentation Slides - English
Graduate Outcomes Presentation Slides - English
 
How to Add New Custom Addons Path in Odoo 17
How to Add New Custom Addons Path in Odoo 17How to Add New Custom Addons Path in Odoo 17
How to Add New Custom Addons Path in Odoo 17
 
Plant propagation: Sexual and Asexual propapagation.pptx
Plant propagation: Sexual and Asexual propapagation.pptxPlant propagation: Sexual and Asexual propapagation.pptx
Plant propagation: Sexual and Asexual propapagation.pptx
 
TỔNG ÔN TẬP THI VÀO LỚP 10 MÔN TIẾNG ANH NĂM HỌC 2023 - 2024 CÓ ĐÁP ÁN (NGỮ Â...
TỔNG ÔN TẬP THI VÀO LỚP 10 MÔN TIẾNG ANH NĂM HỌC 2023 - 2024 CÓ ĐÁP ÁN (NGỮ Â...TỔNG ÔN TẬP THI VÀO LỚP 10 MÔN TIẾNG ANH NĂM HỌC 2023 - 2024 CÓ ĐÁP ÁN (NGỮ Â...
TỔNG ÔN TẬP THI VÀO LỚP 10 MÔN TIẾNG ANH NĂM HỌC 2023 - 2024 CÓ ĐÁP ÁN (NGỮ Â...
 
Beyond_Borders_Understanding_Anime_and_Manga_Fandom_A_Comprehensive_Audience_...
Beyond_Borders_Understanding_Anime_and_Manga_Fandom_A_Comprehensive_Audience_...Beyond_Borders_Understanding_Anime_and_Manga_Fandom_A_Comprehensive_Audience_...
Beyond_Borders_Understanding_Anime_and_Manga_Fandom_A_Comprehensive_Audience_...
 

Sheet1VARIABLE INFORMATION - POPULATION - 50 WAITERSGENDERMale27Fe.docx

  • 1. Sheet1VARIABLE INFORMATION - POPULATION - 50 WAITERSGENDERMale27Female2350AGE20-301330-402640 more 1150QUALIFICATION1 - Professional152 - Paraprofessional233 - Nonprofessional1250WORSITEOn- Site50Off-site050KNOWLEDGE BEFORE TRAININGwe will use some questions of the questionnaire that is in our research scenario. I dont know how you can use it. Level 1 - weak22Level 2 - medium19Level 3 - advanced950KNOWLEDGE AFTER TRAININGWE MUST DECIDE based on the quantitative analysis Level 1 - weak0Level 2 - medium0Level 3 - advanced0YEARS OF EXPERIENCE1-3 Years93-5 Years215 plus Years2050LEVEL OF CONFIDENCEwe also can use the answers from our questionnaire. Based on their correct answers we can measure their confidence1 to 33 to 66 to 10EXAM - cetificate of knowledgeReceived 38Non received 1250 Sheet1VARIABLE INFORMATION - POPULATION - 50 WAITERSGENDERMale27Female2350AGE20-301330-402640 more 1150QUALIFICATION1 - Professional152 - Paraprofessional233 - Nonprofessional1250WORSITEOn- Site50Off-site050KNOWLEDGE BEFORE TRAININGwe will use some questions of the questionnaire that is in our research scenario. I dont know how you can use it. Level 1 - weak22Level 2 - medium19Level 3 - advanced950KNOWLEDGE AFTER TRAININGWE MUST DECIDE based on the quantitative analysis Level 1 - weak0Level 2 - medium0Level 3 - advanced0YEARS OF EXPERIENCE1-3 Years93-5 Years215 plus Years2050LEVEL OF CONFIDENCEwe also can use the answers from our questionnaire. Based on their correct answers we can measure their confidence1 to 33 to 66 to 10EXAM - cetificate of knowledgeReceived 38Non received 1250
  • 2. I. A Feedback Model of the Research Process II. Strategies for Statistical Thinking The purpose of this section is to provide students basic strategies to practice statistical thinking, in addition to fundamental applications. Teaching statistical thinking and improving performance involves learning how to resolve a number of ambiguities during the statistical inquiry process that are not found in typical homework problems and exams. Inquiry with ill- structured problems requires a number of skills that need to be developed during the course: a. “Generating a curiosity about the world that identifies “I wonder problems”; b. Writing a measurable question that provides insight into these problems; c. Determining relevant valid and accessible data; d. Planning and carrying out data collection; e. Checking, cleaning and organizing data; f. Recognizing the data's limitations; g. Analyzing and interpreting data; h. Articulating findings; i. Seeking explanations; and, j. Generating further questions (4)”.
  • 3. This iterative process often requires revision as new understandings develop and unanticipated problems or opportunities arise. The weekly discussion questions provide an opportunity to develop inquiry skills throughout the course. Inquiry is a well-accepted (but not always implemented) process in other subjects, such as science and social studies, but requires development of skills often absent in statistics courses, like the ones listed below: · “Ability to cope with ambiguity and uncertainty; · Re-balance between instructor guidance and student independence; · Recognition of opportunities for learning in unexpected outcomes; · Flexible and creative thinking; · Deep understanding of disciplinary content; and · Tolerance for periods of noise and disorganization (4)”. This overview discusses the thought processes involved in statistical problem solving in the broad sense from problem formulation to conclusions. It draws on the literature and on the article published by C. J. Wild and M. Pfannkuch, Statistical Thinking in Empirical Enquiry,aimed at uncovering the statistical reasoning processes. The content for this overview has been excerpted from this article and has been modified and adapted to help students develop a framework for statistical thinking throughout the course. The process from problem specification to outcome is complex and iterative. Not only is the process iterative, but at each stage one often looks back to the previous step and re-evaluates the
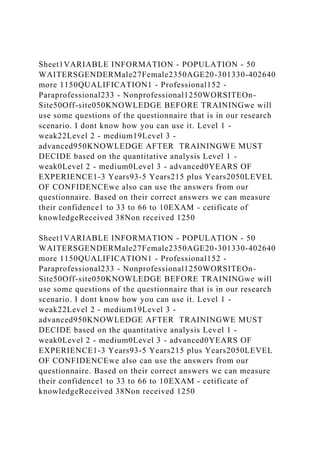
  • 4. validity of the decisions made. The process is described in terms of a sequence of steps labeled PPDAC: Problem; Plan; Data; Analysis; and Conclusions, that is useful for statistical thinking (1). The PPDAC approach is shown in the figure below. Figure I. PPDAC Model: Problem; Plan; Data; Analysis; and Conclusions (1) This diagram(1) shows that, although the clockwise sequence (1→5) applies as the principal flow, each stage may, and often will, feed back to the previous stage. In addition, it may well be beneficial to examine the process in the reverse direction, starting with Problem definition and then examining expectations as to the format and structure of the Conclusions. This procedure then continues, step-by-step, in a counterclockwise manner (e→a) determining the implications of these expectations for each stage of the process (The Pennsylvania State University, 2010). The PPDAC model develops information that is gathered by the analysis data, such as detecting and describing patterns, trends, and relations in data. As something relevant is detected in data, new questions arise, causing specific parts to be viewed in more detail. Applied statistics is part of the information gathering and learning process which is undertaken to inform decisions and actions. Multiple sectors of society increasingly rely on data for decision making, therefore, statistics has become an integral part of the emerging information era that is used to expand the body of knowledge in many fields. As shown in Figure III (3), learning is much more than collecting information, it involves synthesizing the new ideas and information with existing ideas and information into an improved understanding.
  • 5. Figure II. Triggers for stimulating descriptive, inferential, and contextual thoughts (Pfannkuch, M., 2010) Wild and Pfannkuch (1999) paper on statistical thinking describes a four dimensional framework for statistical thinking and inquiry, which is shown in Figure IV (2). It includes an investigative cycle, an interrogative cycle, types of thinking and dispositions. The authors characterize these processes through models that can be used as a basis for thinking tools for the enhancement of problem-solving. A brief description for each of these models is presented in the subsequent paragraphs. Figure IV.A 4-Dimensional Framework for Statistical Thinking (C. J. Wild and M. Pfannkuch, 1999) 1. Dimension One: The Investigative Cycle The first dimension is illustrated in Figure (a) Dimension 1(2). It concerns the way one acts and what one thinks about during the course of a statistical investigation. Certain learning goals must be met to arrive at the desired level of understanding. A PPDAC investigative cycle is set off to achieve each learning goal. Knowledge gained and needs identified within these cycles may initiate further investigative cycles. The conclusions from the investigations feed into an expanded context- knowledge base which can then inform any actions (C. J. Wild, 1999). (C. J. Wild and M. Pfannkuch, 1999) 2. Dimension Two: Types of Thinking A number of general and fundamental types of thinking are shown in Figure (b) Dimension 2(2). The four dimensional
  • 6. framework seeks to organize some of the elements of statistical thinking during data-based enquiry. The thinker operates in all four dimensions at once. For example the thinker could be categorized as currently being in the planning stage of the Investigative Cycle (Dimension I), dealing with some aspect of variation in Dimension 2 (Types of Thinking) by criticizing a tentative plan in Dimension 3 (Interrogative Cycle) driven by skepticism in Dimension 4 (Dispositions). Who is doing this thinking? Anyone involved in enquiry, either individually or as a member of a team. While this approach is not peculiar to statisticians, the quality of the thinking can be improved by gaining more statistical knowledge (C. J. Wild, 1999). 3. Dimension Three: The Interrogative Cycle The Interrogative Cycle illustrated in Figure (c) Dimension 3(2), is a generic thinking process in constant use in statistical problem solving. It appears that the thinker is always in one of the interrogative states while problem solving. The cycle applies at macro levels, but also at very detailed levels of thinking because the interrogative cycle is recursive. Sub-cycles are initiated within major cycles, e.g. the "checking" step of any cycle can initiate a full interrogative sub-cycle. The ordered depiction on a wheel is an idealization of what perhaps should happen. In reality steps are often missed. We discuss the Interrogative Cycle as we observed it, being applied to statistical enquiry and statistical critique. The "thinker" is anyone involved in these activities (C. J. Wild, 1999). (C. J. Wild and M. Pfannkuch, 1999) 4. Dimension Four: Dispositions Dispositions are the personal qualities that affect, or even initiate, entry into a thinking mode; they are summarized in Figure (d) Dimension 4 (2). While these elements are generic,
  • 7. they are discussed in the context of statistical problem solving. (C. J. Wild and M. Pfannkuch, 1999) · Curiosity and Awareness - Discoveries are triggered by someone noticing something and reacting to internal questions like "Why?', or "How did that happen?", or "Is this something that happens more generally?', or "How can I exploit this?" Being observant (aware) and curious are the well-springs of the question generation process that all innovative learning results from. Wild (1994) formed the slogan "Questions are more important than answers" to emphasize this point (C. J. Wild, 1999). · Engagement - It occurs when you become intensely interested in a problem or area; a heightened sensitivity and awareness develops towards information on the peripheries of the experience that might be related to the problem. People are most observant in those areas that they find most interesting. Engagement intensifies each of the "dispositional" elements curiosity, awareness, imagination and perseverance (C. J. Wild, 1999). How do we become engaged? Spontaneous interest is innate; background knowledge helps - it is hard to be interested in something one knows nothing about. Being paid to do a job helps, as does the problem being important to people we care about. This may be our main difficulty in getting statistics students to think. They simply do not find the problems they are asked to think about interesting enough to be really engaged by them. We observed the effects on performance of engagement with some tasks and not others in the statistics students (C. J. Wild, 1999). · Imagination - It is hard to overemphasize the importance of imagination to statistical thinking. The formation of mental
  • 8. models that grasp the essential dynamics of a problem is a deeply imaginative process, as is viewing a situation from different perspectives, and generating possible explanations or confounding explanations for phenomena and features of data (C. J. Wild, 1999). · Skepticism: By skepticism, we mean a tendency to be constantly on the lookout for logical and factual flaws when receiving new ideas and information. It is a quality statisticians both possess and value. Some writers refer to this as "adopting a critical attitude" (C. J. Wild, 1999). · Being logical - The ability to detect when one idea follows from another and when it does not and, to construct a logical argument is clearly important to all thinking. Synthesis of new information with existing knowledge is largely a matter of seeing implications. Logical reasoning is the only sure way to arrive at valid conclusions. To be useful, skepticism must be supported by ability to reason from assumptions or information to implications that can be checked against data (C. J. Wild, 1999). A propensity to seek deeper meaning means not simply taking things at face value and being prepared to dig a little deeper. Of the other "dispositions", openness helps us to register and consider new ideas and information that conflict with our own assumptions and perseverance is self-evident (C. J. Wild, 1999). Can "dispositions" be taught? - A person's "dispositions" are typically problem dependent - they change according to the degree to which the person is engaged by the problem. While some people are skeptical and others are credulous, it seems that credulousness in a particular area is a result of ignorance. That is, as you gain experience and see ways in which certain types of information can be unsoundly based and turn out to be false, you become more skeptical. What we want from
  • 9. skepticism is a prompting to raise certain types question concerning the reliability of information, which can be taught (C. J. Wild, 1999). INFERENTIAL 15 Research Questions Research Design Research Topic Purpose Literature Review Value of the Study Expected Results
  • 10. Research Process Feedback Loops 1. Turn your idea into a research question First stages Where do you start? o What is your aim? (In general terms) o What is your hypothesis? (In specific terms) o Is your idea novel? (See Section 2 on reviewing the literature) o Why does it matter? o How will NHS patients or service users benefit form your research? Consult o colleagues and other researchers Juan Typewritten Text
  • 11. Research Methods Lectures http://www.learningdomain.com/PhD/HOMEphd.html Juan Typewritten Text Student Researcher's Toolkit http://global.oup.com/uk/orc/sociology/brymansrm4e/01student/ toolkit/ Juan Typewritten Text Your Dissertation Proposal http://www.le.ac.uk/oerresources/internationalrelations/dissertat ionwriting/index.htm Juan Typewritten Text © 2012 Juan C. Hernandez, PhD. o These eight tutorials will teach you how to become an effective researcher develop your information literacy and critical thinking skills. Approaches 2. Review the Literature It is essential that existing sources of evidence, especially systematic reviews, are
  • 12. considered carefully prior to undertaking research. Research which duplicates other work unnecessarily or which is not of sufficient quality to contribute something useful to existing knowledge is in itself unethical. Conducting a literature review will expand your knowledge about the topic hone your information seeking skills, i.e., the ability to scan the literature efficiently to identify a set of useful articles and books. To be effective, a literature review must satisfy the following requirements: 1. be organized around and related directly to the research questions you are developing; 2. synthesize results into a summary of what is and is not known; 3. identify areas of controversy in the literature; 4. formulate questions that need further research. Where do I start? (available at most university libraries) or
  • 13. action incomplete information The purpose of writing a literature review is to convey the knowledge and ideas have been established on a topic, and their strengths and weaknesses. The literature review must be defined by a guiding concept, such as your research objective or the problem or issue you are discussing; it is not just a descriptive list of the material available, or a set of summaries http://www.southalabama.edu/coe/bset/johnson/dr_johnson/2lect ures.htm http://www.sagepub.com/bjohnsonstudy/index.htm Please see the following references for additional information. They provide excellent tips and questions you should ask yourself about conducting a literature review and each book or article you include.
  • 14. 3. Design the Study and Develop Methods Qualitative and Quantitative Research Methods Which research method is most appropriate to your research project? Do you know the difference between quantitative and qualitative research methods? n appropriate method of research Adapted from material by Keith Chantler, R&D Manager, Central Manchester and Manchester Children's University Hospitals (Page 11 - Table of comparison) Participant Involvement Consider the effect of your research on the participants. problems for those taking part? study works well in the real world. Engagement should: o Be as early as possible in the process o Could be in the form of a small focus group, users on your
  • 15. study design team or speaking to a relevant patient support or other group. Writing Qualitative and Quantitative Research Questions The following sites offer useful steps for writing good qualitative and quantitative research questions: Survey Design Do you know what is the most appropriate survey method for your research project? What method will give you the most useful data for the project you are working on? The Research Methods Knowledge Base has many useful http://www.writing.utoronto.ca/advice/specific-types-of- writing/literature-review http://www.writing.utoronto.ca/advice/specific-types-of- writing/literature-review http://www.writing.utoronto.ca/advice/specific-types-of- writing/literature-review http://library.ucsc.edu/help/howto/write-a-literature-review http://www.writing.utoronto.ca/advice/specific-types-of- writing/literature-review http://writingcenter.unc.edu/resources/handouts-demos http://www.southalabama.edu/coe/bset/johnson/dr_johnson/2lect
  • 16. ures.htm http://www.rdinfo.org.uk/flowchart/Characteristics.htm http://masscommtheory.com/2011/05/05/writing-good- qualitative-research-questions/ http://www.southalabama.edu/coe/bset/johnson/oh_master/Ch3/ Tab03-07.pdf http://www.socialresearchmethods.net/kb/index.php sections on social research methods including: Survey Research Sampling What method of sampling will give you the most useful data for the project you are working on? Guide - probability sampling methods Statistical Issues Are you familiar with the statistics you may need to use? If not, consider enrolling on a suitable course. Other tools and guidance: g Terms
  • 17. Andrews University Questionnaire Design Do you know how to design a questionnaire for survey research? s Sampling 4. Writing your research proposal Starting your research proposal development process (see section 3) and ideally have several involved throughout the development process proposal. that are scientifically sound and ethical.
  • 18. two proposals are the same, but they will all have a similar structure: (Adapted from material by Keith Chantler, R&D Manager, Central Manchester and Manchester Children's Hospitals) o title http://www.socialresearchmethods.net/kb/survey.php http://www.nao.org.uk/publications/samplingguide.pdf http://www.socialresearchmethods.net/kb/sampprob.php http://www.socialresearchmethods.net/kb/sampnon.php http://www.statsoft.com/textbook/ http://www.socialresearchmethods.net/kb/sampstat.php http://psy.st-andrews.ac.uk/resources/glossary.shtml http://iss.leeds.ac.uk/info/312/surveys/217/guide_to_the_design _of_questionnaires http://home.ubalt.edu/ntsbarsh/stat-data/surveys.htm o abstract/summary o background or rationale of the project o aims/objectives o experimental design and methods o ethical considerations o benefits of the study o resources and costs Key elements in a research proposal (from Hull & East Yorkshire Hospitals NHS Trust R&D Resource pack) Use the following to check if you have included everything you
  • 19. need in your research proposal: o What is your research question? o Why does it matter? o How will you address this question? (i.e. what will be your methodology?) o What is the significance of this research study? o Is your research question clear? o Are your research methods appropriate? o How many subjects do you need? How will you choose them? o What statistic will you use? See the following useful web sites. When writing a proposal it is important to consider who will be reviewing it, such as members of dissertation committees. The following offers advice on writing clearly & effectively. 1. Understand your task Lack of understanding is a common cause of confused writing, (eg. rambling sentences, jumbled paragraphs, vagueness). Unless you understand clearly what you
  • 20. have to do, you can't hope to write plainly about it. Before you begin, ask yourself: o What has to be done? Why? o For whom? In what form? o Ways to clarify understanding include: asking, conferring, consulting brainstorming, doodling, 'free writing', outlining, note taking using a 'critical friend' making diagrams, drawings, flowcharts, lists, summaries reading instructions and checking requirements. The earlier efforts to clarify understandings are made the more likely they are to be effective. In the early stages of writing, you are more likely to be receptive to comments and ideas of others and be able to make changes easily. At first, http://www.rdinfo.org.uk/flowchart/Design%20of%20the%20res earch%20proposal.doc http://www.rddirect.org.uk/queries/Website.asp#4 concentrate on putting down ideas and information without assigning value to them. If you are unsure about how or where to begin, just start writing, i.e., 'free write'. As you
  • 21. do, your understanding should become clearer and you can start grouping like points. (Try to keep all your preliminary notes and jottings. Refer back to them as your writing develops to ensure nothing important has been overlooked). 2. Write for your reader(s) o Who is the reader? (eg. influence, position, etc.) o How informed is the reader? o What background information will the reader need? (e.g., circumstances, o conditions, history, local context.) o How does the reader want to use what you write? o What writing style is appropriate? (If background information interrupts o the flow of your writing, include it in footnotes and/or appendices.) 3. Put first things first Give the most prominence and space to what is most important. When writing a report, put the most important information first. Put the most important information first when writing a report. 4. Arrange your points logically Logical organization is the basis of clarity. Ways to do this include: advantages and disadvantages; ascending/descending order; causes/effects; chronology;
  • 22. general and specific; priority; proximity; significance. (Where items are of equal importance and/or there is no preferred order, arrange alphabetically.) 5. Write direct sentences Ways to do this include: o Using strong verbs rather than overused adjectives. Many commonly used adjectives have lost their impact. Words like magnificent, wonderful, and interesting mean very little. Reserve your adjectival sledge hammers for when they actually mean something. o Using the active rather than passive voice. The active voice indicates the subject is doing the action of the verb. The move is from subject to verb to object (where there is an object). e.g.,: The director will return incomplete forms. The passive voice indicates the action is taking place but not necessarily who or what is committing the action. e.g.,: Incomplete forms will be returned by the director Active voice sentences are more direct and forceful than passive voice ones. o Keeping sentences correct and simple. Keep sentences short. Use two sentences rather than join with 'and'. Have only one idea or
  • 23. point per sentence. Make sure subject agrees with verb. Be unfailingly consistent with person and tense. o Being specific. If numbers continue to increase at the present rate, more staff will be needed in the future. Two further staff will be required from 1st January if increased enrolments continue, i.e., from 85 in August to 120 in October. 6. Distinguish fact from opinion An acceptable discharge rate is being maintained, with 61% of patients returning home within two days. 61% of patients return home within two days. Medical staff consider this acceptable. Use conventions as guidelines rather than rules Use writing conventions to support and strengthen your writing. 'Do's' don't mean always and 'Don'ts' don't mean never. Your first responsibility is to write to achieve your goals, i.e., accurate, immediate, effective communication. Review, revise and re-write Writing is an art; Editing is a craft - both take time. Check progressively for accuracy and appropriateness, particularly of facts, spelling and sentence construction. Seek the advice and opinion of others. Remove all unnecessary
  • 24. words and information from finished copy. 5. Certification of Research Projects This Institutional Review Board Handbook contains descriptions of procedures and forms required by Argosy University for any research project conducted by employees or students of Argosy University, and for the conduct of research by outside organizations or institutions seeking the involvement of any Argosy University employee or student. This includes research done for dissertations, Clinical Research Projects (CRPs), and other significant research, but it also includes research done for student posters, PowerPoint presentations, and class assignments where research is being done.
  • 25. view Board Handbook 6. Analyze the data and interpret findings Quantitative Data Analysis that need to be summarized, described and analyzed. escribed and explored by drawing graphs and charts, doing cross tabulations and calculating means and standard deviations. patterns and relationships in the data by comparing means, exploring correlations, performing multiple regressions, or analyses of variance. build sophisticated explanations of how the data addresses the original question. greatly, the following steps are common in quantitative data analysis: o Identifying a data entry and analysis manager (e.g., SPSS) o Reviewing data (e.g., surveys, questionnaires etc) for completeness o Coding data
  • 26. o Conducting Data Entry o Analyzing Data (e.g. statistical tests). Qualitative Data Analysis of words generated by interviews or observational data. themes that have been identified or relate behavior or ideas to biographical characteristics of respondents. data, or interpretation sought of puzzling findings from previous studies. tely theory could be developed and tested using advanced analytical techniques. steps are typical for qualitative data analysis: o Familiarization with the data through repeated reading, listening http://www.ausfba.com/IRB/AU%20Institutional%20Review%2 0Board%20Handbook%20revised%20Oct%202010.pdf
  • 27. o etc. o Transcription of interview etc. material. o Organization and indexing of data for easy retrieval and o identification (e.g. by hand or computerized programs such as (Nvivo) o Maintaining anonymity of sensitive data. o Coding (may be called indexing). o Identification of themes. o Development of provisional categories. o Exploration of relationships between categories. o Refinement of themes and categories. o Development of theory and incorporation of pre-existing knowledge. For more information see 'Qualitative Research' from Trent RDSU. Interpreting Data relevant information on statistics findings to see whether they support your initial study hypotheses, theory or research questions. the theoretical focus (i.e., Qualitative or Quantitative research) and methods (e.g., Multiple Regression,
  • 28. Grounded Theory). o Computer Package Manuals (e.g., SPSS, Nvivo) and methodology books o The material in Section 3 of this flowchart on statistics and sampling issues http://www.qsrinternational.com/products_nvivo.aspx http://www.rddirect.org.uk/queries/Website.asp#4 http://www.statsoft.com/textbook/multiple-regression/#general http://www-01.ibm.com/software/analytics/spss/ http://www.qsrinternational.com/products_nvivo.aspx Information Competence Tutorials Information Competency Tutorials Main Menu Bilingual Version Bilingual Version Feedback Feedback
  • 29. Credits ● Welcome ● Technical Requirements ● Additional Help ● Credits Information for Students Information for Faculty 1. What you will learn 2. Additional Help 3. How students can use the CUNY ICT 4. Choosing a Topic and Research Strategies-
  • 30. Tutorials 1 and 2 5. Finding Information- Tutorials 3 and 4 6. Evaluate the Quality and Bias of Information and Credit Sources Responsibly- Tutorials 5, 6, 7 and 8 1. Information Literacy 2. How faculty can use the CUNY ICT 3. Tutorial Content- Quick Look �❍ Tutorials 1 & 2: Choosing a Topic and Research Strategies �❍ Tutorials 3 & 4: Finding Information
  • 31. �❍ Tutorials 5, 6, 7 & 8: Evaluation the Quality and Bias of Information and Credit Sources Responsibly 4. Assignment Resources 5. Additional Help Welcome to the City University of New York Information Competency Tutorials (ICT). These eight tutorials will not only teach you how to become an A+ researcher but will develop your information literacy and critical thinking skills. The tutorials follow a set of CUNY information literacy learning goals and objectives that all students should achieve by the time they have completed 60 credits. Technical requirements This tutorial requires the free Flash (version 5 or higher) player. Click here for help downloading Flash. You may be able to use Tutorial more smoothly with FireFox http://www.hostos.cuny.edu/library/info_lit/library/guide.html (1 of 2) [3/23/2012 9:50:46 AM] http://www.hostos.cuny.edu/library/info_lit/library/ http://www.hostos.cuny.edu/library/info_lit/library/indexSPA.ht ml
  • 32. http://www.hostos.cuny.edu/library/HHCL_New_Web/New_Spa nish_Tutorial/revised/tutorialespanol/feedback.htm http://www.hostos.cuny.edu/library/HHCL_New_Web/New_Spa nish_Tutorial/revised/tutorialespanol/feedback.htm http://www.hostos.cuny.edu/library/info_lit/library/feedback.ht ml http://www.hostos.cuny.edu/library/info_lit/library/credits.html http://www.hostos.cuny.edu/library/info_lit/library/guidestudent s.html#facultyinfo http://www.hostos.cuny.edu/library/info_lit/library/guidestudent s.html#facultyinfo http://www.hostos.cuny.edu/library/info_lit/library/guidefac.ht ml#studentinfo http://www.hostos.cuny.edu/library/info_lit/library/guidestudent s.html#youlearn http://www.hostos.cuny.edu/library/info_lit/library/guidestudent s.html#youlearn http://www.hostos.cuny.edu/library/info_lit/library/guidestudent s.html#additional http://www.hostos.cuny.edu/library/info_lit/library/guidestudent s.html#studenthow http://www.hostos.cuny.edu/library/info_lit/library/guidestudent s.html#studenthow http://www.hostos.cuny.edu/library/info_lit/library/guidestudent s.html#studenthow http://www.hostos.cuny.edu/library/info_lit/library/guidestudent s.html#topic http://www.hostos.cuny.edu/library/info_lit/library/guidestudent s.html#topic http://www.hostos.cuny.edu/library/info_lit/library/guidestudent s.html#topic http://www.hostos.cuny.edu/library/info_lit/library/guidestudent s.html#topic http://www.hostos.cuny.edu/library/info_lit/library/guidestudent s.html#topic http://www.hostos.cuny.edu/library/info_lit/library/guidestudent
  • 33. s.html#topic http://www.hostos.cuny.edu/library/info_lit/library/guidestudent s.html#findinfo http://www.hostos.cuny.edu/library/info_lit/library/guidestudent s.html#findinfo http://www.hostos.cuny.edu/library/info_lit/library/guidestudent s.html#findinfo http://www.hostos.cuny.edu/library/info_lit/library/guidestudent s.html#findinfo http://www.hostos.cuny.edu/library/info_lit/library/guidestudent s.html#evaluate http://www.hostos.cuny.edu/library/info_lit/library/guidestudent s.html#evaluate http://www.hostos.cuny.edu/library/info_lit/library/guidestudent s.html#evaluate http://www.hostos.cuny.edu/library/info_lit/library/guidestudent s.html#evaluate http://www.hostos.cuny.edu/library/info_lit/library/guidestudent s.html#evaluate http://www.hostos.cuny.edu/library/info_lit/library/guidestudent s.html#evaluate http://www.hostos.cuny.edu/library/info_lit/library/guidestudent s.html#evaluate http://www.hostos.cuny.edu/library/info_lit/library/guidestudent s.html#evaluate http://www.hostos.cuny.edu/library/info_lit/library/guidestudent s.html#evaluate http://www.hostos.cuny.edu/library/info_lit/library/guidefac.ht ml#infolit http://www.hostos.cuny.edu/library/info_lit/library/guidefac.ht ml#howfacultyuse http://www.hostos.cuny.edu/library/info_lit/library/guidefac.ht ml#howfacultyuse http://www.hostos.cuny.edu/library/info_lit/library/guidefac.ht ml#topic http://www.hostos.cuny.edu/library/info_lit/library/guidefac.ht
  • 34. ml#topic http://www.hostos.cuny.edu/library/info_lit/library/guidefac.ht ml#topic http://www.hostos.cuny.edu/library/info_lit/library/guidefac.ht ml#topic http://www.hostos.cuny.edu/library/info_lit/library/guidefac.ht ml#topic http://www.hostos.cuny.edu/library/info_lit/library/guidefac.ht ml#findinfo http://www.hostos.cuny.edu/library/info_lit/library/guidefac.ht ml#findinfo http://www.hostos.cuny.edu/library/info_lit/library/guidefac.ht ml#findinfo http://www.hostos.cuny.edu/library/info_lit/library/guidefac.ht ml#evaluate http://www.hostos.cuny.edu/library/info_lit/library/guidefac.ht ml#evaluate http://www.hostos.cuny.edu/library/info_lit/library/guidefac.ht ml#evaluate http://www.hostos.cuny.edu/library/info_lit/library/guidefac.ht ml#evaluate http://www.hostos.cuny.edu/library/info_lit/library/guidefac.ht ml#evaluate http://www.hostos.cuny.edu/library/info_lit/library/guidefac.ht ml#evaluate http://www.hostos.cuny.edu/library/info_lit/library/guidefac.ht ml#evaluate http://www.hostos.cuny.edu/library/info_lit/library/guidefac.ht ml#assignments http://www.hostos.cuny.edu/library/info_lit/library/guidefac.ht ml#help2 http://www.adobe.com/products/flashplayer/ Information Competence Tutorials
  • 35. browser Additional Help Stop in, call or email your local campus library. Click here for a list of CUNY Campus Libraries Credits Web pages on which this introduction is based include: California State University (CSU) – Introductory Competencies in Specific Disciplines and CSU – Information Competence Project – Module Outlines Spanish translation of the CUNY Information Competency Tutorials was made possible by a grant from the CUNY Office of Compliance and Diversity, Diversity Projects Development Fund. Prof. José Diaz, Hostos Community College and Prof. George Thorsen, Queensborough Community College translated these modules into Spanish. The Hostos Community College Instructional Technology support center staff migrated all of the IL Competency modules into a new, more attractive format as part of a Perkins Grant to provide 24/6 online tutorial resources to students. A special thanks goes to Hostos Community College and George Rosa, Elkin Urrea, and Carlos Victoria for
  • 36. their work on the migration and design. http://www.hostos.cuny.edu/library/info_lit/library/guide.html (2 of 2) [3/23/2012 9:50:46 AM] http://www1.cuny.edu/academics/info- central/library/libinfo/CampusLibraryList.html http://www1.cuny.edu/academics/info- central/library/libinfo/CampusLibraryList.html http://www.lib.calpoly.edu/infocomp/specific.html http://www.lib.calpoly.edu/infocomp/specific.html http://www.lib.calpoly.edu/infocomp/project/outline.html http://www.lib.calpoly.edu/infocomp/project/outline.htmlcuny.e duInformation Competence Tutorials I. A Feedback Model of the Research Process II. Strategies for Statistical Thinking The purpose of this section is to provide students basic strategies to practice statistical thinking, in addition to fundamental applications. Teaching statistical thinking and improving performance involves learning how to resolve a number of ambiguities during the statistical inquiry process that are not found in typical homework problems and exams. Inquiry with ill- structured problems requires a number of skills that need to be developed during the course: a. “Generating a curiosity about the world that identifies “I wonder problems”; b. Writing a measurable question that provides insight into these problems;
  • 37. c. Determining relevant valid and accessible data; d. Planning and carrying out data collection; e. Checking, cleaning and organizing data; f. Recognizing the data's limitations; g. Analyzing and interpreting data; h. Articulating findings; i. Seeking explanations; and, j. Generating further questions (4)”. This iterative process often requires revision as new understandings develop and unanticipated problems or opportunities arise. The weekly discussion questions provide an opportunity to develop inquiry skills throughout the course. Inquiry is a well-accepted (but not always implemented) process in other subjects, such as science and social studies, but requires development of skills often absent in statistics courses, like the ones listed below: · “Ability to cope with ambiguity and uncertainty; · Re-balance between instructor guidance and student independence; · Recognition of opportunities for learning in unexpected outcomes; · Flexible and creative thinking;
  • 38. · Deep understanding of disciplinary content; and · Tolerance for periods of noise and disorganization (4)”. This overview discusses the thought processes involved in statistical problem solving in the broad sense from problem formulation to conclusions. It draws on the literature and on the article published by C. J. Wild and M. Pfannkuch, Statistical Thinking in Empirical Enquiry,aimed at uncovering the statistical reasoning processes. The content for this overview has been excerpted from this article and has been modified and adapted to help students develop a framework for statistical thinking throughout the course. The process from problem specification to outcome is complex and iterative. Not only is the process iterative, but at each stage one often looks back to the previous step and re-evaluates the validity of the decisions made. The process is described in terms of a sequence of steps labeled PPDAC: Problem; Plan; Data; Analysis; and Conclusions, that is useful for statistical thinking (1). The PPDAC approach is shown in the figure below. Figure I. PPDAC Model: Problem; Plan; Data; Analysis; and Conclusions (1) This diagram(1) shows that, although the clockwise sequence (1→5) applies as the principal flow, each stage may, and often will, feed back to the previous stage. In addition, it may well be beneficial to examine the process in the reverse direction, starting with Problem definition and then examining expectations as to the format and structure of the Conclusions. This procedure then continues, step-by-step, in a counterclockwise manner (e→a) determining the implications of these expectations for each stage of the process (The Pennsylvania State University, 2010).
  • 39. The PPDAC model develops information that is gathered by the analysis data, such as detecting and describing patterns, trends, and relations in data. As something relevant is detected in data, new questions arise, causing specific parts to be viewed in more detail. Applied statistics is part of the information gathering and learning process which is undertaken to inform decisions and actions. Multiple sectors of society increasingly rely on data for decision making, therefore, statistics has become an integral part of the emerging information era that is used to expand the body of knowledge in many fields. As shown in Figure III (3), learning is much more than collecting information, it involves synthesizing the new ideas and information with existing ideas and information into an improved understanding. Figure II. Triggers for stimulating descriptive, inferential, and contextual thoughts (Pfannkuch, M., 2010) Wild and Pfannkuch (1999) paper on statistical thinking describes a four dimensional framework for statistical thinking and inquiry, which is shown in Figure IV (2). It includes an investigative cycle, an interrogative cycle, types of thinking and dispositions. The authors characterize these processes through models that can be used as a basis for thinking tools for the enhancement of problem-solving. A brief description for each of these models is presented in the subsequent paragraphs. Figure IV.A 4-Dimensional Framework for Statistical Thinking (C. J. Wild and M. Pfannkuch, 1999) 1. Dimension One: The Investigative Cycle
  • 40. The first dimension is illustrated in Figure (a) Dimension 1(2). It concerns the way one acts and what one thinks about during the course of a statistical investigation. Certain learning goals must be met to arrive at the desired level of understanding. A PPDAC investigative cycle is set off to achieve each learning goal. Knowledge gained and needs identified within these cycles may initiate further investigative cycles. The conclusions from the investigations feed into an expanded context- knowledge base which can then inform any actions (C. J. Wild, 1999). (C. J. Wild and M. Pfannkuch, 1999) 2. Dimension Two: Types of Thinking A number of general and fundamental types of thinking are shown in Figure (b) Dimension 2(2). The four dimensional framework seeks to organize some of the elements of statistical thinking during data-based enquiry. The thinker operates in all four dimensions at once. For example the thinker could be categorized as currently being in the planning stage of the Investigative Cycle (Dimension I), dealing with some aspect of variation in Dimension 2 (Types of Thinking) by criticizing a tentative plan in Dimension 3 (Interrogative Cycle) driven by skepticism in Dimension 4 (Dispositions). Who is doing this thinking? Anyone involved in enquiry, either individually or as a member of a team. While this approach is not peculiar to statisticians, the quality of the thinking can be improved by gaining more statistical knowledge (C. J. Wild, 1999). 3. Dimension Three: The Interrogative Cycle The Interrogative Cycle illustrated in Figure (c) Dimension 3(2), is a generic thinking process in constant use in statistical problem solving. It appears that the thinker is always in one of
  • 41. the interrogative states while problem solving. The cycle applies at macro levels, but also at very detailed levels of thinking because the interrogative cycle is recursive. Sub-cycles are initiated within major cycles, e.g. the "checking" step of any cycle can initiate a full interrogative sub-cycle. The ordered depiction on a wheel is an idealization of what perhaps should happen. In reality steps are often missed. We discuss the Interrogative Cycle as we observed it, being applied to statistical enquiry and statistical critique. The "thinker" is anyone involved in these activities (C. J. Wild, 1999). (C. J. Wild and M. Pfannkuch, 1999) 4. Dimension Four: Dispositions Dispositions are the personal qualities that affect, or even initiate, entry into a thinking mode; they are summarized in Figure (d) Dimension 4 (2). While these elements are generic, they are discussed in the context of statistical problem solving. (C. J. Wild and M. Pfannkuch, 1999) · Curiosity and Awareness - Discoveries are triggered by someone noticing something and reacting to internal questions like "Why?', or "How did that happen?", or "Is this something that happens more generally?', or "How can I exploit this?" Being observant (aware) and curious are the well-springs of the question generation process that all innovative learning results from. Wild (1994) formed the slogan "Questions are more important than answers" to emphasize this point (C. J. Wild, 1999). · Engagement - It occurs when you become intensely interested in a problem or area; a heightened sensitivity and awareness develops towards information on the peripheries of the experience that might be related to the problem. People are most observant in those areas that they find most interesting.
  • 42. Engagement intensifies each of the "dispositional" elements curiosity, awareness, imagination and perseverance (C. J. Wild, 1999). How do we become engaged? Spontaneous interest is innate; background knowledge helps - it is hard to be interested in something one knows nothing about. Being paid to do a job helps, as does the problem being important to people we care about. This may be our main difficulty in getting statistics students to think. They simply do not find the problems they are asked to think about interesting enough to be really engaged by them. We observed the effects on performance of engagement with some tasks and not others in the statistics students (C. J. Wild, 1999). · Imagination - It is hard to overemphasize the importance of imagination to statistical thinking. The formation of mental models that grasp the essential dynamics of a problem is a deeply imaginative process, as is viewing a situation from different perspectives, and generating possible explanations or confounding explanations for phenomena and features of data (C. J. Wild, 1999). · Skepticism: By skepticism, we mean a tendency to be constantly on the lookout for logical and factual flaws when receiving new ideas and information. It is a quality statisticians both possess and value. Some writers refer to this as "adopting a critical attitude" (C. J. Wild, 1999). · Being logical - The ability to detect when one idea follows from another and when it does not and, to construct a logical argument is clearly important to all thinking. Synthesis of new information with existing knowledge is largely a matter of seeing implications. Logical reasoning is the only sure way to arrive at valid conclusions. To be useful, skepticism must be supported by ability to reason from assumptions or information
  • 43. to implications that can be checked against data (C. J. Wild, 1999). A propensity to seek deeper meaning means not simply taking things at face value and being prepared to dig a little deeper. Of the other "dispositions", openness helps us to register and consider new ideas and information that conflict with our own assumptions and perseverance is self-evident (C. J. Wild, 1999). Can "dispositions" be taught? - A person's "dispositions" are typically problem dependent - they change according to the degree to which the person is engaged by the problem. While some people are skeptical and others are credulous, it seems that credulousness in a particular area is a result of ignorance. That is, as you gain experience and see ways in which certain types of information can be unsoundly based and turn out to be false, you become more skeptical. What we want from skepticism is a prompting to raise certain types question concerning the reliability of information, which can be taught (C. J. Wild, 1999). INFERENTIAL 15 1. The project needs to have a ''Problem"" to be resolved (What is the problem?)/survey technique 2. Define the population 3. Development the research question 4. Presentation Of final: * Cover page *Abstract - No more than 120 words. Use key words.
  • 44. *Introduction * Part I * Part II *Part III/V *Conclusion *References (at least 10, it is not necessary more than 10) 20% maximum of citations Maximum length 15/16 pages full project/ 10 pages parts I to V STEPS 1. (P) PROBLEM 2. (P) PLAN 3. (D) DATA - SECONDARY DATA?? How many restaurants have done this kind of training? Did it work? Look for another business in the same segment to compare. 4. (A) ANALYSIS 5. (C) CONCLUSIONS STAGES SELECTING OF A SAMPLE 1. Define the target population 2. Select a sampling frame 3. Determine if a probability or nonprobability sampling methods will be chosen 4. Plan procedure for selecting simple units 5. Determine sample size 6. Select actual sampling units FIRST PART – THE RESEARCH SCENARIO We are the management group of three high-end Italian-food restaurants distributed in South Beach, Aventura and Brickell, employing 25 waiters all of whom work on-site. We have been in the business for the past five years making good profit, but after been analyzing the new market of Miami and to see where we would like to be positioned in the industry within the next three years, we had reach to the conclusion that there is more room to keep growing, so we had a meeting where we used the
  • 45. brainstorming method to come up with fresh ideas. One of the most important question that came up in the meeting to increase the revenues was, how can we do to increase the average check of the customers? This question took us to set a new short-term goal, increase the average check. There are some different ways to do it, but the most applicable, reachable, easier and with a win-win way for our servers’ staff to be motivated and reach the goal was increase the knowledge about the different types of wines. After agreeing to aim for the goal through this way, we needed to train our staff, which will not be easy because they will have to come to the trainings before the shift being motivated and willing to learn. We convinced them that this training not only will enrich their career in the hospitality industry, but also, it will serve them in life, because knowing about wine is a tool which you can use it for example when you go out to have a dinner and discuss business with a probably investor, partner, etc. The process we established was, first, we hired a sommelier (man who knows everything about wine) whose was going to be in charge of doing the training. Then, he will do a test before the training for our servers with the purpose to know how is their current knowledge about wines (red wine, white wine, champagne) where he divided in different categories to attend to different classes based in the knowledge they had. Subsequently, the training was presented in three categories once a week for the next eight weeks. Once the training is over, they will be conducting another assessment to categorize them into different levels of knowledge, where the best will serve the best tables in the restaurants (this means having the best clientele and consequently more money for the worker). This is because the best middlemen are more able to sell more wine, to create a better customer relationship because they are more knowledgeable about wine. For example, which region the wine is from, which menu item will best match, what its taste, history and other related thing.
  • 46. This could sound meaningless but the clients after having this experience where he is able to see how informed are the workers at the restaurant, how good are the recommendations they received, they will talk to their friends and will recommend to come to visit the place and will be more likely to spend more money. PROBLEM STATED BY THE GROUP The business is not selling so much wine as it could because the waiters are not properly trained to sell it. They (the waiters) have lack of knowledge about the wine, they don’t know from where it comes, which grapes they are done, resulting in lost profit and not satisfaction by consumers Comment by Adriana Rigotti: This is your problem. . . . Who are they? Waiters How would you provide an adequate solution? Training Purpose Comment by Adriana Rigotti: What is the difference between white and red wine? Offer the waiters an adequate training to leverage their knowledge about wine. QUESTIONS THAT WE SHOULD DO AND ANSWER 1. How are we going to train our staff? What is the solution? 2. Use descriptive Statistics (use chart name brand, quality and cost. It is below) 3. We are measuring our staff in level 1, 2 and 3, based on their knowledge about wine thought the questionnaire. 4. We should, by database, find out companies in the same field that recently have done this kind of research and training and compare with our business. QUESTIONNAIRE that should be answered by waiters. We should choose 5 to 6 questions to be answered. Comment by Adriana Rigotti: How would you compare wine brands one over the other? 1. What is corked wine?
  • 47. 2. Why does wine get its tannins from? 3. Why should you swirl a wine before smelling it? 4. How do red grapes make white wines? 5. What kind/taste of wine fits better with meat? 6. What kind/taste of wine fits better with pasta? 7. In which French wine region, you can find a grape Chardonnay? 8. Why are the traditional 5 Bordeaux Grapes? 9. Chablis is made from which grape? 10. What are the 3 grapes that go into making Champagne? 11. The process of making Champagne is called? 12. What is a Blanc de Blanc Champagne? 13. What is a Blanc the Noir Champagne? 14. Name New Zealand 3 main grapes varieties 15. What’s the difference between Pouilly Fume and Pouilly Fuisse? 16. Which Valley in France is Sancerre located? 17. Name 1 major wine producing region in Argentina. Wine Brand Name Quality Cost
  • 48. Cost Volume Profit Analysis (CVP) Number of units – assign a cost value? Revenue = Cost Why does variable cost per unit stay the same but total cost varies with the number of units you produce? How do you choose what activity base to use? Why does fixed cost remain the same in total dollar amount but increase or decrease per unit as the level of activity changes? What do increases in fixed cost do to break-even analysis? What do increases in variable cost do to break-even analysis? Pricing? FIRST PART – THE RESEARCH SCENARIO We are the management group of three Italian-food restaurants distributed in South Beach, Aventura and Brickell, employing around 50 employees. We have been in the business for the past five years making good profit, but after been analyzing the new market of Miami and to see where we would like to be positioned in the industry within the next three years, we had reach to the conclusion that there is more room to keep growing, so we had a meeting where we used the brainstorming method to come up with fresh ideas. One of the most important question that came up in the meeting to increase the revenues was, how can we do to increase the average check of the customers? This question took us to set a new short-term goal, increase the average check. There are some different ways to do it, but the most applicable, reachable, easier and with a win-win way for our servers’ staff to be motivated and reach the goal was increase the knowledge about the different types of wines. After agreeing to aim for the goal through this way, we needed to train our staff, which will not be easy because they will have to come to the trainings before the shift being motivated and willing to learn. We convinced them that this training not only
  • 49. will enrich their career in the hospitality industry, but also, it will serve them in life, because knowing about wine is a tool which you can use it for example when you go out to have a dinner and discuss business with a probably investor, partner, etc. The process we established was, first, we hired a sommelier (man who knows everything about wine) whose was going to be in charge of doing the training. Then, he will do a test before the training for our servers with the purpose to know how is their current knowledge about wines (red wine, white wine, champagne, sake) where he divided in different categories to attend to different classes based in the knowledge they had. Subsequently, the training was presented in three categories once a week for the next eight weeks. Once the training is over, they will be conducting another assessment to categorize them into different levels of knowledge, where the best will serve the best tables in the restaurants (this means having the best clientele and consequently more money for the worker). This is because the best middlemen are more able to sell more wine, to create a better customer relationship because they are more knowledgeable about wine. For example, which region the wine is from, which menu item will best match, what its taste, history and other related thing. This could sound meaningless but the clients after having this experience where he is able to see how informed are the workers at the restaurant, how good are the recommendations they received, they will talk to their friends and will recommend to come to visit the place and will be more likely to spend more money. QUESTIONNAIRE 1. What is carked wine? 2. Why does wine get its tannins from? 3. Why should you swirl a wine before smelling it? 4. How do red grapes make white wines? 5. In which French wine region, you can find a grape
  • 50. Chardonnay? 6. Why are the traditional 5 Bordeaux Grapes? 7. Chablis is made from which grape? 8. What are the 3 grapes that go into making Champagne? 9. The process of making Champagne is called? 10. What is a Blanc de Blanc Champagne? 11. What is a Blanc the Noir Champagne? 12. Name New Zealand 3 main grapes varieties 13. What’s the difference between Pouilly Fume and Pouilly Fuisse? 14. Which Valley in France is Sancerre located? 15. Name 1 major wine producing region in Argentina. Research Project The purpose of this final research project is to give you the opportunity to formulate research questions, run the analyses, and interpret the results of the statistics covered in this class. The final research paper is due by midnight on the due date, Sunday, October 27, 2019, as a single Microsoft Word document placed in the last week. The document must be in APA format. Please read through the instructions. The final research project consists of three sections I. The research scenario—to provide the context for the data. Please note that the data are “content-neutral,” i.e., they do not refer to a specific discipline or field. II. The codebook—this identifies the variables (names, labels, and measurement scale) in the database. III. The final research paper instructions—for completing the research paper. Be sure to read each question carefully and answer each question completely. I. Research Scenario:
  • 51. An organization wants to know if participants with varying levels of expertise (professionals, paraprofessionals, and nonprofessionals) improve their knowledge after completing a training program. The organization collected demographic information: gender, age, type of training (professional, paraprofessional, or nonprofessional), location of the worksite (on-site or off-site) and years of experience. A pre-training test of knowledge, a training program, and post- training test of knowledge was developed. Participants were tested, then participated in the three-week training program, and then were tested again. The dataset also includes (1) a measure of participant confidence in knowledge and (2) a certification exam score. The data are discipline-neutral. Therefore, part of your final project is to create a context for the research that is associated with your discipline or area of interest (e.g., training to assess mental health status; training to work with special education children; training to become a technician or consultant). II. Codebook Variable Information Variable Label Measurement Scale Category Name ID N/A N/A N/A Gender Gender Nominal 1 = Male
  • 52. 2 = Female age Age in Years Ratio qualification Professional Qualification Nominal 1 = Professional 2 = Paraprofessional 3 = Nonprofessional worksite Location of Work Nominal 1 = On-Site 2 = Off-Site knowledge1 Level of knowledge before Training Interval N/A knowledge2 Level of knowledge after Training Interval N/A years Years of Experience Ratio N/A confidence Confidence in knowledge Interval N/A exam
  • 53. Certification in knowledge Interval N/A III. Final Research Paper Instructions Overview Your task is to review the dataset, formulate a context, and then use your knowledge of statistics to answer the research questions and test hypotheses that will help the organization evaluate the effectiveness of the program. Part I. Create your context. Using the research scenario and variables identified in the codebook, create a “story” that describes the purpose and focus of the study. In a few paragraphs describe the intent of your investigation in the form of a problem background and purpose statement. Part II. Describe your sample. Generate frequency tables and bar charts for the nominal variables. Generate and interpret descriptive statistics of central tendency, variability, skewness, and kurtosis for the continuous (scale) variables. Generate frequency tables and histograms with the normal curve superimposed for each scale variable. Label your tables and graphs according to APA format. Conclude with a paragraph summarizing the demographic characteristics of this sample. 1. Gender (nominal) 2. Age (scale) 3. Qualification (nominal) 4. Worksite (nominal) 5. Knowledge1 (scale) 6. Knowledge2 (scale) 7. Years (scale) 8. Confidence (scale) 9. Exam (scale) Part III. Describe relationships among the variables. Select the variables that are measured on interval or ratio scales. Create a correlation matrix. Label the table according to
  • 54. APA format. Identify and discuss the strongest and weakest correlations. Part V. Summarize your findings. Synthesize the results of your five analyses. Include a brief summary of the sample characteristics and the major findings. Interpret the findings so that the organization’s leaders will have an understanding of the similarities and differences in knowledge, and how effective the training program is in improving knowledge. All written assignments and responses should follow APA rules for attributing sources. Rev. 10 July 2019 14