
Recommended
Recommended
More Related Content
Similar to CHAPTER 15PROBLEM 15.2For this problem, we will use the expe.docx
Similar to CHAPTER 15PROBLEM 15.2For this problem, we will use the expe.docx (20)
More from bartholomeocoombs
More from bartholomeocoombs (20)
Recently uploaded
Recently uploaded (20)
CHAPTER 15PROBLEM 15.2For this problem, we will use the expe.docx
- 1. CHAPTER 15 PROBLEM 15.2 For this problem, we will use the experiment presented in Chapter 15, Problem 25, p. 394 of the textbook. For convenience, the experiment is repeated here. A university researcher knowledgeable in Chinese medicine conducted a study to determine whether acupuncture can help reduce cocaine addiction. In this experiment, 18 cocaine addicts were randomly assigned to one of three groups of 6 addicts per group. One group received 10 weeks of acupuncture treatment in which the acupuncture needles were inserted into points on the outer ear where stimulation is believed to be effective. Another group, a placebo group, had acupuncture needles inserted into points on the ear where stimulation is known not to be effective. The third group received no acupuncture treatment; instead, addicts in this group received relaxation therapy. All groups also received counseling over the 10-week treatment period. The dependent variable was craving for cocaine as measured by the number of cocaine urges experienced by each addict in the last week of treatment. The following are the results. Acupuncture + Counseling Placebo + Counseling Relaxation +
- 3. 6 Use SPSS to do a one-way independent groups ANOVA on the data, with a = 0.05 to determine if at least one of the groups differs significantly from at least one of the other groups. Do a planned comparison between the Acupuncture + Counseling group and the Placebo + Counseling group, using α = 0.052 tail. If the one-way ANOVA yields significant results, do the Tukey HSD post hoc test to see which groups differ from each other, again using α = 0.052 tail. If you choose to enter the data by typing it into the Data Editor, name the variables, “Group” and “Urges.” The saved data file for this problem is “Ch15prob2.” See Solution Below. SOLUTION Step 1: Enter and Name the Data.
- 4. As usual, you have three choices for entering the data: 1) by typing the scores directly into the Data Editor; 2) by downloading from the web the saved data file for this example, and 3) by opening the saved data file (for this example) that resides on your computer. Entering the scores by typing them directly into the Data Editor. If you choose to type in the data, remember to name the grouping variable Group and the other variable Urges . If you have any questions, please follow the instructions in Illustrative Example 1 for Chapter 15, substituting the variables and scores for this problem. Entering the scores by downloading from the web, the saved data file for this example. To enter the scores using this option, click here , and then click Open
- 5. from the drop-down menu. Entering the scores by opening the saved data file (for this example) that resides on your computer . If you choose to open the saved data file, the name of the file is Ch15prob2 . To enter the data and name the variables for this problem, please follow the instructions in Illustrative Example 1 for Chapter 15. When the data are entered and named correctly, the Data Editor, Data View should look like Figure 15.2.1. Figure 15.2.1. Data Editor with Group and Urges scores entered. Step 2: Conclusion Regarding the Overall Effect of the Independent
- 6. Variable, using α = 0.05 Plus Planned and Post Hoc Comparisons . The appropriate test to evaluate the overall effect of the independent variable is the One-Way Analysis of Variance. To have SPSS do the analysis using this test, Click Analyze . Select Compare Means . Click One-Way ANOVA… . Click the ► button
- 7. for the F actor: box. Click Urges in the large box on the left. Click the ► button for the D e pendent List: box. Click the O ptions button. Click
- 10. Click A dd . Click Continue . Click the Post Hoc… button at the bottom-middle of the dialog box. Click T ukey . Click Continue
- 11. . Click OK . This produces a drop-down menu. This also produces a drop-down menu. This produces the One-Way ANOVA dialog box with Group highlighted. This moves Group into the F actor: box. This highlights
- 12. Urges . This moves Urges into the D e pendent List: box. This produces the One-Way ANOVA: Options dialog box. This puts a P in the D escriptive box, telling SPSS to compute some descriptive statistics and include them in the output. This returns you to the One-Way ANOVA
- 13. dialog box. You have finished telling SPSS what it needs to know to do the One-Way ANOVA . Let’s now implement the planned comparisons analysis. We will follow this with the Tukey post hoc analysis. This produces the One-Way ANOVA: Contrasts dialog box. The coefficients for doing planned comparisons are entered in this dialog box. Since you are asked to do a planned comparison between the Acupuncture + Counseling group (Group 1, according to our assignment of grouping values in the Data Editor) and the Placebo + Counseling group (Group 2) the correct coefficients for this planned comparison are 1 -1 0. Alternately, we could use -1 1 0. Let’s use 1 -1 0. This moves the 1 into the large box below the Coefficients: box .
- 14. This moves the -1 into the large box below the Coefficients: box . This moves the 0 into the large box below the Coefficients: box. You have finished entering the planned comparison, 1 -1 0 . This returns you to the One-Way ANOVA dialog box. You are now ready to implement doing the Tukey HSD post hoc test. This produces the One-Way ANOVA: Post Hoc Multiple Comparisons dialog box.
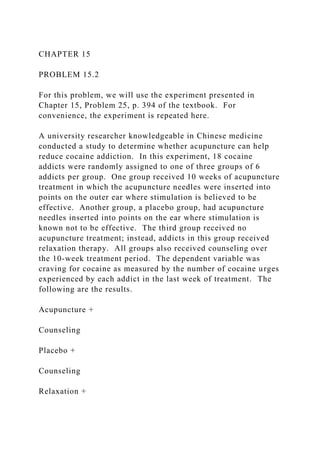
- 15. This puts a P in the T ukey box and tells SPSS to do the Tukey HSD test when you give it the OK. This returns you to the One-Way ANOVA dialog box. SPSS analyzes the Stress data and outputs the results to the Viewer. The output is shown below in Figure 15.2.2. Figure 15.2.2. Results of
- 16. One-Way ANOVA analysis including planned and post hoc testing. The SPSS viewer shows six tables, the Descriptives table, the ANOVA table, the Contrasts Coefficients table, the Contrasts Tests table, the Multiple Comparisons table, and the Stress table. The ANOVA table is the table we use to conclude about the overall effect of the independent variable. This table shows that F obt = 8.543 and the obtained probability is .003
- 17. . Since .003 < 0.05, your conclusion is to reject H 0. The three treatments are not equal in their effect on cocaine urges. The Contrasts Coefficients table and the Contrasts Tests table pertain to the planned comparisons. There is only one planned comparison, the comparison between the Acupuncture + Counseling group and the Placebo + Counseling group (coefficients 1 -1 0). The Contrasts Tests table gives the results of this planned comparison. We are interested in the Assume equal variances part of the table. For this planned comparison (contrast 1), to bt = -3.866 with an obtained probability of
- 18. .0022 tailed . Since .002 < 0.05, you reject H 0. It appears that Acupuncture + Counseling has a greater effect on reducing cocaine urges than Placebo + Counseling. The Multiple Comparisons table gives the results of the Tukey HSD post hoc test. The comparison between Group 1 and Group 2 yielded an obtained probability value of .004 ; the comparison between Group 1 and Group 3 yielded an obtained probability value of .016 ; and the comparison between Group 2 and Group 3 yielded an obtained probability value of .786 . Thus, you can reject H 0 using α
- 19. = 0.05 for the Group 1 – Group 2 comparison, and the Group 1 – Group 3 comparison, but not for the comparison between Group 2 and Group 3. Thus, Acupuncture + Counseling significantly reduced cocaine urges compared to both Placebo + Counseling and Relaxation Therapy + Counseling, but you can’t affirm that Relaxation Therapy + Counseling does better than Placebo + Counseling. Again the planned comparison probability is lower than the post hoc comparison probability (.002 verses .004).