The CMO Survey - Highlights and Insights Report - Spring 2024
Bigpic 02 15 08 125242 Email
1. Market Declines Are Normal
Over the years, stocks have provided excellent growth potential, but not without risk. If
historical results are any guide, stock investors should expect to see declines of 5% to
10% quite regularly, and more severe corrections every few years. Since 1900, there have
been 370 declines of at least 5% and close to 60 declines of 15% or more. Declines are
so normal, in fact, that even in 1999—a year in which the Dow rose over 25%—there were
three declines of 5% or more. The table below shows just how normal declines are.
As normal as declines are, over the long term the market has trended upward. Consider
October 19, 1987, when the Dow Jones Industrial Average dropped more than 20%—the
worst one-day percentage decline in the index’s history. Now that day appears as a mere
“blip on the screen” in the stock market’s overall history of success. Over time, by the
measure of the S&P 500 Index, the “ups” of the market have outweighed the “downs” and
the market has continued to rise.
Economic news and events can be distracting for any investor, making it difficult to
maintain a long-term focus. Smart investors stay put and maintain a long-term focus.
How can you maintain your long-term focus? Stay informed about the news and your
portfolio’s performance—but keep short-term events in perspective. While there are risks
associated with investing, it can be rewarding. As the illustration on the next page shows,
a hypothetical investment of $10,000 invested in the stock market, as measured by the
S&P 500 Index, in 1980 would have grown to $191,020 by December 31, 2008.
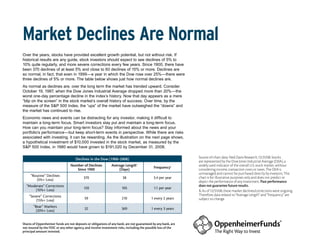
Declines in the Dow (1900–2008) Source of chart data: Ned Davis Research, 12/31/08. Stocks
are represented by the Dow Jones Industrial Average (DJIA), a
Number of Declines Average Length1 widely used indicator of the overall U.S. stock market, without
Frequency1
Since 1900 (Days) considering income, transaction costs or taxes. The DJIA is
unmanaged and cannot be purchased directly by investors. This
“Routine” Declines chart is for illustrative purposes only and does not predict or
370 38 3.4 per year
(5%+ Loss) depict the performance of any investment. Past performance
“Moderate” Corrections does not guarantee future results.
120 105 1.1 per year
(10%+ Loss) 1. As of 12/31/08, these market declines/corrections were ongoing.
“Severe” Corrections Therefore, data related to “Average Length” and “Frequency” are
59 210 1 every 2 years subject to change.
(15%+ Loss)
“Bear” Markets
1234
32 369 1 every 3 years
(20%+ Loss)
Shares of Oppenheimer funds are not deposits or obligations of any bank, are not guaranteed by any bank, are
not insured by the FDIC or any other agency, and involve investment risks, including the possible loss of the
principal amount invested.