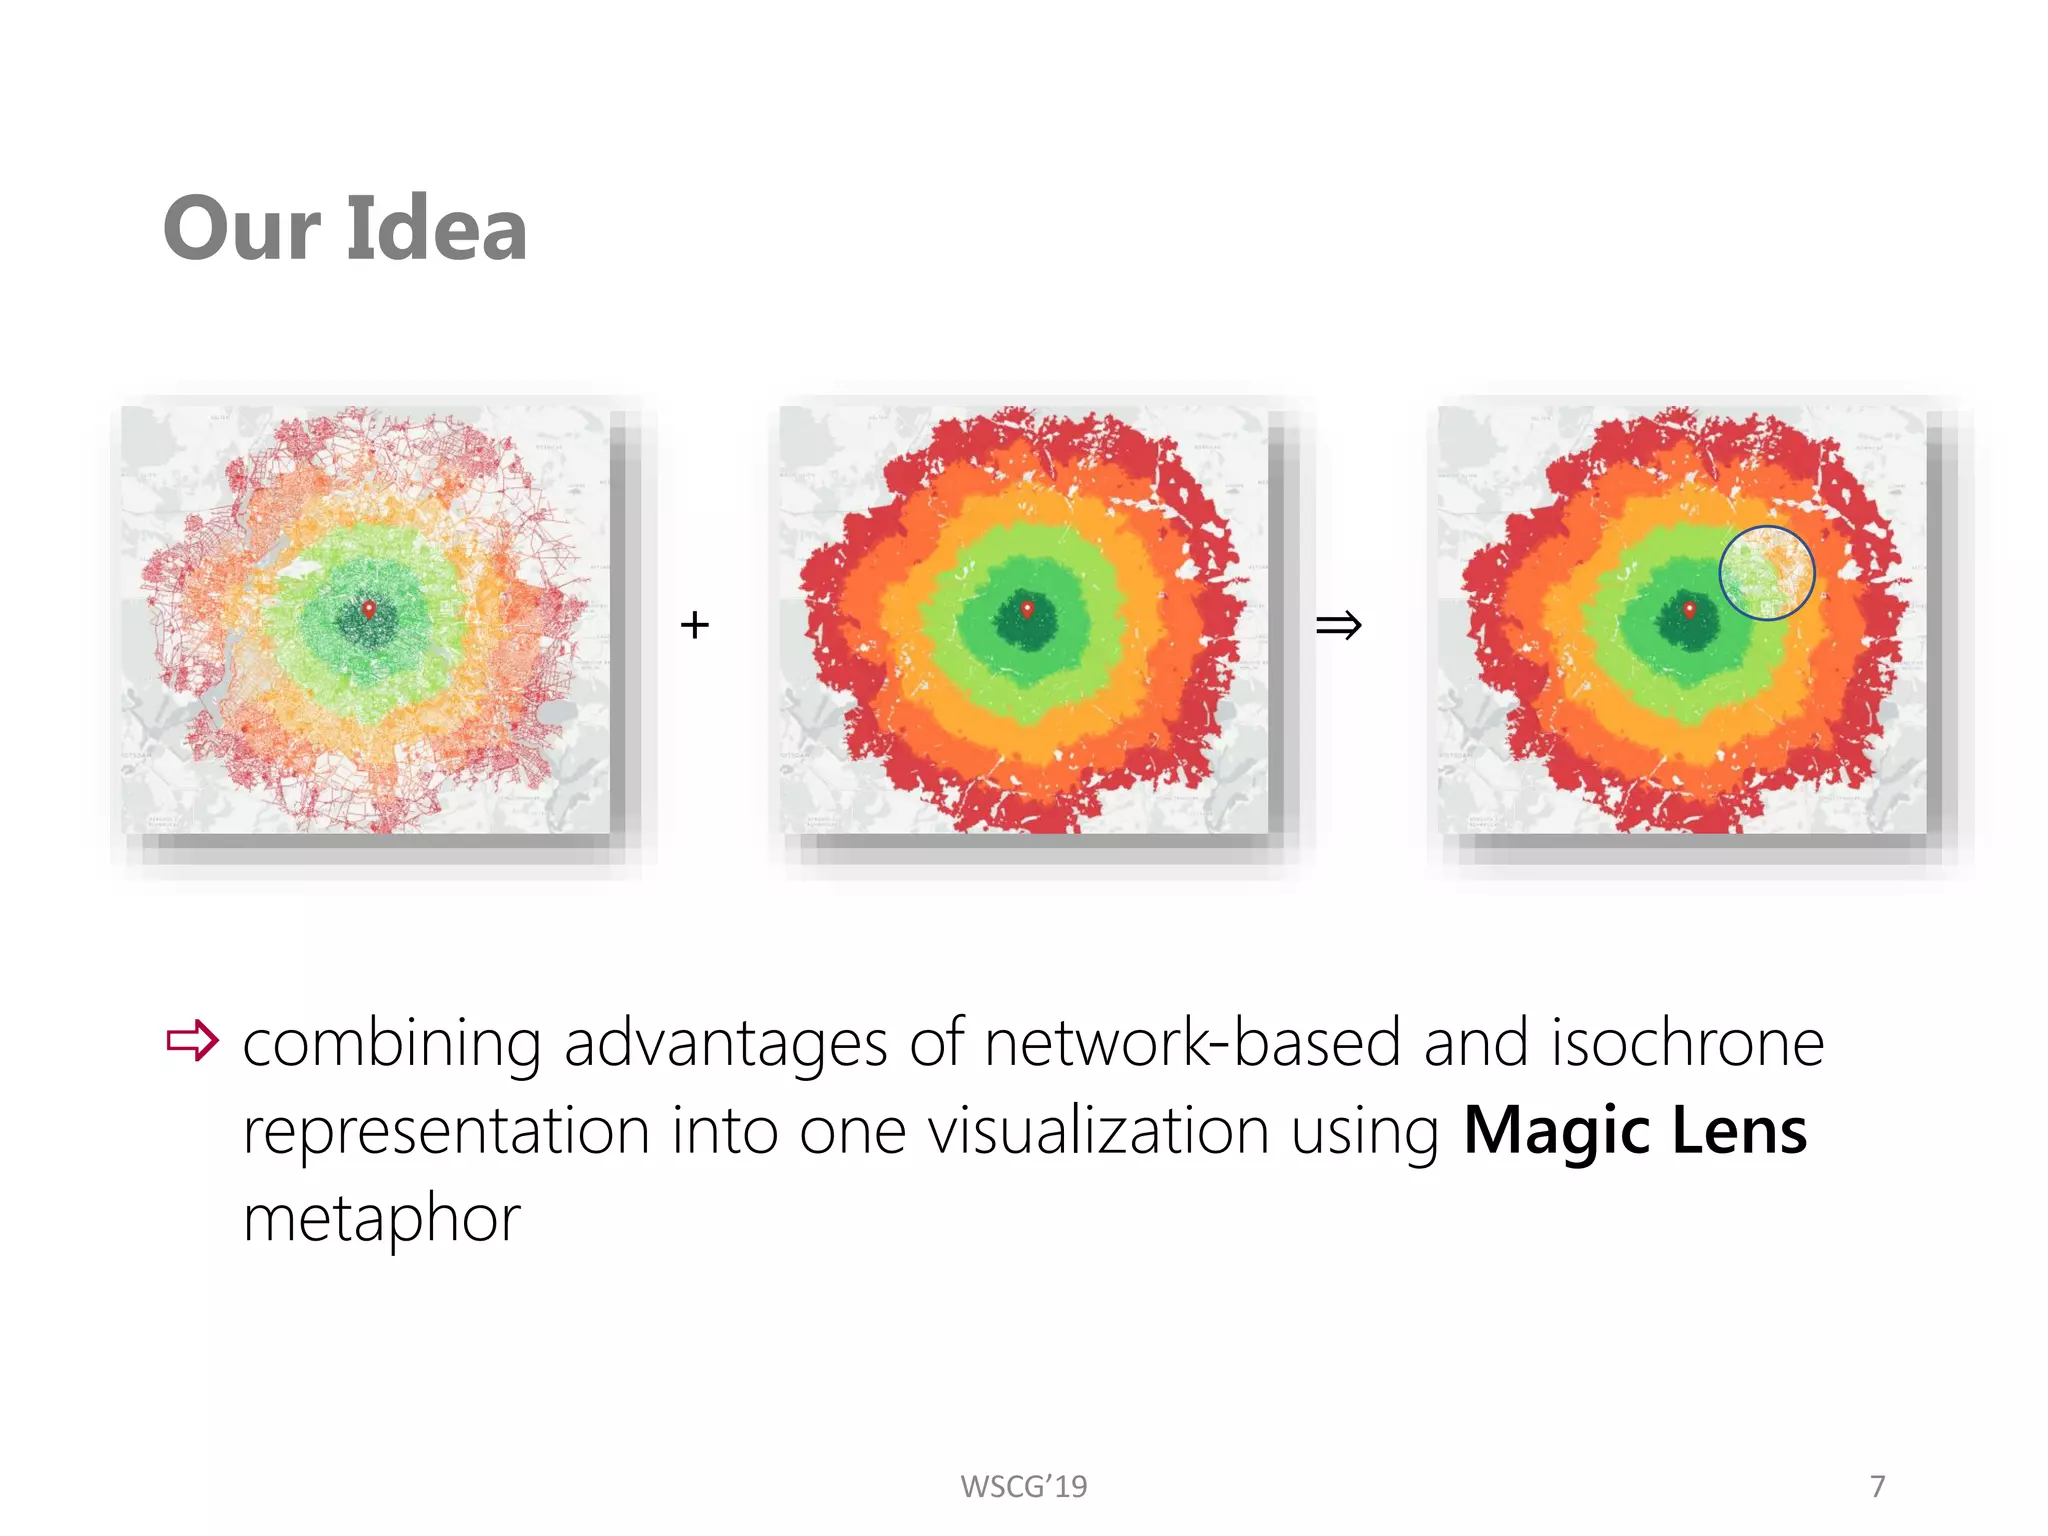
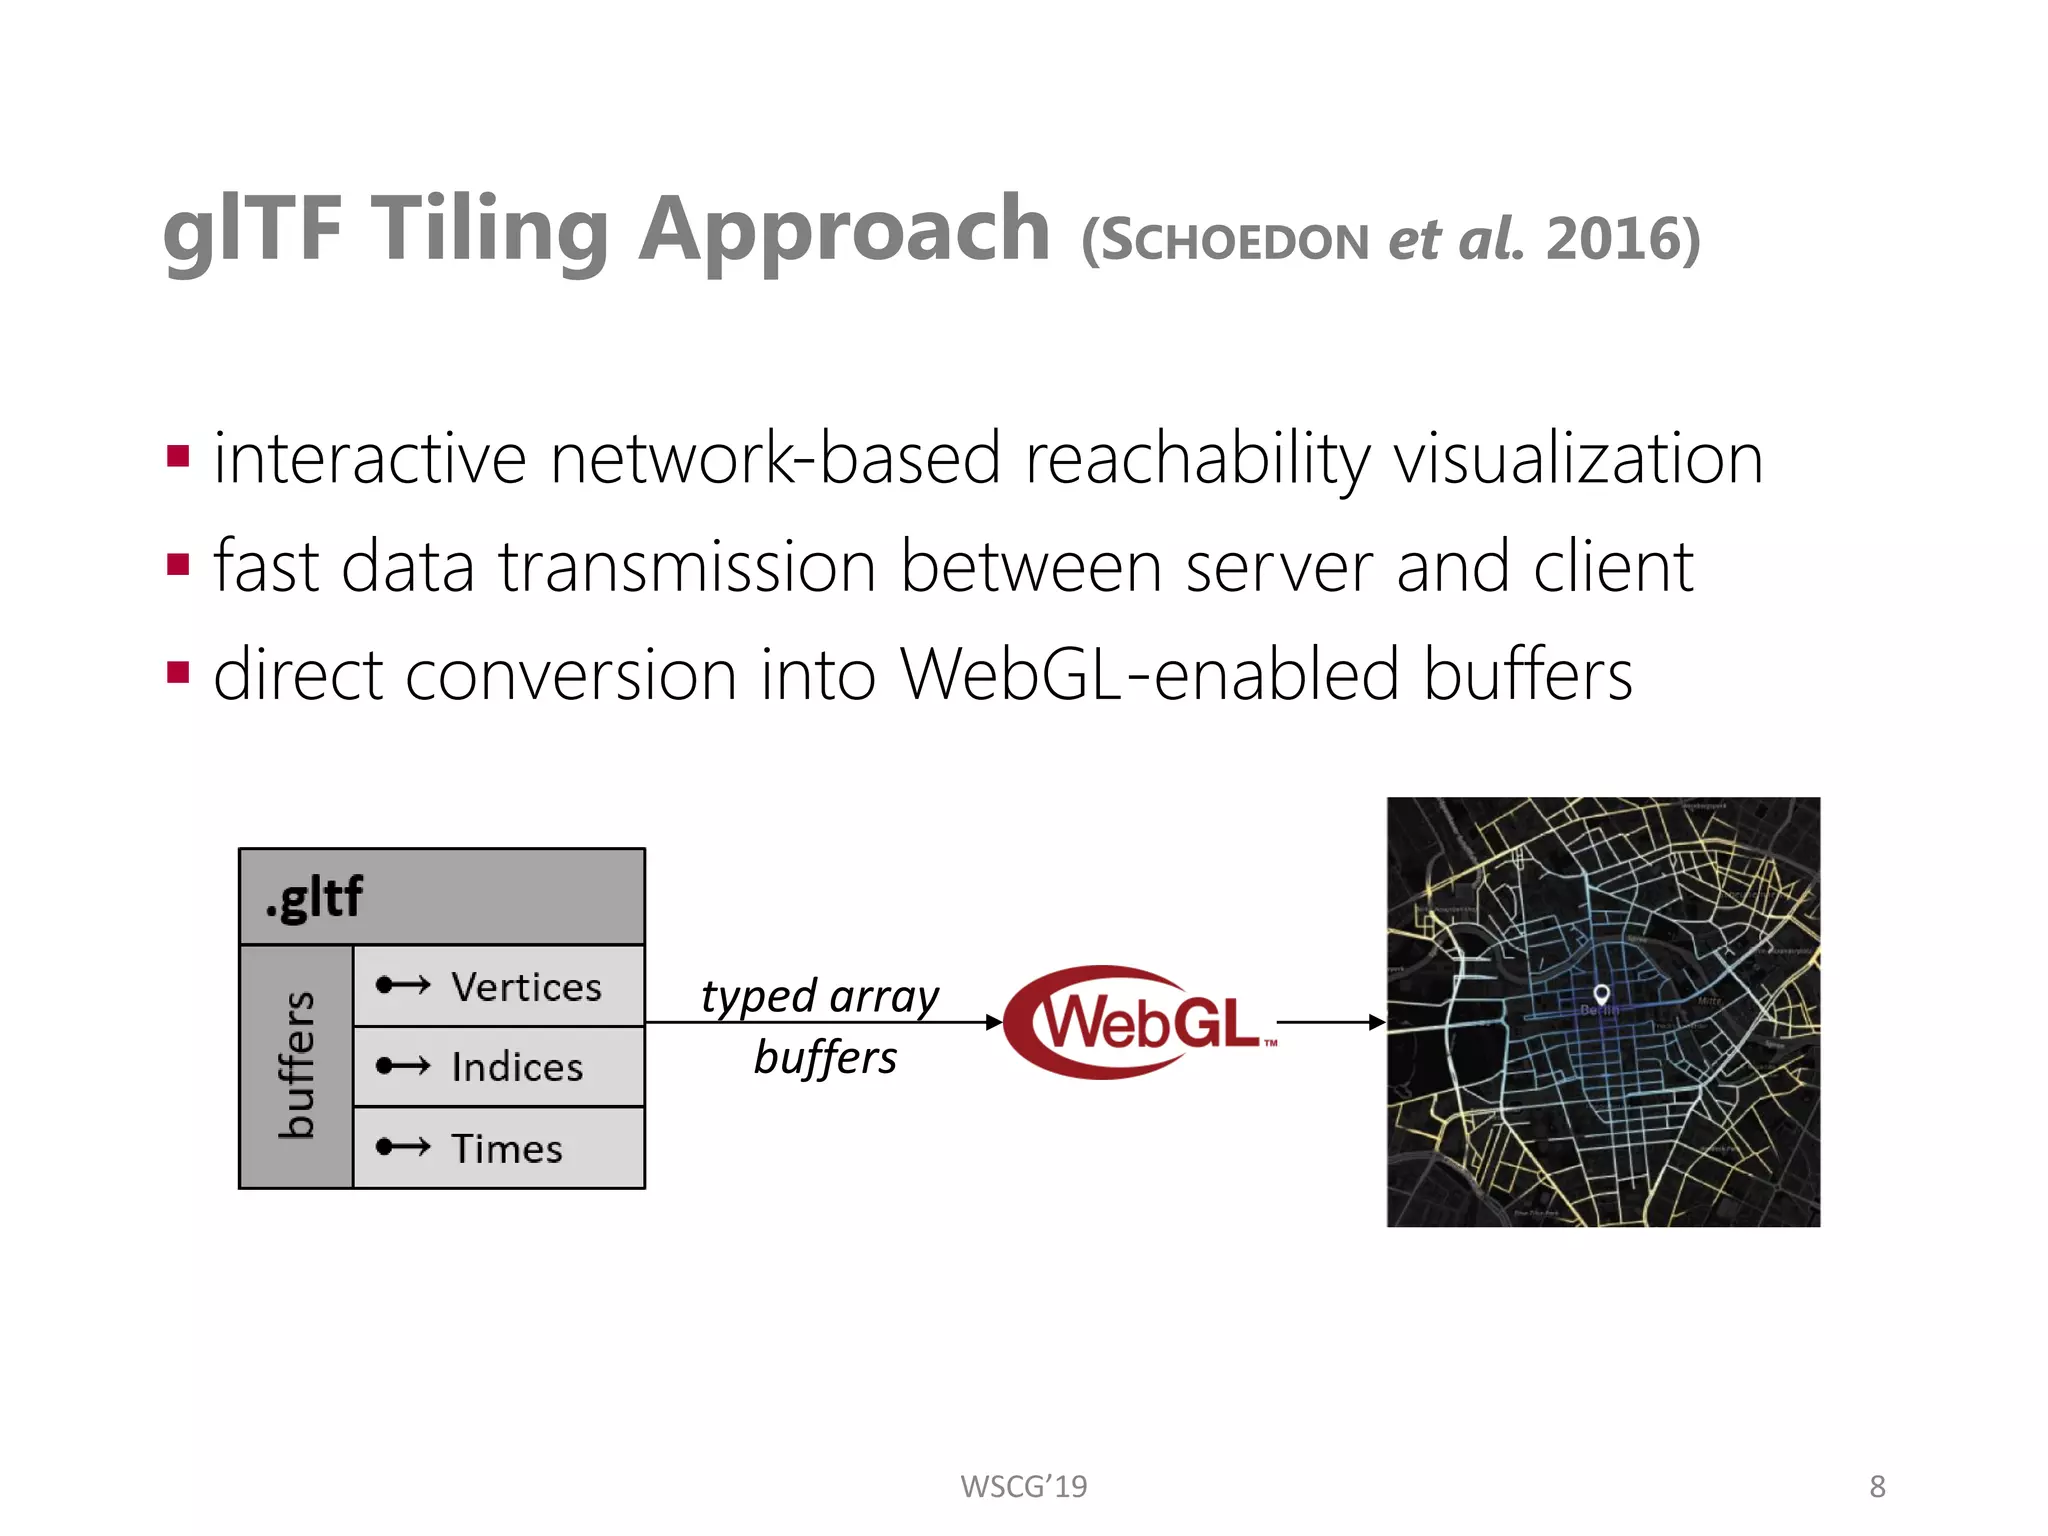
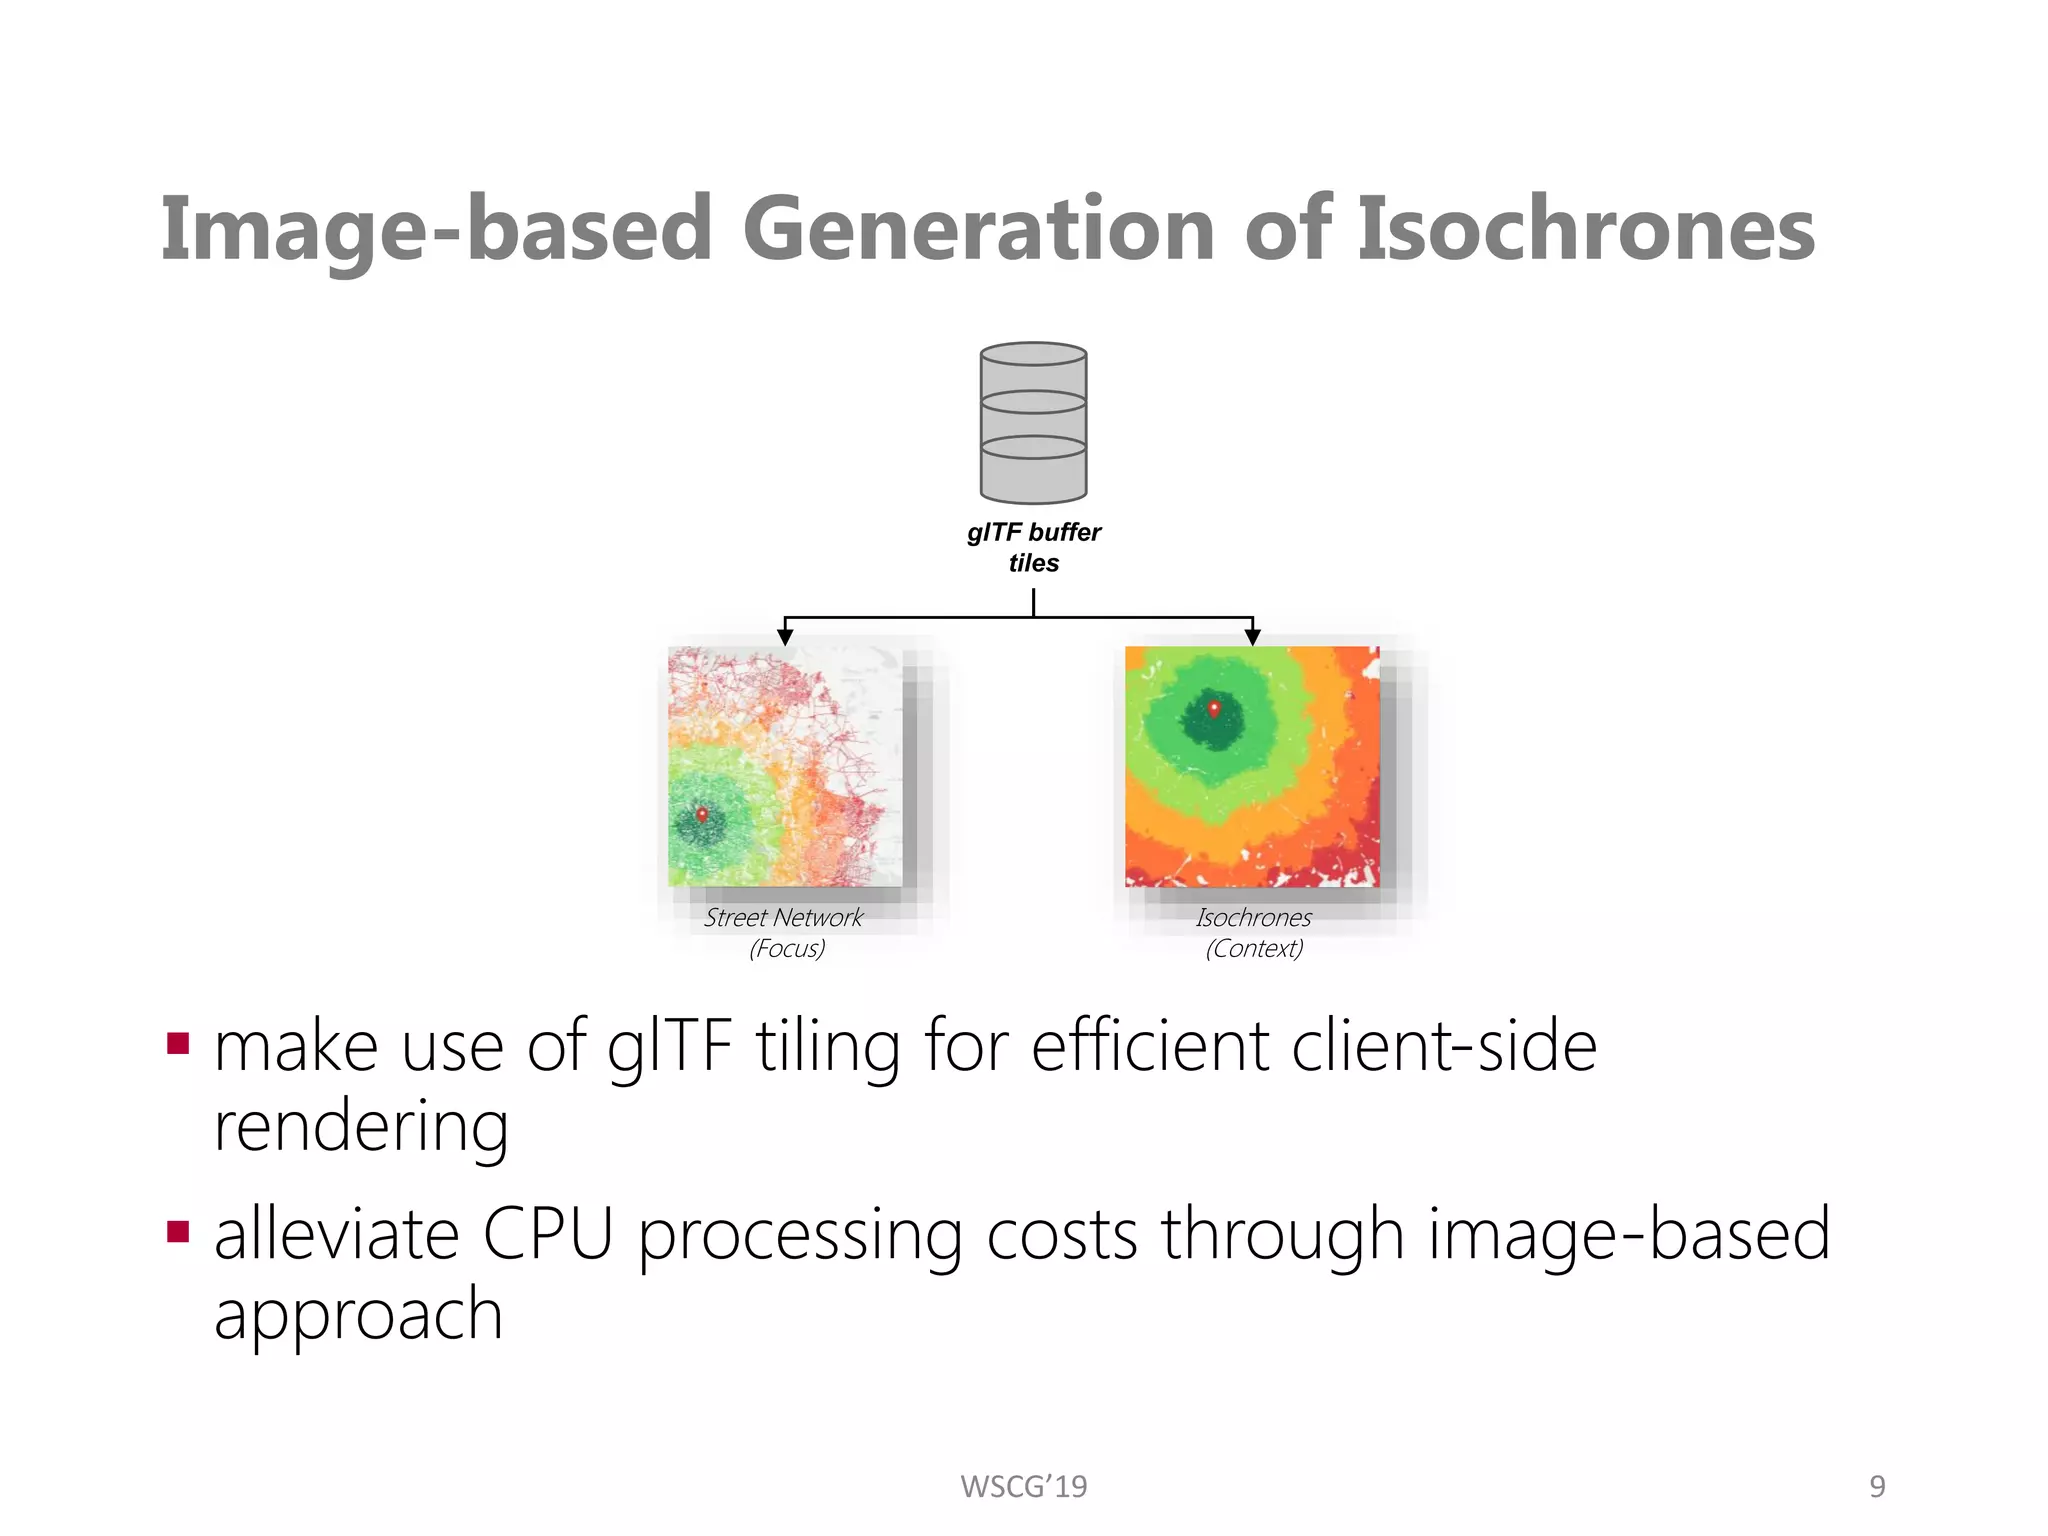
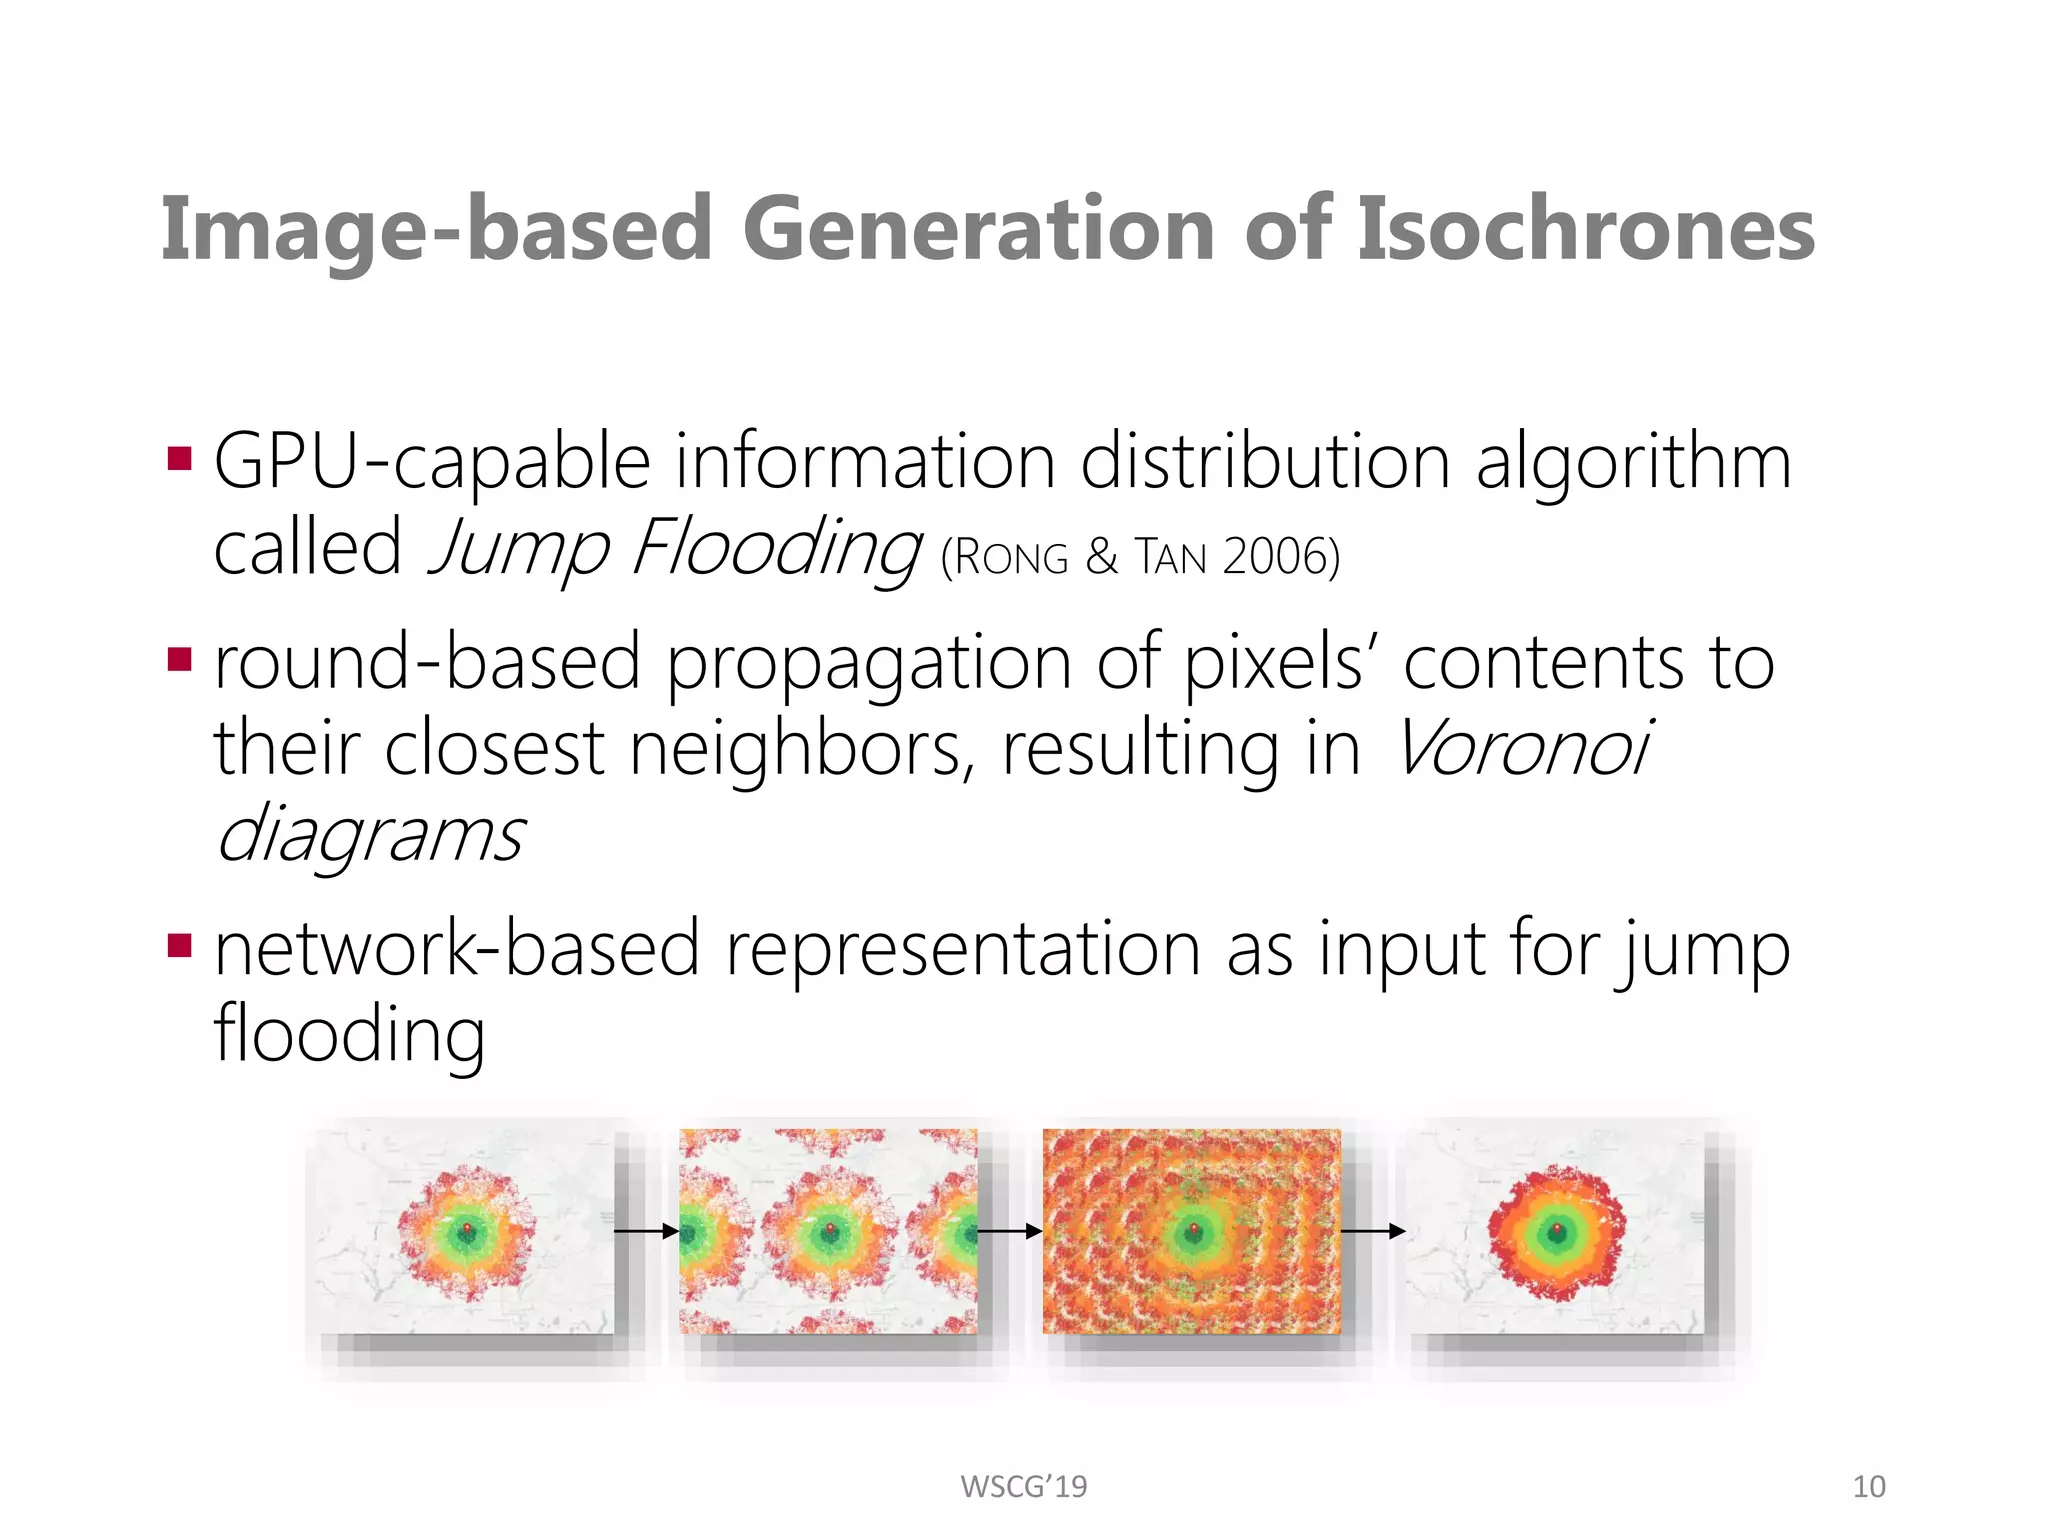
Lens-based Focus+Context
Visualization Techniques
for Interactive Exploration of Web-
based Reachability Maps
WSCG’19, Plzeň
28 May 2019
Marc Listemann [marc.Listemann@dlr.de]
Matthias Trapp [trapp@hpi.de]
Jürgen Döllner [doellner@hpi.de]
Reachability Maps – Fundamentals
▪ reachability analysis as a part of mobility analytics (navigation, geo-
statistics, …)
▪ visualize travel times from one or more locations to every node
inside the network
▪ highly demanded analysis tool for increasing number of applications
(location analysis, urban planning, business intelligence…)
2
mapbox
2017
mapnificent
2017
Motion
Intelligence,
2017
WSCG’19
Reachability Maps – Fundamentals
▪ solves Single Source Shortest Path (SSSP) problem (“one-to-many”)
▪ computes all shortest paths between 𝑉𝑂 and every other node in the
network graph 𝐺 = (𝑉, 𝐸) on the basis of weighted edges 𝐸
▪ results in travel times for every node, representing the potential of
transport medium at 𝑉𝑂 to reach these nodes
3
WSCG’19
Reachability Maps –
Visualization Approaches
4
isochronal maps
Motion
Intelligence
|
Route360°
principle:
▪ isochrones (lines or areas of equal
travel time)
▪ generalized polygons derived from
attributed network
▪ travel time encoded by color
▪ fast and intuitive interpretation of the map
limitations:
▪ detailed representation of RoI
▪ risk of misinterpretation due to
generalization
WSCG’19
Reachability Maps –
Visualization Approaches
5
principle:
▪ travel time mapped directly onto
street network by color
▪ highly detailed representation
limitations:
▪ obtaining fast overview of whole
content
▪ interpretative difficulties at low zoom
levels
network-based maps
S
CHOEDON
et
al.,
2016
WSCG’19
Requirements
How can reachability be represented alternatively to
enable users extract relevant information more
effectively and efficiently?
appropriate visualization for detailed and compact
representation of reachability data in one display
real-time responding application for custom user
interaction
alternative isochrone generation method for reduced
data processing effort
6
WSCG’19
Our Idea
 combining advantages of network-based and isochrone
representation into one visualization using Magic Lens
metaphor
7
+ ⇒
WSCG’19
glTF Tiling Approach (SCHOEDON et al. 2016)
▪ interactive network-based reachability visualization
▪ fast data transmission between server and client
▪ direct conversion into WebGL-enabled buffers
8
typed array
buffers
WSCG’19
Image-based Generation of Isochrones
▪ make use of glTF tiling for efficient client-side
rendering
▪ alleviate CPU processing costs through image-based
approach
9
WSCG’19
glTF buffer
tiles
Street Network
(Focus)
Isochrones
(Context)
Image-based Generation of Isochrones
▪ GPU-capable information distribution algorithm
called Jump Flooding (RONG & TAN 2006)
▪ round-based propagation of pixels’ contents to
their closest neighbors, resulting in Voronoi
diagrams
▪ network-based representation as input for jump
flooding
10
WSCG’19
Jump Flooding Adaptation
▪ propagate travel time in the course of the algorithm to
allow for interactive stylization
▪ RGBA 32bit float precision textures
11
X v tt
Y
x coordinate of
closest seed point
y coordinate of
closest seed point
travel time
has pixel already
been set?
WSCG’19
Jump Flooding Implementation –
“Ping-Pong” Textures
▪ FBO attachments for offscreen rendering
▪ “ping-pong” textures switching read-from and write-to roles
12
swap
buffers
FBO-attached
render target
read texture write texture
fragment shading
sampler2D
let FBO = gl.createFramebuffer();
gl.bindFramebuffer(gl.FRAMEBUFFER, FBO);
gl.framebufferTexture2D(gl.FRAMEBUFFER, gl.COLOR_ATTACHMENT0, gl.TEXTURE_2D, readTexture, 0);
JS
WSCG’19
Jump Flooding – Result
13
rendered result of final jump flooding
step (travel time values of α-channel)
WSCG’19
Color Mapping
▪ obtaining final color by mapping travel time values to a specific color ramp
▪ GPU-enabled slider function for smooth transitions and user-specified
adjustment of travel time
▪ clamping of travel time values through requesting a higher maximum travel time
14
1D color ramp texture
vec4 jf_result = texture2D(u_JumpFloodTexture, texCoords);
if (jf_result.w * 2.0 < 0.0 || jf_result.w * 2.0 > u_SliderParameter) {
discard; // refers to clearColor set in JS
}
else {
vec4 rampColor = texture2D(u_ColorRamp, vec2(abs(jf_result.w), 0.5));
gl_FragColor = vec4(rampColor.rgb, rampColor.a * 0.8);
}
GLSL ES
WSCG’19
Magic Lens – Functionality
▪ interactive observation of different visual appearances of data
▪ full control over region of interest
▪ lens shape to determine pixel area to render Focus texture to
15
canvas
Focus
Texture
Context
Texture
RAM
Focus texture object
Context texture object
WSCG’19
Magic Lens – Types
16
Mouse Lens Marker Lens Isochronal Lens
WSCG’19
Overview of Concept
WSCG’19 17
enabled frontend
glTF
buffer
data
user interaction
F+C
Visualization
Network Texture Isochrone
Texture
Mask Texture Final Rendering
Network
Rendering
Stage
Isochrone
Generation
Stage
Mask
Generation
Stage
Color Mapping
and
Compositing
Stage
Color Maps
Evaluation of Isochrones
▪ jump flooding related issues concerning
readability and accuracy
18
unfiltered travel time data, causing
large amount of gaps
pre-filtering of travel time to enable the
JFA to flood into ‘invalid cells’
WSCG’19
Evaluation of Isochrones
▪ visual comparison of image-based and geometry-
based approach
19
WSCG’19
Performance Measurement
▪ measurement of rendering performance (WebGL draw
calls of separate rendering passes and jump flooding in
particular)
▪ dependency of jump flooding of the device’s resolution
20
jump flooding rendering performance comparison of different rendering passes
WSCG’19
Limitations
▪ perceptive difficulties for street segments at low zoom levels 
fish-eye or magnification lenses
▪ interpretative errors due to implicit cartographic generalization
of Voronoi diagrams
▪ streaks during asynchronous image composition (tiling
principle)
▪ anticipation of ROIs critical due to purpose of
reachability maps
21
WSCG’19
Conclusions
▪ detailed view on geographic reachability data inside a user-controlled
lens without losing the overview
▪ fast GPU-supported isochrone rendering on the basis of glTF tiles
without the need to compute generalized polygons on the CPU
▪ adequate alternative to geometry-based isochrones due to higher
accuracy and visual resemblance
▪ highly interactive and real-time responding web application
22
WSCG’19
Thank you!
WSCG’19 23
This work was funded by the Federal Ministry of Education
and Research (BMBF), Germany within the “MOBIE” project
(www.mobie-project.de).

Lens-based Focus+Context Visualization Techniques

  • 1.
    Lens-based Focus+Context Visualization Techniques forInteractive Exploration of Web- based Reachability Maps WSCG’19, Plzeň 28 May 2019 Marc Listemann [marc.Listemann@dlr.de] Matthias Trapp [trapp@hpi.de] Jürgen Döllner [doellner@hpi.de]
  • 2.
    Reachability Maps –Fundamentals ▪ reachability analysis as a part of mobility analytics (navigation, geo- statistics, …) ▪ visualize travel times from one or more locations to every node inside the network ▪ highly demanded analysis tool for increasing number of applications (location analysis, urban planning, business intelligence…) 2 mapbox 2017 mapnificent 2017 Motion Intelligence, 2017 WSCG’19
  • 3.
    Reachability Maps –Fundamentals ▪ solves Single Source Shortest Path (SSSP) problem (“one-to-many”) ▪ computes all shortest paths between 𝑉𝑂 and every other node in the network graph 𝐺 = (𝑉, 𝐸) on the basis of weighted edges 𝐸 ▪ results in travel times for every node, representing the potential of transport medium at 𝑉𝑂 to reach these nodes 3 WSCG’19
  • 4.
    Reachability Maps – VisualizationApproaches 4 isochronal maps Motion Intelligence | Route360° principle: ▪ isochrones (lines or areas of equal travel time) ▪ generalized polygons derived from attributed network ▪ travel time encoded by color ▪ fast and intuitive interpretation of the map limitations: ▪ detailed representation of RoI ▪ risk of misinterpretation due to generalization WSCG’19
  • 5.
    Reachability Maps – VisualizationApproaches 5 principle: ▪ travel time mapped directly onto street network by color ▪ highly detailed representation limitations: ▪ obtaining fast overview of whole content ▪ interpretative difficulties at low zoom levels network-based maps S CHOEDON et al., 2016 WSCG’19
  • 6.
    Requirements How can reachabilitybe represented alternatively to enable users extract relevant information more effectively and efficiently? appropriate visualization for detailed and compact representation of reachability data in one display real-time responding application for custom user interaction alternative isochrone generation method for reduced data processing effort 6 WSCG’19
  • 7.
    Our Idea  combiningadvantages of network-based and isochrone representation into one visualization using Magic Lens metaphor 7 + ⇒ WSCG’19
  • 8.
    glTF Tiling Approach(SCHOEDON et al. 2016) ▪ interactive network-based reachability visualization ▪ fast data transmission between server and client ▪ direct conversion into WebGL-enabled buffers 8 typed array buffers WSCG’19
  • 9.
    Image-based Generation ofIsochrones ▪ make use of glTF tiling for efficient client-side rendering ▪ alleviate CPU processing costs through image-based approach 9 WSCG’19 glTF buffer tiles Street Network (Focus) Isochrones (Context)
  • 10.
    Image-based Generation ofIsochrones ▪ GPU-capable information distribution algorithm called Jump Flooding (RONG & TAN 2006) ▪ round-based propagation of pixels’ contents to their closest neighbors, resulting in Voronoi diagrams ▪ network-based representation as input for jump flooding 10 WSCG’19
  • 11.
    Jump Flooding Adaptation ▪propagate travel time in the course of the algorithm to allow for interactive stylization ▪ RGBA 32bit float precision textures 11 X v tt Y x coordinate of closest seed point y coordinate of closest seed point travel time has pixel already been set? WSCG’19
  • 12.
    Jump Flooding Implementation– “Ping-Pong” Textures ▪ FBO attachments for offscreen rendering ▪ “ping-pong” textures switching read-from and write-to roles 12 swap buffers FBO-attached render target read texture write texture fragment shading sampler2D let FBO = gl.createFramebuffer(); gl.bindFramebuffer(gl.FRAMEBUFFER, FBO); gl.framebufferTexture2D(gl.FRAMEBUFFER, gl.COLOR_ATTACHMENT0, gl.TEXTURE_2D, readTexture, 0); JS WSCG’19
  • 13.
    Jump Flooding –Result 13 rendered result of final jump flooding step (travel time values of α-channel) WSCG’19
  • 14.
    Color Mapping ▪ obtainingfinal color by mapping travel time values to a specific color ramp ▪ GPU-enabled slider function for smooth transitions and user-specified adjustment of travel time ▪ clamping of travel time values through requesting a higher maximum travel time 14 1D color ramp texture vec4 jf_result = texture2D(u_JumpFloodTexture, texCoords); if (jf_result.w * 2.0 < 0.0 || jf_result.w * 2.0 > u_SliderParameter) { discard; // refers to clearColor set in JS } else { vec4 rampColor = texture2D(u_ColorRamp, vec2(abs(jf_result.w), 0.5)); gl_FragColor = vec4(rampColor.rgb, rampColor.a * 0.8); } GLSL ES WSCG’19
  • 15.
    Magic Lens –Functionality ▪ interactive observation of different visual appearances of data ▪ full control over region of interest ▪ lens shape to determine pixel area to render Focus texture to 15 canvas Focus Texture Context Texture RAM Focus texture object Context texture object WSCG’19
  • 16.
    Magic Lens –Types 16 Mouse Lens Marker Lens Isochronal Lens WSCG’19
  • 17.
    Overview of Concept WSCG’1917 enabled frontend glTF buffer data user interaction F+C Visualization Network Texture Isochrone Texture Mask Texture Final Rendering Network Rendering Stage Isochrone Generation Stage Mask Generation Stage Color Mapping and Compositing Stage Color Maps
  • 18.
    Evaluation of Isochrones ▪jump flooding related issues concerning readability and accuracy 18 unfiltered travel time data, causing large amount of gaps pre-filtering of travel time to enable the JFA to flood into ‘invalid cells’ WSCG’19
  • 19.
    Evaluation of Isochrones ▪visual comparison of image-based and geometry- based approach 19 WSCG’19
  • 20.
    Performance Measurement ▪ measurementof rendering performance (WebGL draw calls of separate rendering passes and jump flooding in particular) ▪ dependency of jump flooding of the device’s resolution 20 jump flooding rendering performance comparison of different rendering passes WSCG’19
  • 21.
    Limitations ▪ perceptive difficultiesfor street segments at low zoom levels  fish-eye or magnification lenses ▪ interpretative errors due to implicit cartographic generalization of Voronoi diagrams ▪ streaks during asynchronous image composition (tiling principle) ▪ anticipation of ROIs critical due to purpose of reachability maps 21 WSCG’19
  • 22.
    Conclusions ▪ detailed viewon geographic reachability data inside a user-controlled lens without losing the overview ▪ fast GPU-supported isochrone rendering on the basis of glTF tiles without the need to compute generalized polygons on the CPU ▪ adequate alternative to geometry-based isochrones due to higher accuracy and visual resemblance ▪ highly interactive and real-time responding web application 22 WSCG’19
  • 23.
    Thank you! WSCG’19 23 Thiswork was funded by the Federal Ministry of Education and Research (BMBF), Germany within the “MOBIE” project (www.mobie-project.de).