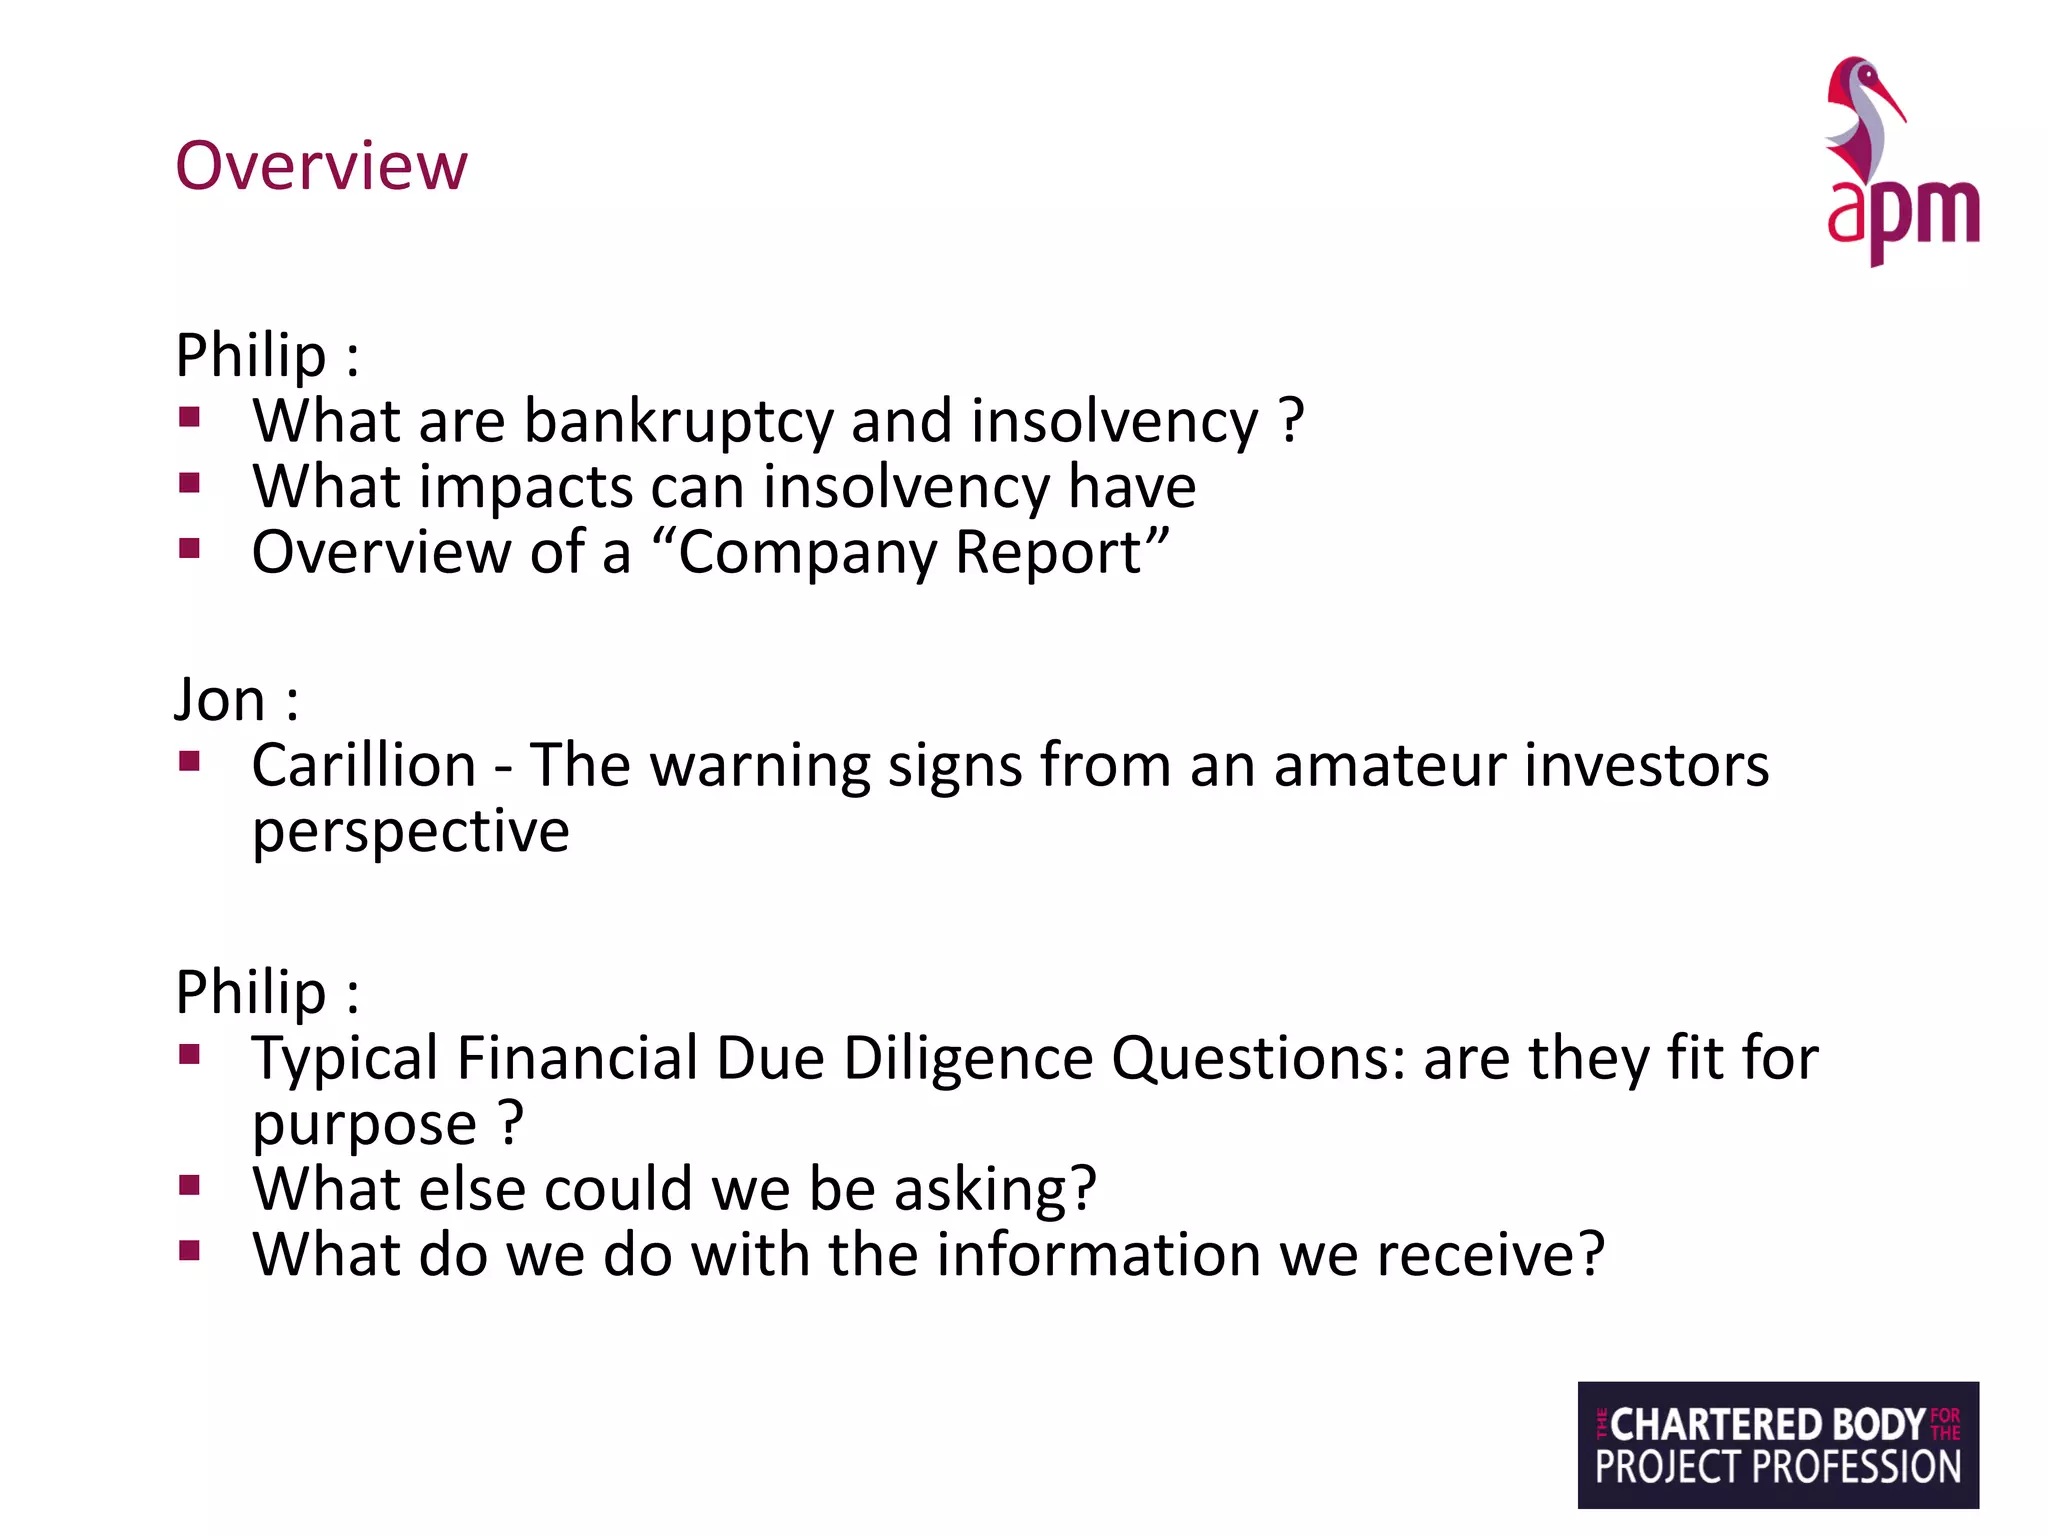
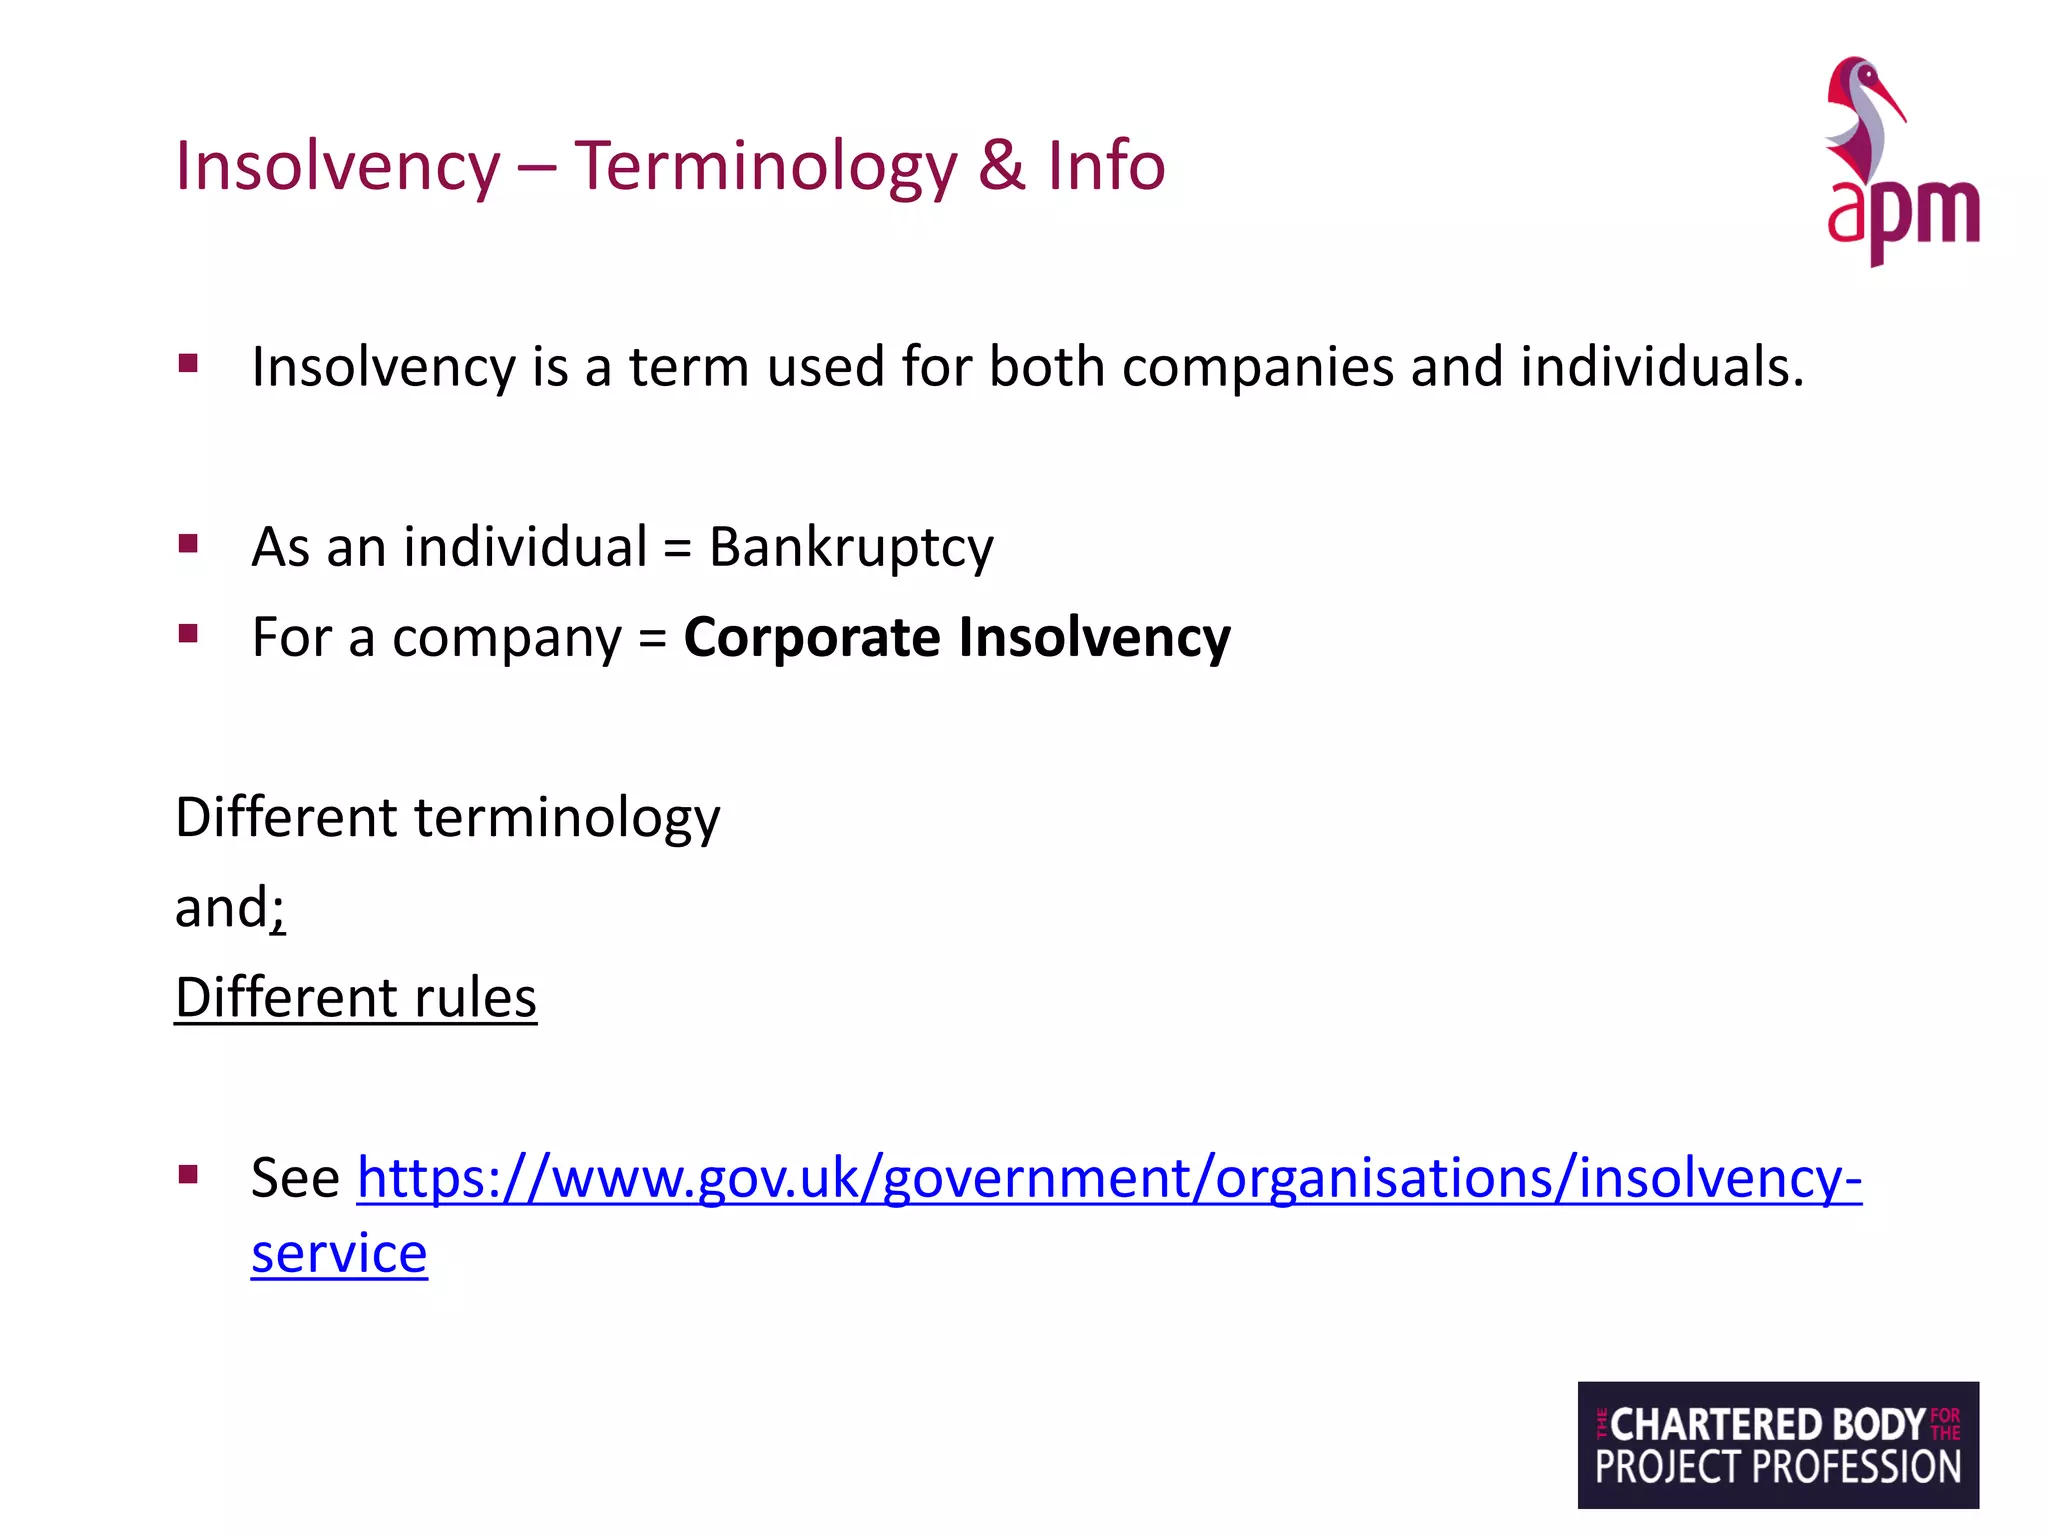
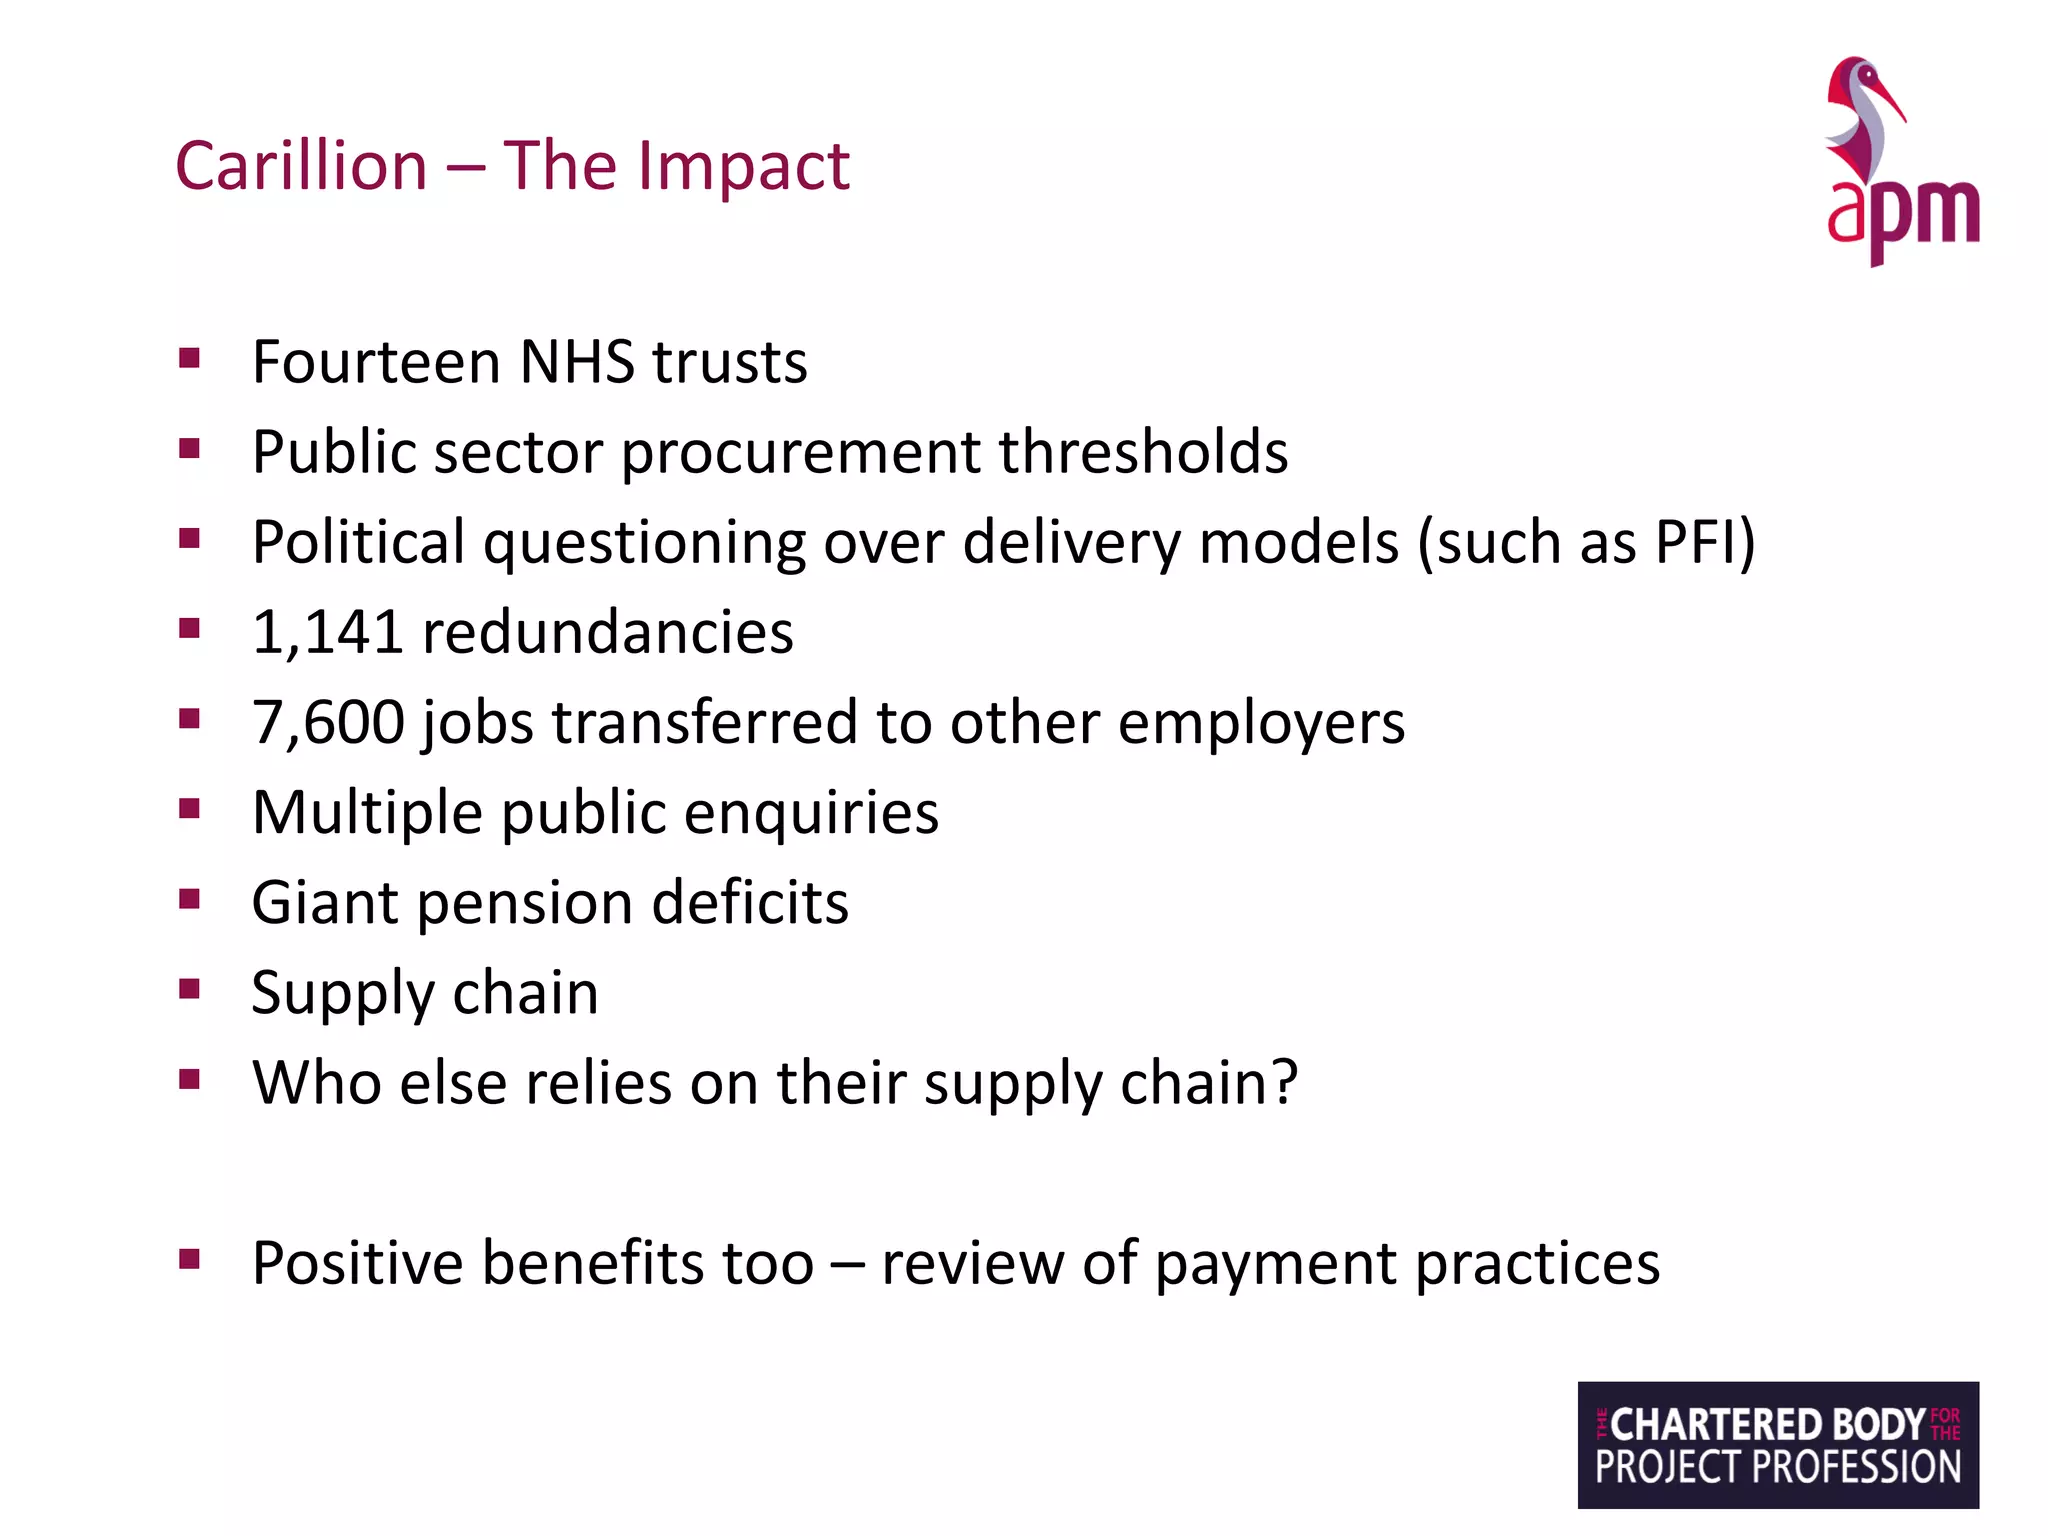
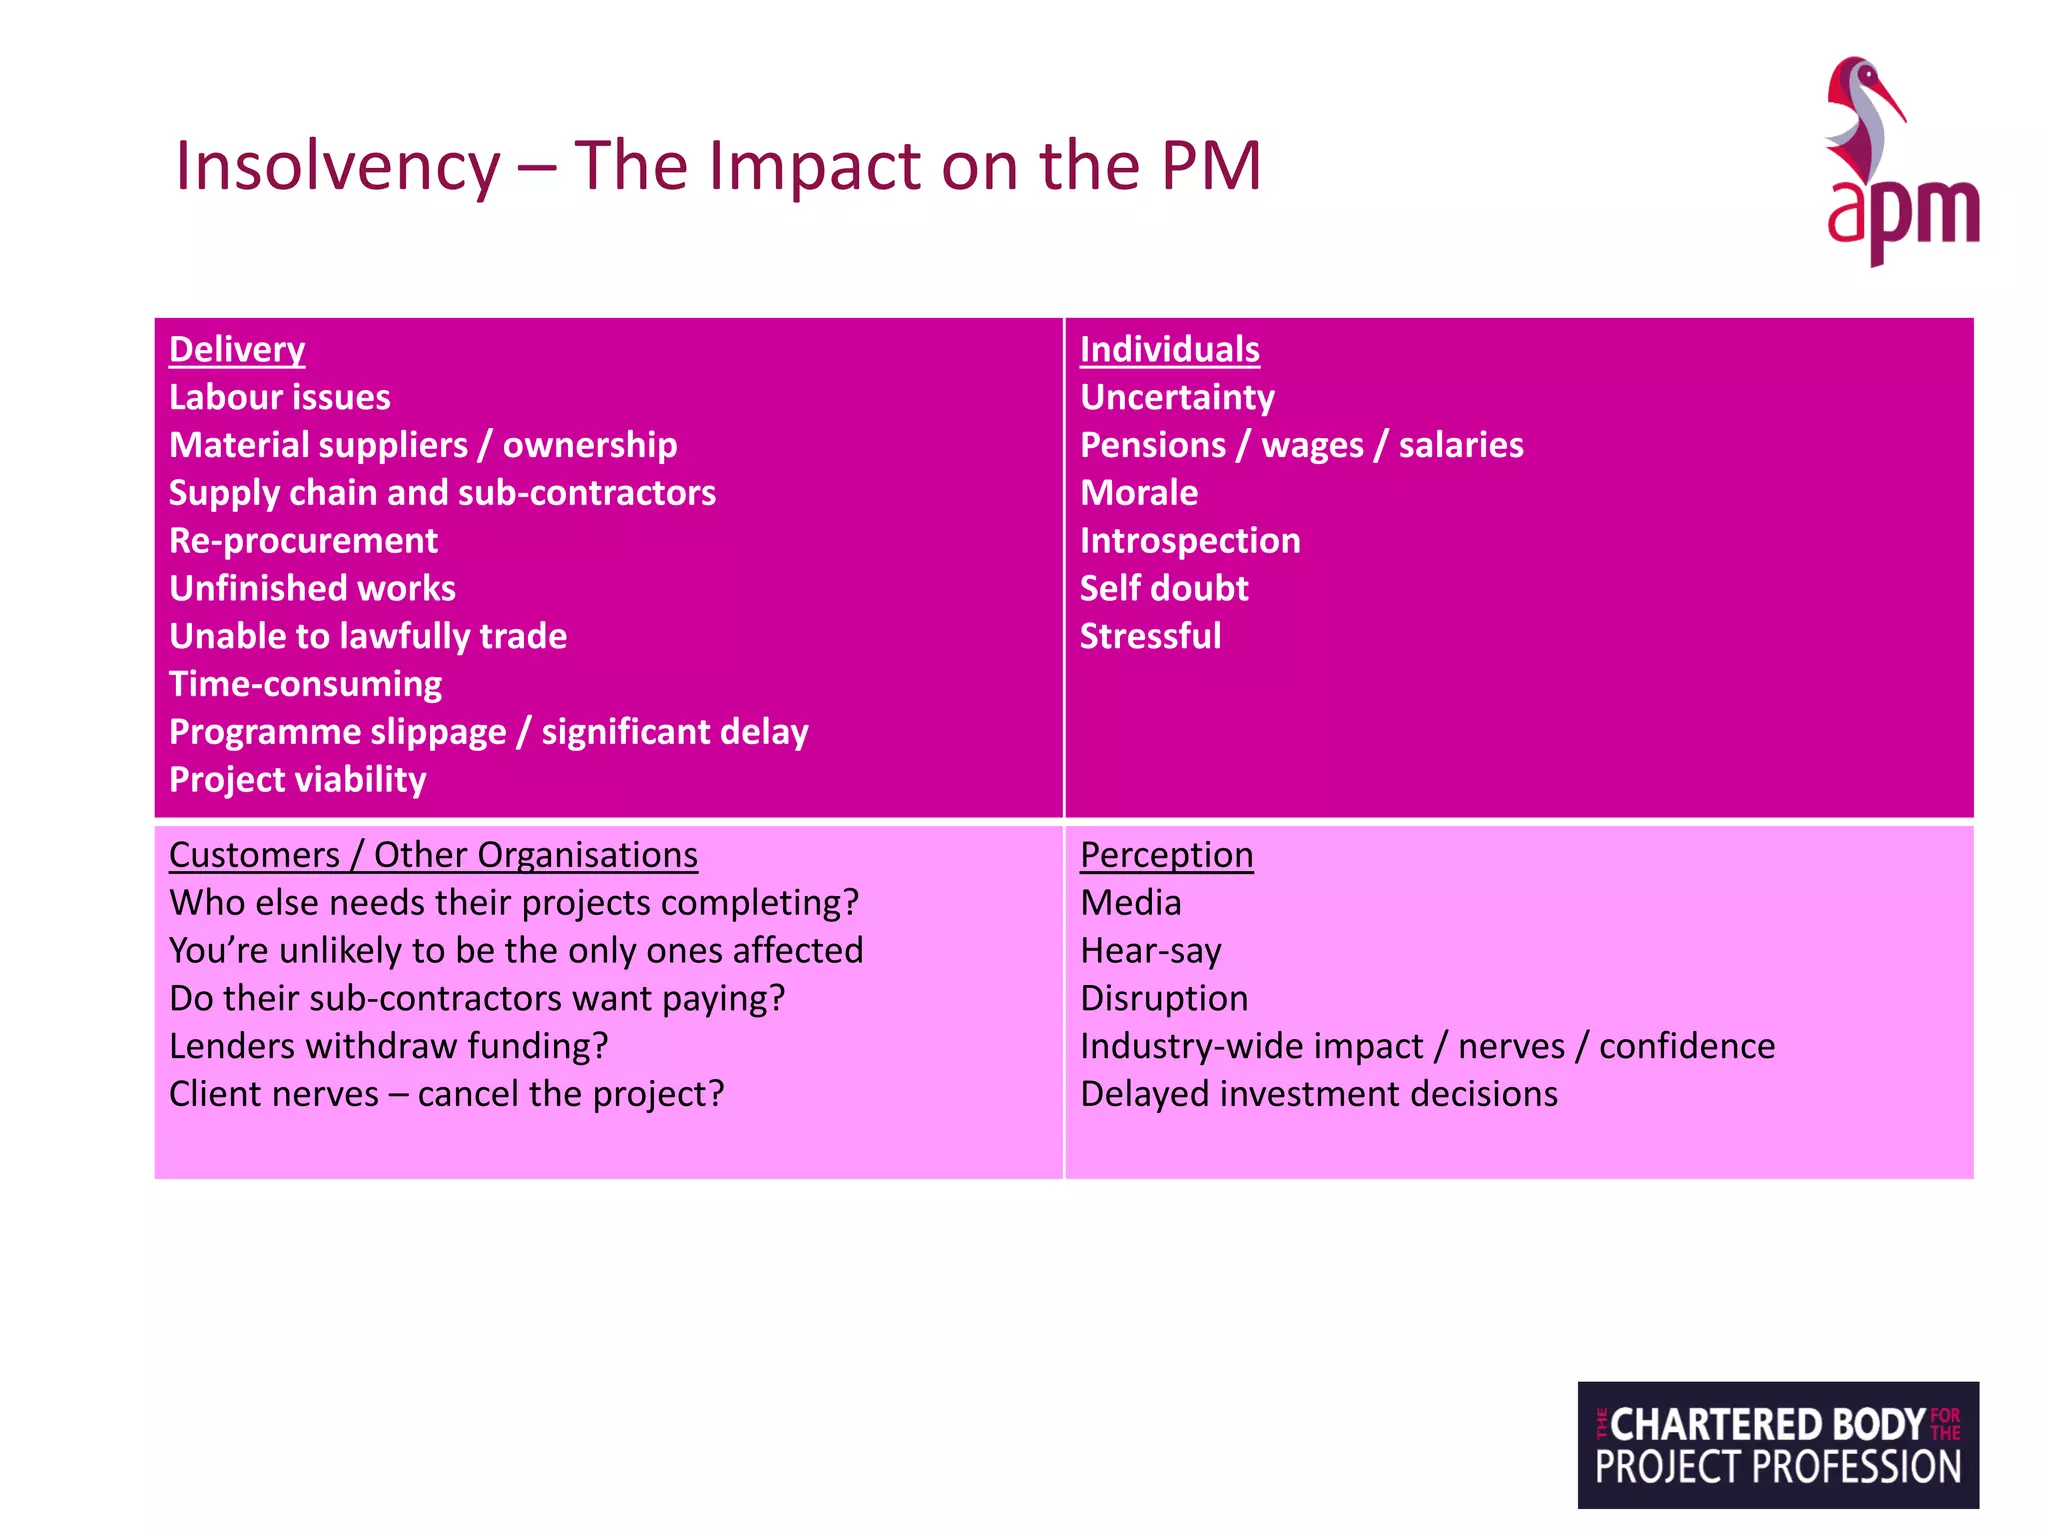
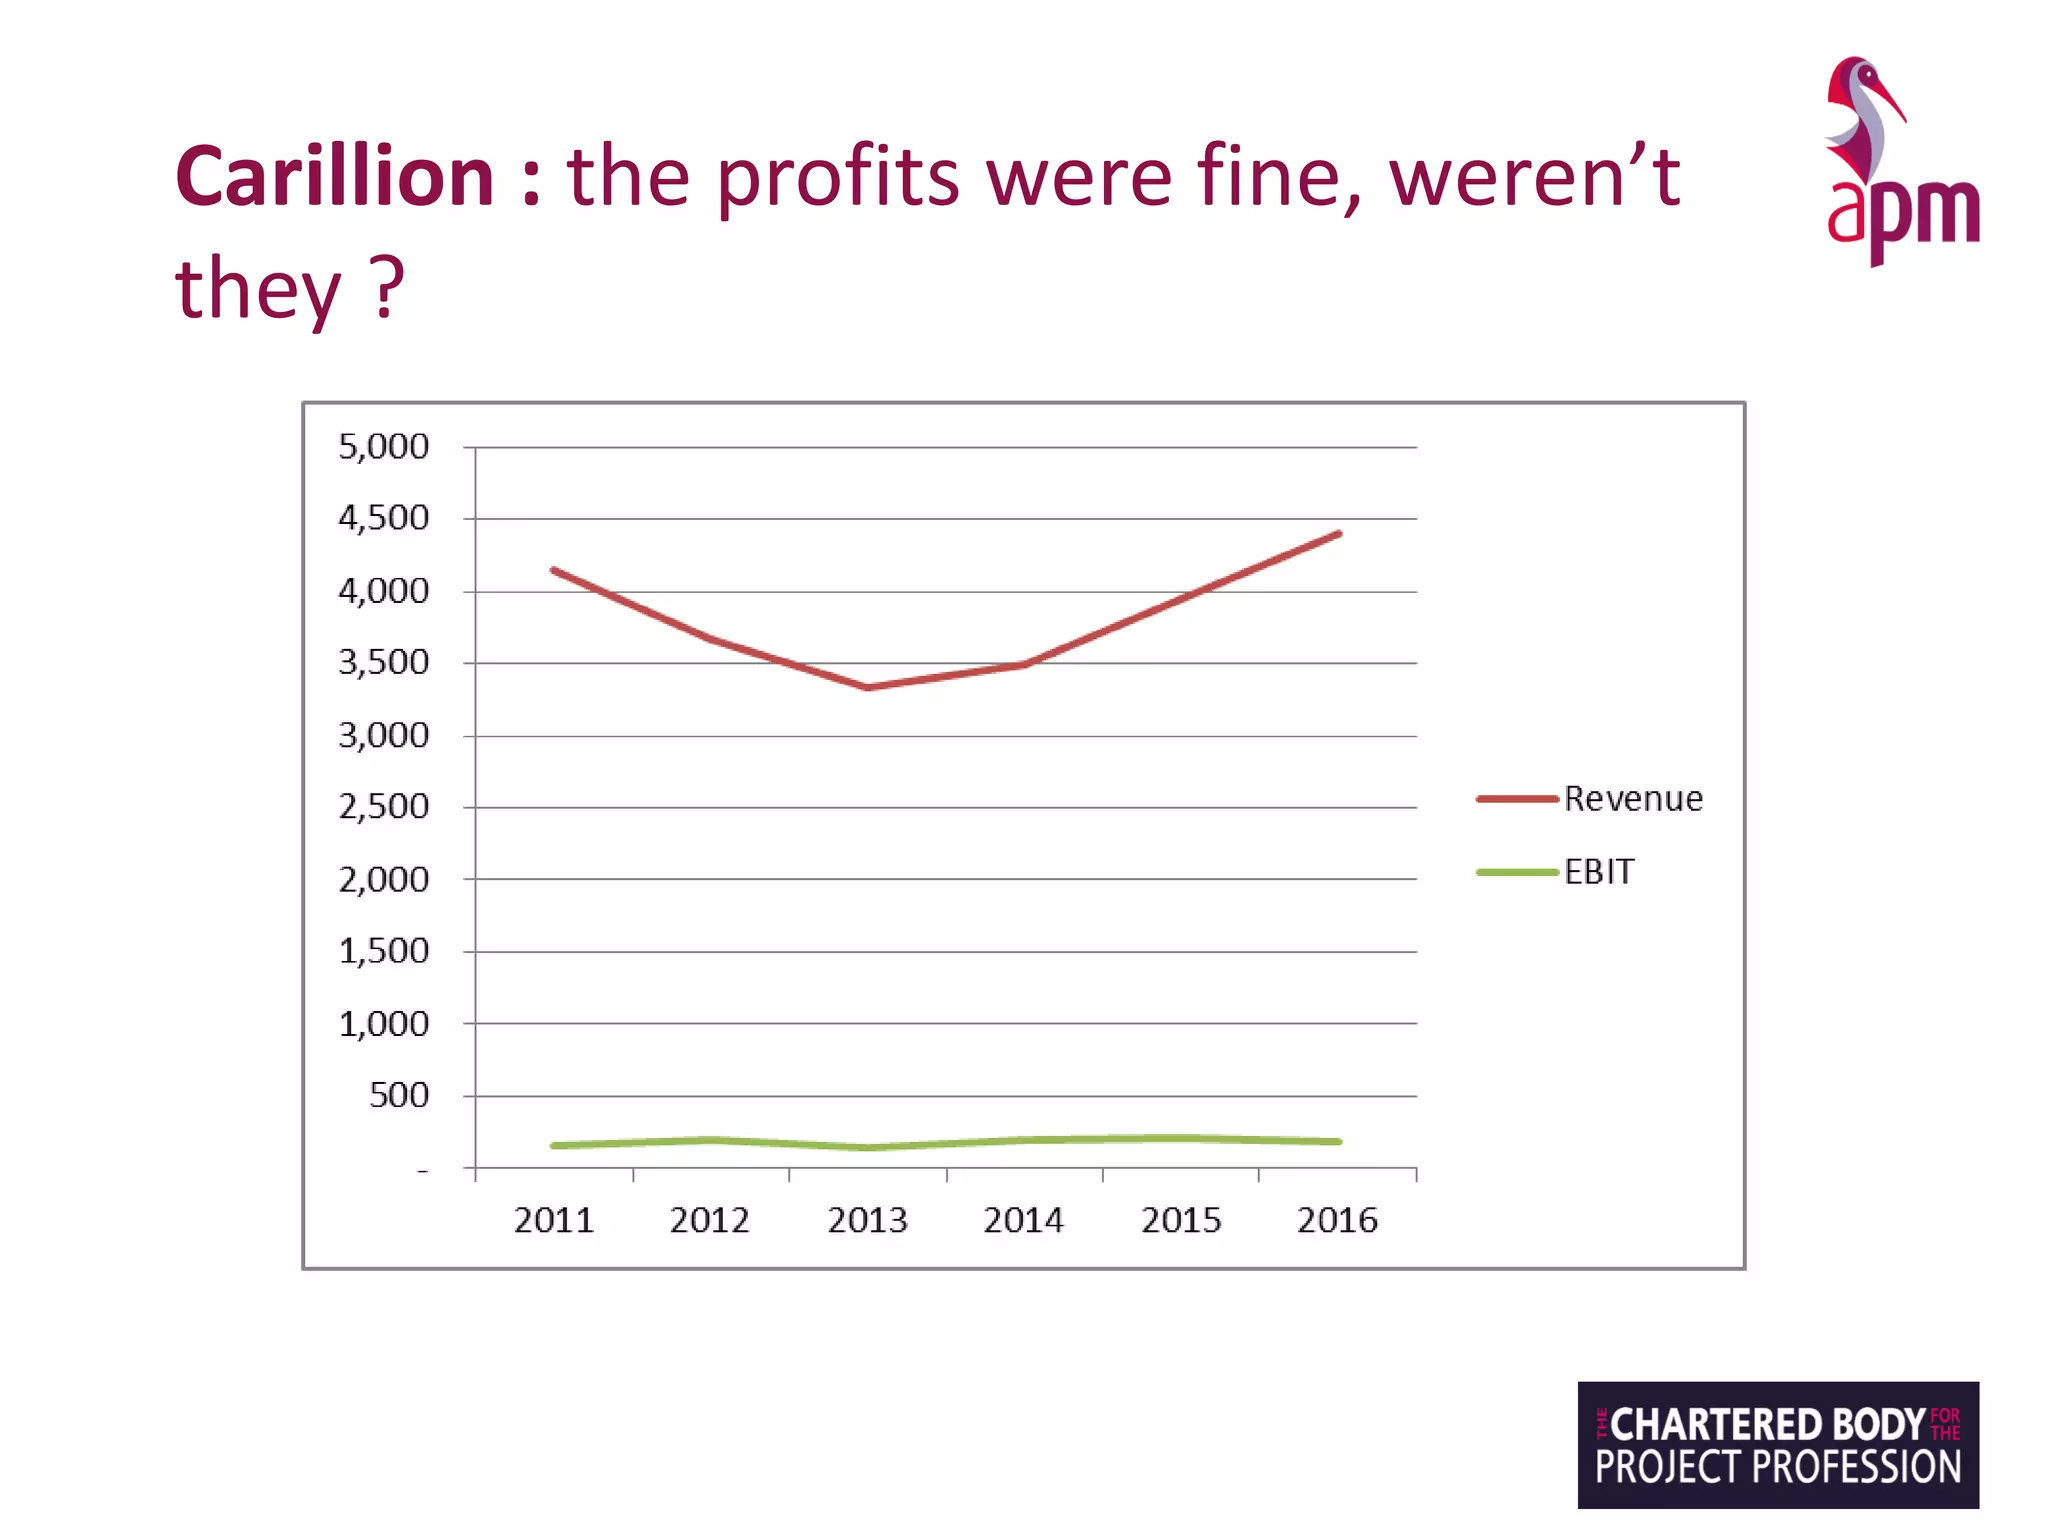
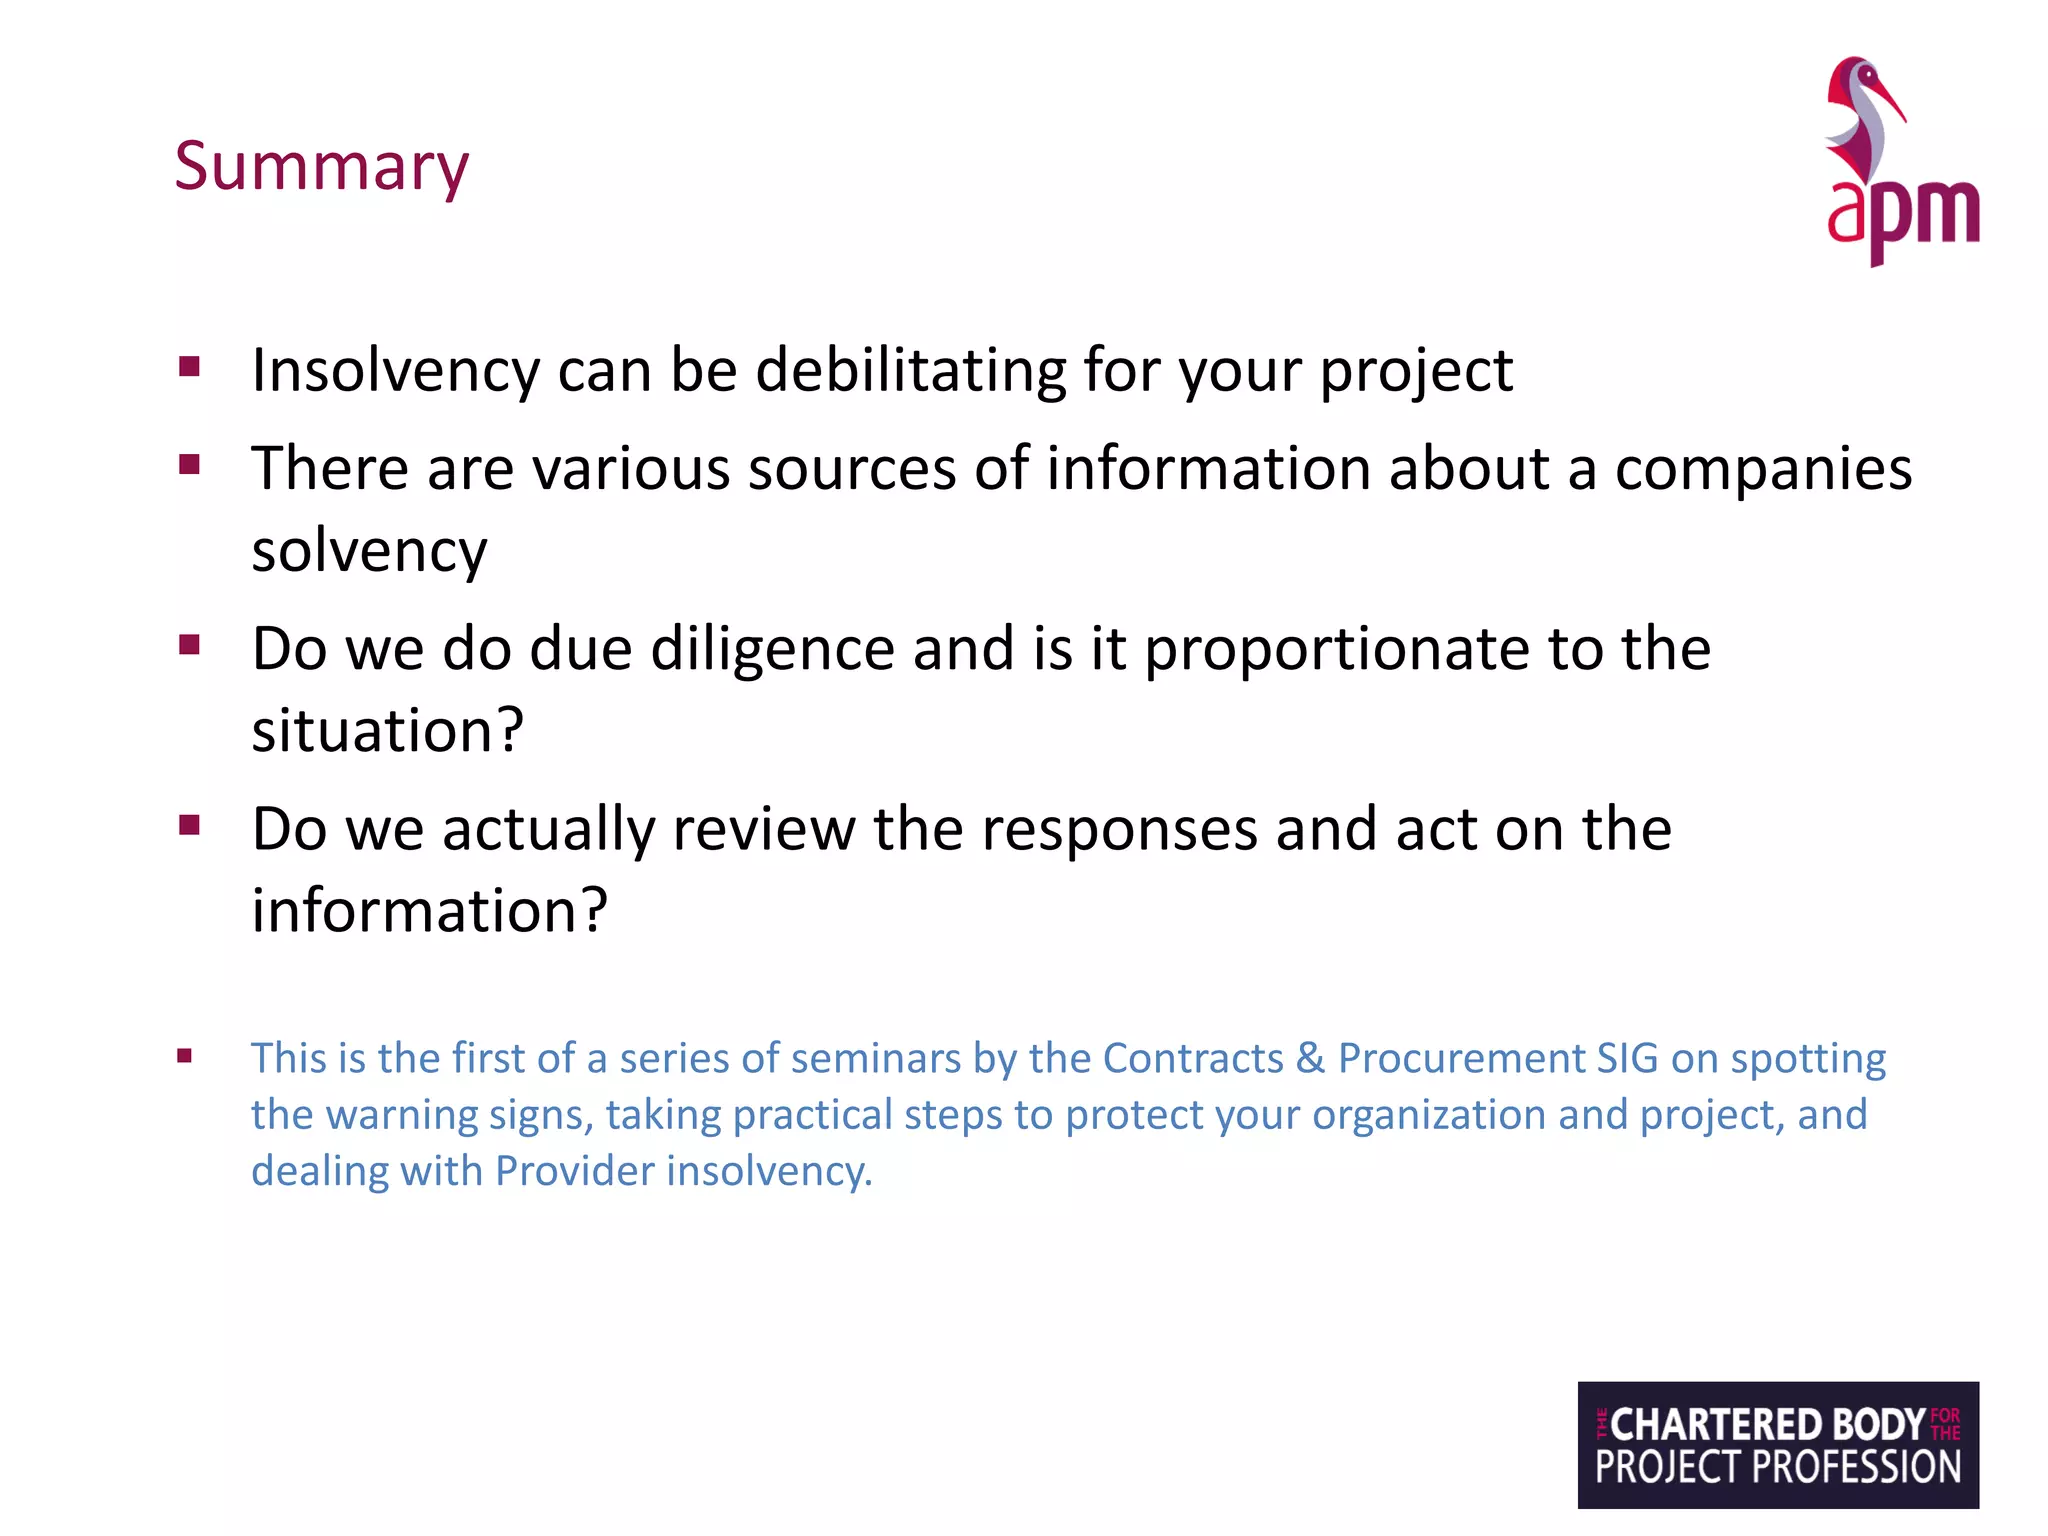
Lessons learnt from the
Carillion collapse part 1:
Selecting a financially sound
provider webinar
Presented by
Philip Reese BSc (Hons) MRICS MAPM MCIPS CBIFM
& Dr Jon Broome BEng PhD MAPM
Series Introduction
Lessons learnt from the Carillion collapse :
▪ Part 1 : Selecting a financially sound Provider.
▪ Part 2 : 10 ways to protect yourself through
the contract – Sarah Schutte – 3 April 2019
▪ Part 3: Coping with failing Providers; real-life
lessons – Alastair Greenan – 30 May 2019
Key Questions for today
▪ Carillion became insolvent and it seemingly took many by
surprise,
but was it really a ‘surprise’ ?
▪ And importantly,
what can we learn from it
so that we do not appoint Providers for future projects who
then become insolvent?
Overview
Philip :
▪ What are bankruptcy and insolvency ?
▪ What impacts can insolvency have
▪ Overview of a “Company Report”
Jon :
▪ Carillion - The warning signs from an amateur investors
perspective
Philip :
▪ Typical Financial Due Diligence Questions: are they fit for
purpose ?
▪ What else could we be asking?
▪ What do we do with the information we receive?
Disclaimer
We are not giving you advice over which suppliers to use or over
due process. We are just raising your awareness, as project
managers, so you know
▪ when to seek further advice from accountants, lawyers &/or
commercial/procurement professionals,
and
▪ be able to have more intelligent conversations with them
About Philip
▪ Chartered Quantity Surveyor and chartered member of CIPS
▪ Honours Degree in Commercial Management
▪ 20+ years C&P experience globally, predominantly identifying
contract strategy and selecting Providers
▪ Responsibilities for selecting supply chains for projects,
programmes and ongoing portfolios across a range of industry
sectors
▪ Construction works, capex projects, facilities management, other
ongoing services
▪ Work includes: major project management companies and client
organisations; ranging from huge multi-nationals to smaller
regional and local providers
▪ Range of due diligence approaches and appetites for commercial
risk encountered
Section 1: Insolvency
▪ What are bankruptcy and insolvency?
▪ What the potential effects on your project?
Insolvency – Terminology & Info
▪ Insolvency is a term used for both companies and individuals.
▪ As an individual = Bankruptcy
▪ For a company = Corporate Insolvency
Different terminology
and;
Different rules
▪ See https://www.gov.uk/government/organisations/insolvency-
service
Insolvency – What is it?
▪ Company becomes insolvent if it is unable to pay its debts
▪ 2 key tests:
– Cash flow
– Value of assets versus liabilities
Company is technically insolvent if either apply
But, they may still be trading
Formal insolvency proceedings must be commenced for the company
to actually become Formally Insolvent.
Insolvency – the Types
▪ Option 1 (when Technically Insolvent)
▪ Informal arrangement with creditors
To try to prevent;
▪ 4 different types of Formal Insolvency procedures:
– Company Voluntary Arrangement (CVA)
– Administration
– Administrative Receivership
– Liquidation (winding up) (closure)
All types run by a qualified and licensed Insolvency Practitioner
Insolvency Act 1986
Type 4 - Liquidation
▪ e.g. Carillion, 2018
https://www.pwc.co.uk/services/business-
recovery/administrations/carillion.html )
– Liquidation “winds-up” the company
– Stops trading
Can either be;
– Instigated by the Directors,
– Voluntary or Compulsory liquidation,
or
– Creditors can also apply to wind-up an insolvent company
– Overseen by a “Liquidator”
▪ Ends affairs of the company
▪ Assets cashed – “liquidate”
▪ Collect any money owed
▪ Distribute cash
Insolvency – What happens / Who gets paid?
▪ If sufficient funds:
▪ Cash will be distributed to the following;
– Fees of the Insolvency Practitioner / Liquidator
– Preferential creditors - including employees (e.g. wages)
– Prescribed part – max £600K
– Fixed charge costs - secured creditors' claims
– Unsecured creditors' claims
– Shareholders.
Carillion – The Impact
▪ Fourteen NHS trusts
▪ Public sector procurement thresholds
▪ Political questioning over delivery models (such as PFI)
▪ 1,141 redundancies
▪ 7,600 jobs transferred to other employers
▪ Multiple public enquiries
▪ Giant pension deficits
▪ Supply chain
▪ Who else relies on their supply chain?
▪ Positive benefits too – review of payment practices
Insolvency – The Impact on the PM
Delivery
Labour issues
Material suppliers / ownership
Supply chain and sub-contractors
Re-procurement
Unfinished works
Unable to lawfully trade
Time-consuming
Programme slippage / significant delay
Project viability
Individuals
Uncertainty
Pensions / wages / salaries
Morale
Introspection
Self doubt
Stressful
Customers / Other Organisations
Who else needs their projects completing?
You’re unlikely to be the only ones affected
Do their sub-contractors want paying?
Lenders withdraw funding?
Client nerves – cancel the project?
Perception
Media
Hear-say
Disruption
Industry-wide impact / nerves / confidence
Delayed investment decisions
Section 3 – Company Reports
▪ Publicly Available Financial Information
▪ Companies House
▪ https://beta.companieshouse.gov.uk/
– Director details
– Financial accounts / Corporate report
– Filing history
– Charges
– Insolvency
– Follow companies
Why look at Company Reports?
▪ Not just about avoiding insolvency:
– General financial standing
– Reputation
– Quality of work
– Can they deliver?
– Ability to borrow
– Long term outlook
Corporate Reports
▪ A statutory requirement
▪ A report to shareholders/funders
▪ The success or otherwise of the operations
▪ Accounts for the performance of management
▪ Enables judgements and decision making for many
stakeholders
▪ Not precisely accurate
▪ You can compare trends from year to year
What is in a Corporate Report?
▪ Profit & Loss Account
▪ Balance Sheet
▪ Cash Flow statement
▪ Notes to the accounts
– Explanations and detailed analysis
▪ Governance arrangements
▪ Directors Report (per Companies Act 1985)
▪ Independent Audit Report
▪ Commentary
– Interpretations
– Statements
– Focus points
– Implications of the accounting data for the business and it’s objectives
– A “Chairman’s Statement”
Basic Principles to look out for
▪ Is the business a “going concern”?
▪ Easily understandable?
▪ Are the accounts prudent?
▪ Consistency in approach from year to year
▪ “Off balance sheet”
▪ Utilise Accounting Ratios to get key information
Accounts – always remember
Revenue is vanity
Profit is sanity
Cash is king
Other Information on Request
As well as freely available reports, these can be obtained:
▪ Management accounts
▪ Management information
▪ Credit agency reports
– Warnings
– Advisory notes
– Ratings
– Maximum aggregate contract values
About Jon
▪ Chair of C&P SIG for last ten years (on & off).
▪ 25 years C&P experience, but predominantly in use of NEC family of
contracts and contract strategy, NOT selecting Providers
▪ Got fed up with paying for low returns and poor advice from financial
services sector, so started to do it myself some 6+ years ago
▪ Progressively started to invest directly in public companies
▪ Style : Good to great companies – sustainable growth - at a discount to
fair price (GARP).
▪ Filtering process is : financial publications; financial websites; company
websites & accounts.
▪ Now APM Trustee Board member and its Investment’s Champion
What we will look at
Carillion’s
▪ Income Statement
▪ Balance Sheet
▪ Cashflow Statement
▪ Financial Indicators
▪ Other sources
over time
Carillion : the profits were fine, weren’t
they ?
So how did this happen ?
i.e. was it foreseeable ?
What is a: Profit & Loss Account ?
▪ Shows transactions during the year
▪ “Matched” and accrued for
– Revenues
– Costs
– Profits
▪ Gross
▪ Operating expense
▪ Net
– Taxes
– Dividends
– Reserves
Operating Profit (adjusted) 195.50 170.10 200.40 200.00 2
Investment Income 34.30 26.50 25.10 26.00
Exceptional Items -1.60 -45.20 -0.30 9.40 -
Net Interest -29.10 -40.30 -57.50 -54.30 -
Pre-tax Profit 164.80 110.60 142.60 155.10 1
Tax 9.90 4.30 15.10 15.70
Net Profit 154.90 106.30 127.50 139.40 1
Minority Interests 6.10 6.10 6.80 6.60
Profit For Financial Year 148.80 100.20 120.70 132.80 1
Ordinary Dividends 70.40 74.60 75.70 76.80
Non Equity Dividends 0.00 0.00 0.00 0.00
Retained Profit 78.40 25.60 45.00 56.00
Per Share Data
DPS p 17.00 17.35 17.60 17.85
Normalized EPS p 35.16 34.71 25.46 26.43
Reported EPS p 34.40 23.20 25.40 28.20
Norm Discontinued EPS p 0.00 0.00 0.00 0.00
Investment Ratios
Operating Margin 3.99 4.63 4.18 4.04
DPS Growth % 6.25 2.06 1.44 1.42
Dividend Cover x 2.07 2.00 1.45 1.48
Norm EPS Growth % -8.74 -1.30 -26.63 3.81
Reported EPS Growth % 8.18 -32.56 9.48 11.02
Other
Market Cap at B/S Date 1,363.91 1,422.14 1,444.80 1,303.38 1,0
Foreign Turnover 812.90 864.40 861.70 946.90 1,1
Discontinued Turnover 0.00 0.00 0.00 0.00
Discontinued Pre-tax Profit 0.00 0.00 0.00 0.00
Discontinued Post-tax Profit 0.00 0.00 0.00 0.00
Carillion Income Statement
Source : morningstar
09Carillion Income statement | CLLN - Morningstar
Carillion PLC CLLN
Period Show Report Dates View Rounding Export to Excel
5 Years Ascending
Income Statement
2012 2013 2014 2015
Fiscal Year Ends 31/12/2012 31/12/2013 31/12/2014 31/12/2015
Turnover 3,666.20 3,332.60 3,493.90 3,950.70
Expenses 3,472.30 3,208.20 3,293.80 3,741.30
EBITDA 251.60 254.00 238.40 238.80
EBIT 189.40 190.50 193.60 193.40
Operating Profit (reported) 193.90 124.40 200.10 209.40
Operating Profit (adjusted) 195.50 170.10 200.40 200.00
Investment Income 34.30 26.50 25.10 26.00
Exceptional Items -1.60 -45.20 -0.30 9.40
Net Interest -29.10 -40.30 -57.50 -54.30
Pre-tax Profit 164.80 110.60 142.60 155.10
Tax 9.90 4.30 15.10 15.70
Net Profit 154.90 106.30 127.50 139.40
Minority Interests 6.10 6.10 6.80 6.60
Profit For Financial Year 148.80 100.20 120.70 132.80
Ordinary Dividends 70.40 74.60 75.70 76.80
Non Equity Dividends 0.00 0.00 0.00 0.00
Retained Profit 78.40 25.60 45.00 56.00
Per Share Data
DPS p 17.00 17.35 17.60 17.85
Normalized EPS p 35.16 34.71 25.46 26.43
Reported EPS p 34.40 23.20 25.40 28.20
Norm Discontinued EPS p 0.00 0.00 0.00 0.00
09/03/2018 11:45ome statement | CLLN - Morningstar
lion PLC CLLN
Show Report Dates View Rounding Export to Excel
Ascending
e Statement
2012 2013 2014 2015 2016
Ends 31/12/2012 31/12/2013 31/12/2014 31/12/2015 31/12/2016
3,666.20 3,332.60 3,493.90 3,950.70 4,394.90
3,472.30 3,208.20 3,293.80 3,741.30 4,213.00
251.60 254.00 238.40 238.80 255.40
189.40 190.50 193.60 193.40 210.40
Profit (reported) 193.90 124.40 200.10 209.40 181.90
Profit (adjusted) 195.50 170.10 200.40 200.00 215.70
t Income 34.30 26.50 25.10 26.00 36.30
al Items -1.60 -45.20 -0.30 9.40 -23.30
st -29.10 -40.30 -57.50 -54.30 -35.20
ofit 164.80 110.60 142.60 155.10 146.70
9.90 4.30 15.10 15.70 17.20
154.90 106.30 127.50 139.40 129.50
nterests 6.10 6.10 6.80 6.60 5.30
Financial Year 148.80 100.20 120.70 132.80 124.20
Dividends 70.40 74.60 75.70 76.80 78.90
y Dividends 0.00 0.00 0.00 0.00 0.00
rofit 78.40 25.60 45.00 56.00 45.30
e Data
17.00 17.35 17.60 17.85 18.35
d EPS p 35.16 34.71 25.46 26.43 33.01
EPS p 34.40 23.20 25.40 28.20 25.90
ontinued EPS p 0.00 0.00 0.00 0.00 0.00
Profit (reported) 193.90 124.40 200.10 209.40 181.90
Profit (adjusted) 195.50 170.10 200.40 200.00 215.70
t Income 34.30 26.50 25.10 26.00 36.30
al Items -1.60 -45.20 -0.30 9.40 -23.30
st -29.10 -40.30 -57.50 -54.30 -35.20
ofit 164.80 110.60 142.60 155.10 146.70
9.90 4.30 15.10 15.70 17.20
154.90 106.30 127.50 139.40 129.50
nterests 6.10 6.10 6.80 6.60 5.30
Financial Year 148.80 100.20 120.70 132.80 124.20
Dividends 70.40 74.60 75.70 76.80 78.90
y Dividends 0.00 0.00 0.00 0.00 0.00
rofit 78.40 25.60 45.00 56.00 45.30
Data
17.00 17.35 17.60 17.85 18.35
d EPS p 35.16 34.71 25.46 26.43 33.01
EPS p 34.40 23.20 25.40 28.20 25.90
ontinued EPS p 0.00 0.00 0.00 0.00 0.00
nt Ratios
Margin 3.99 4.63 4.18 4.04 4.26
h % 6.25 2.06 1.44 1.42 2.80
Cover x 2.07 2.00 1.45 1.48 1.80
Growth % -8.74 -1.30 -26.63 3.81 24.89
EPS Growth % 8.18 -32.56 9.48 11.02 -8.16
p at B/S Date 1,363.91 1,422.14 1,444.80 1,303.38 1,015.83
rnover 812.90 864.40 861.70 946.90 1,100.70
ed Turnover 0.00 0.00 0.00 0.00 0.00
ed Pre-tax Profit 0.00 0.00 0.00 0.00 0.00
ed Post-tax Profit 0.00 0.00 0.00 0.00 0.00
It’s a growth company !
Consistent adjustments
cause concern i.e. not
‘exceptional’ !
Last year’s does not add up.
Not going up with turnover
Depreciation &
Amortisation is small for a
large company
High interest vs Profit
Per Share data from Income Statement
Exceptional Items -1.60 -45.20 -0.30 9.40
Net Interest -29.10 -40.30 -57.50 -54.30
Pre-tax Profit 164.80 110.60 142.60 155.10
Tax 9.90 4.30 15.10 15.70
Net Profit 154.90 106.30 127.50 139.40
Minority Interests 6.10 6.10 6.80 6.60
Profit For Financial Year 148.80 100.20 120.70 132.80
Ordinary Dividends 70.40 74.60 75.70 76.80
Non Equity Dividends 0.00 0.00 0.00 0.00
Retained Profit 78.40 25.60 45.00 56.00
Per Share Data
DPS p 17.00 17.35 17.60 17.85
Normalized EPS p 35.16 34.71 25.46 26.43
Reported EPS p 34.40 23.20 25.40 28.20
Norm Discontinued EPS p 0.00 0.00 0.00 0.00
Investment Ratios
Operating Margin 3.99 4.63 4.18 4.04
DPS Growth % 6.25 2.06 1.44 1.42
Dividend Cover x 2.07 2.00 1.45 1.48
Norm EPS Growth % -8.74 -1.30 -26.63 3.81
Reported EPS Growth % 8.18 -32.56 9.48 11.02
Other
Market Cap at B/S Date 1,363.91 1,422.14 1,444.80 1,303.38
Foreign Turnover 812.90 864.40 861.70 946.90
Discontinued Turnover 0.00 0.00 0.00 0.00
Discontinued Pre-tax Profit 0.00 0.00 0.00 0.00
Discontinued Post-tax Profit 0.00 0.00 0.00 0.00
-1.60 -45.20 -0.30 9.40 -23.30
-29.10 -40.30 -57.50 -54.30 -35.20
164.80 110.60 142.60 155.10 146.70
9.90 4.30 15.10 15.70 17.20
154.90 106.30 127.50 139.40 129.50
6.10 6.10 6.80 6.60 5.30
r 148.80 100.20 120.70 132.80 124.20
70.40 74.60 75.70 76.80 78.90
0.00 0.00 0.00 0.00 0.00
78.40 25.60 45.00 56.00 45.30
17.00 17.35 17.60 17.85 18.35
35.16 34.71 25.46 26.43 33.01
34.40 23.20 25.40 28.20 25.90
S p 0.00 0.00 0.00 0.00 0.00
3.99 4.63 4.18 4.04 4.26
6.25 2.06 1.44 1.42 2.80
2.07 2.00 1.45 1.48 1.80
-8.74 -1.30 -26.63 3.81 24.89
% 8.18 -32.56 9.48 11.02 -8.16
e 1,363.91 1,422.14 1,444.80 1,303.38 1,015.83
812.90 864.40 861.70 946.90 1,100.70
0.00 0.00 0.00 0.00 0.00
rofit 0.00 0.00 0.00 0.00 0.00
Profit 0.00 0.00 0.00 0.00 0.00
This reflects the reported and adjusted profit divided by number of shares
Summary so far
▪ As an investor …
… loosing interest already.
▪ As an organisation, choosing who to do business with
(whether as a key provider or client) …
… some amber flags raised already
that would want to find out more about.
What is a: Balance Sheet ?
▪ Shows financial position at a point in time – the end of its financial year
▪ Assets
– Fixed (long-term) – valuable for either generating profit or as a sellable item
▪ Land, buildings, plant
▪ Net book value (after depreciation)
– Current – Cashable within a year
▪ Cash, stocks, trade debtors – Who are their customers? Are they likely to pay on time?
▪ Claims & liabilities – any amounts owed
– Current (due within the year)
▪ Trade creditors, accruals, bank overdraft, taxes, dividends declared
– Long-term
▪ Asset minus liabilities = Capital (shareholder’s funds or “equity interest”)
▪ Has the capital increased or decreased since last year?
▪ But does not usually include other more intangible “assets” such as brand
power, know-how, skill, morale etc.
Carillion Balance Statement part 1
Source : morningstar
09/03/2018 11:46Carillion Balance Sheet | CLLN - Morningstar
Carillion PLC CLLN
Period Show Report Dates View Rounding Export to Excel
5 Years Ascending
Balance Sheet
2012 2013 2014 2015 2016
Fiscal Year Ends 31/12/2012 31/12/2013 31/12/2014 31/12/2015 31/12/2016
Assets
Non Current Assets
Intangible 1,536.60 1,552.80 1,614.10 1,634.20 1,669.30
Tangible 125.80 128.20 141.90 140.50 144.10
Investments 237.90 159.30 139.90 165.20 180.30
Other 124.50 116.40 147.80 116.50 169.60
Total 2,024.80 1,956.70 2,043.70 2,056.40 2,163.30
Current Assets
Stock 55.30 48.60 50.10 64.30 78.80
Debtors 1,122.30 1,216.30 1,328.70 1,272.00 1,674.80
Cash and Securities 660.00 418.30 473.90 476.80 516.20
Total 1,837.60 1,683.20 1,852.70 1,813.10 2,269.80
Held for Disposal 0.00 0.00 0.00 0.00 0.00
Total Assets 3,862.40 3,639.90 3,896.40 3,869.50 4,433.10
Liabilities and Equity
Liabilities
Current 1,687.80 1,661.60 1,808.20 1,771.60 2,217.40
Non-Current 1,163.90 994.70 1,193.70 1,081.30 1,485.80
Total 2,851.70 2,656.30 3,001.90 2,852.90 3,703.20
Equity
Share Capital 236.30 236.30 236.30 236.30 236.30
Reserves 762.60 730.90 636.40 757.20 464.80
Shareholders Funds 998.90 967.20 872.70 993.50 701.10
Minorities 11.80 16.40 21.80 23.10 28.80
09/03/2018 11:46| CLLN - Morningstar
LC CLLN
Show Report Dates View Rounding Export to Excel
Ascending
2012 2013 2014 2015 2016
31/12/2012 31/12/2013 31/12/2014 31/12/2015 31/12/2016
ts
1,536.60 1,552.80 1,614.10 1,634.20 1,669.30
125.80 128.20 141.90 140.50 144.10
237.90 159.30 139.90 165.20 180.30
124.50 116.40 147.80 116.50 169.60
2,024.80 1,956.70 2,043.70 2,056.40 2,163.30
55.30 48.60 50.10 64.30 78.80
1,122.30 1,216.30 1,328.70 1,272.00 1,674.80
es 660.00 418.30 473.90 476.80 516.20
1,837.60 1,683.20 1,852.70 1,813.10 2,269.80
0.00 0.00 0.00 0.00 0.00
3,862.40 3,639.90 3,896.40 3,869.50 4,433.10
1,687.80 1,661.60 1,808.20 1,771.60 2,217.40
1,163.90 994.70 1,193.70 1,081.30 1,485.80
2,851.70 2,656.30 3,001.90 2,852.90 3,703.20
236.30 236.30 236.30 236.30 236.30
762.60 730.90 636.40 757.20 464.80
ds 998.90 967.20 872.70 993.50 701.10
11.80 16.40 21.80 23.10 28.80
Intangibles = Goodwill, Intellectual Property (inc capitalised R&D), Brands etc.
Carillion, as a FM/ construction company does not have any obvious IP, Brands etc,
so likely to be ‘goodwill’ from purchases.
In 2009, Carillion Intangibles went up £220m due to a purchase.
Does not appear to be any
writing down of goodwill,
although is at £45m pa
Turnover went up £450m &
debtors £400m. Increase is not
proportional. Debtor days ?
But cash increased. How ?
Carillion Balance Statement part 2
Source : morningstar
2,024.80 1,956.70 2,043.70 2,056.40 2,163.30
55.30 48.60 50.10 64.30 78.80
1,122.30 1,216.30 1,328.70 1,272.00 1,674.80
ities 660.00 418.30 473.90 476.80 516.20
1,837.60 1,683.20 1,852.70 1,813.10 2,269.80
al 0.00 0.00 0.00 0.00 0.00
3,862.40 3,639.90 3,896.40 3,869.50 4,433.10
ity
1,687.80 1,661.60 1,808.20 1,771.60 2,217.40
1,163.90 994.70 1,193.70 1,081.30 1,485.80
2,851.70 2,656.30 3,001.90 2,852.90 3,703.20
236.30 236.30 236.30 236.30 236.30
762.60 730.90 636.40 757.20 464.80
unds 998.90 967.20 872.70 993.50 701.10
11.80 16.40 21.80 23.10 28.80
1,010.70 983.60 894.50 1,016.60 729.90
and Equity 3,862.40 3,639.90 3,896.40 3,869.50 4,433.10
155.80 215.20 177.30 169.80 218.90
alue Per Share -124.96 -136.09 -172.32 -148.90 -225.01
29.48 42.08 37.57 43.40 39.28
11.05 11.06 8.62 8.81 10.34
15.60 22.25 20.32 17.09 31.22
Total 2,024.80 1,956.70 2,043.70
Current Assets
Stock 55.30 48.60 50.10
Debtors 1,122.30 1,216.30 1,328.70
Cash and Securities 660.00 418.30 473.90
Total 1,837.60 1,683.20 1,852.70
Held for Disposal 0.00 0.00 0.00
Total Assets 3,862.40 3,639.90 3,896.40
Liabilities and Equity
Liabilities
Current 1,687.80 1,661.60 1,808.20
Non-Current 1,163.90 994.70 1,193.70
Total 2,851.70 2,656.30 3,001.90
Equity
Share Capital 236.30 236.30 236.30
Reserves 762.60 730.90 636.40
Shareholders Funds 998.90 967.20 872.70
Minorities 11.80 16.40 21.80
Total 1,010.70 983.60 894.50
Total Liabilities and Equity 3,862.40 3,639.90 3,896.40
Net Borrowings 155.80 215.20 177.30
Investment Ratios
Net Tangible Asset Value Per Share -124.96 -136.09 -172.32
ROCE 29.48 42.08 37.57
ROE 11.05 11.06 8.62
Net Gearing 15.60 22.25 20.32
Stock 55.30 48.60 50.10
Debtors 1,122.30 1,216.30 1,328.70 1,27
Cash and Securities 660.00 418.30 473.90 47
Total 1,837.60 1,683.20 1,852.70 1,81
Held for Disposal 0.00 0.00 0.00
Total Assets 3,862.40 3,639.90 3,896.40 3,86
Liabilities and Equity
Liabilities
Current 1,687.80 1,661.60 1,808.20 1,77
Non-Current 1,163.90 994.70 1,193.70 1,08
Total 2,851.70 2,656.30 3,001.90 2,85
Equity
Share Capital 236.30 236.30 236.30 23
Reserves 762.60 730.90 636.40 75
Shareholders Funds 998.90 967.20 872.70 99
Minorities 11.80 16.40 21.80
Total 1,010.70 983.60 894.50 1,01
Total Liabilities and Equity 3,862.40 3,639.90 3,896.40 3,86
Net Borrowings 155.80 215.20 177.30 16
Investment Ratios
Net Tangible Asset Value Per Share -124.96 -136.09 -172.32 -14
ROCE 29.48 42.08 37.57
ROE 11.05 11.06 8.62
Net Gearing 15.60 22.25 20.32
Gross Gearing 81.38 65.02 74.40
Cash 65.78 42.77 54.09
6.66 5.85 5.69
ities 660.00 418.30 473.90 476.80 516.20
1,837.60 1,683.20 1,852.70 1,813.10 2,269.80
al 0.00 0.00 0.00 0.00 0.00
3,862.40 3,639.90 3,896.40 3,869.50 4,433.10
ity
1,687.80 1,661.60 1,808.20 1,771.60 2,217.40
1,163.90 994.70 1,193.70 1,081.30 1,485.80
2,851.70 2,656.30 3,001.90 2,852.90 3,703.20
236.30 236.30 236.30 236.30 236.30
762.60 730.90 636.40 757.20 464.80
unds 998.90 967.20 872.70 993.50 701.10
11.80 16.40 21.80 23.10 28.80
1,010.70 983.60 894.50 1,016.60 729.90
and Equity 3,862.40 3,639.90 3,896.40 3,869.50 4,433.10
155.80 215.20 177.30 169.80 218.90
alue Per Share -124.96 -136.09 -172.32 -148.90 -225.01
29.48 42.08 37.57 43.40 39.28
11.05 11.06 8.62 8.81 10.34
15.60 22.25 20.32 17.09 31.22
81.38 65.02 74.40 63.61 98.23
65.78 42.77 54.09 46.52 67.01
Amounts it owes (debt) has gone up by £850m (on £4.5bn turnover),
and amount it is owed (from previous) went up by £400m,
Stock 55.30 48.60 50.10
Debtors 1,122.30 1,216.30 1,328.70
Cash and Securities 660.00 418.30 473.90
Total 1,837.60 1,683.20 1,852.70
Held for Disposal 0.00 0.00 0.00
Total Assets 3,862.40 3,639.90 3,896.40
Liabilities and Equity
Liabilities
Current 1,687.80 1,661.60 1,808.20
Non-Current 1,163.90 994.70 1,193.70
Total 2,851.70 2,656.30 3,001.90
Equity
Share Capital 236.30 236.30 236.30
Reserves 762.60 730.90 636.40
Shareholders Funds 998.90 967.20 872.70
Minorities 11.80 16.40 21.80
Total 1,010.70 983.60 894.50
which is reflected in Net Value
1,837.60 1,683.20 1,852.70 1,813.10 2,269.80
sal 0.00 0.00 0.00 0.00 0.00
3,862.40 3,639.90 3,896.40 3,869.50 4,433.10
uity
1,687.80 1,661.60 1,808.20 1,771.60 2,217.40
1,163.90 994.70 1,193.70 1,081.30 1,485.80
2,851.70 2,656.30 3,001.90 2,852.90 3,703.20
236.30 236.30 236.30 236.30 236.30
762.60 730.90 636.40 757.20 464.80
Funds 998.90 967.20 872.70 993.50 701.10
11.80 16.40 21.80 23.10 28.80
1,010.70 983.60 894.50 1,016.60 729.90
and Equity 3,862.40 3,639.90 3,896.40 3,869.50 4,433.10
155.80 215.20 177.30 169.80 218.90
s
Value Per Share -124.96 -136.09 -172.32 -148.90 -225.01
29.48 42.08 37.57 43.40 39.28
11.05 11.06 8.62 8.81 10.34
15.60 22.25 20.32 17.09 31.22
However, a large part of that Net Value is ‘old’ (and worthless) intangibles (goodwill).
So what is it actually worth per share ?
Some other Balance Sheet Ratios
Non-Current 1,163.90 994.70 1,193.70 1,081.30
Total 2,851.70 2,656.30 3,001.90 2,852.90
Equity
Share Capital 236.30 236.30 236.30 236.30
Reserves 762.60 730.90 636.40 757.20
Shareholders Funds 998.90 967.20 872.70 993.50
Minorities 11.80 16.40 21.80 23.10
Total 1,010.70 983.60 894.50 1,016.60
Total Liabilities and Equity 3,862.40 3,639.90 3,896.40 3,869.50
Net Borrowings 155.80 215.20 177.30 169.80
Investment Ratios
Net Tangible Asset Value Per Share -124.96 -136.09 -172.32 -148.90
ROCE 29.48 42.08 37.57 43.40
ROE 11.05 11.06 8.62 8.81
Net Gearing 15.60 22.25 20.32 17.09
Gross Gearing 81.38 65.02 74.40 63.61
Cash 65.78 42.77 54.09 46.52
Interest Cover x 6.66 5.85 5.69 4.44
Quick Ratio r 1.06 0.98 1.00 0.99
Current Ratio r 1.09 1.01 1.03 1.02
Borrowings
Total Borrowings 812.90 628.90 649.30 632.00
Due < 1 Yr 35.30 22.50 35.30 33.50
Due 1-2 Yrs 0.00 0.00 0.00 0.00
Due 2-5 Yrs 0.00 0.00 0.00 0.00
Due > 5 Yrs 3.60 3.10 2.50 0.00
GBP in Millions except per share data.
Figures from 2004 in accordance with IFRS, 2015: 0.00000, 2014: 0.00000
1,687.80 1,661.60 1,808.20 1,771.60 2,217.40
1,163.90 994.70 1,193.70 1,081.30 1,485.80
2,851.70 2,656.30 3,001.90 2,852.90 3,703.20
236.30 236.30 236.30 236.30 236.30
762.60 730.90 636.40 757.20 464.80
998.90 967.20 872.70 993.50 701.10
11.80 16.40 21.80 23.10 28.80
1,010.70 983.60 894.50 1,016.60 729.90
quity 3,862.40 3,639.90 3,896.40 3,869.50 4,433.10
155.80 215.20 177.30 169.80 218.90
er Share -124.96 -136.09 -172.32 -148.90 -225.01
29.48 42.08 37.57 43.40 39.28
11.05 11.06 8.62 8.81 10.34
15.60 22.25 20.32 17.09 31.22
81.38 65.02 74.40 63.61 98.23
65.78 42.77 54.09 46.52 67.01
6.66 5.85 5.69 4.44 4.95
1.06 0.98 1.00 0.99 0.99
1.09 1.01 1.03 1.02 1.02
812.90 628.90 649.30 632.00 688.70
35.30 22.50 35.30 33.50 96.70
0.00 0.00 0.00 0.00 0.00
0.00 0.00 0.00 0.00 0.00
3.60 3.10 2.50 0.00 0.00
share data.
Total 2,851.70 2,656.30 3,001.90 2,852.90
Equity
Share Capital 236.30 236.30 236.30 236.30
Reserves 762.60 730.90 636.40 757.20
Shareholders Funds 998.90 967.20 872.70 993.50
Minorities 11.80 16.40 21.80 23.10
Total 1,010.70 983.60 894.50 1,016.60
Total Liabilities and Equity 3,862.40 3,639.90 3,896.40 3,869.50
Net Borrowings 155.80 215.20 177.30 169.80
Investment Ratios
Net Tangible Asset Value Per Share -124.96 -136.09 -172.32 -148.90
ROCE 29.48 42.08 37.57 43.40
ROE 11.05 11.06 8.62 8.81
Net Gearing 15.60 22.25 20.32 17.09
Gross Gearing 81.38 65.02 74.40 63.61
Cash 65.78 42.77 54.09 46.52
Interest Cover x 6.66 5.85 5.69 4.44
Quick Ratio r 1.06 0.98 1.00 0.99
Current Ratio r 1.09 1.01 1.03 1.02
Borrowings
Total Borrowings 812.90 628.90 649.30 632.00
Due < 1 Yr 35.30 22.50 35.30 33.50
Due 1-2 Yrs 0.00 0.00 0.00 0.00
Due 2-5 Yrs 0.00 0.00 0.00 0.00
Due > 5 Yrs 3.60 3.10 2.50 0.00
GBP in Millions except per share data.
Figures from 2004 in accordance with IFRS, 2015: 0.00000, 2014: 0.00000
2,851.70 2,656.30 3,001.90 2,852.90 3,703.20
236.30 236.30 236.30 236.30 236.30
762.60 730.90 636.40 757.20 464.80
998.90 967.20 872.70 993.50 701.10
11.80 16.40 21.80 23.10 28.80
1,010.70 983.60 894.50 1,016.60 729.90
quity 3,862.40 3,639.90 3,896.40 3,869.50 4,433.10
155.80 215.20 177.30 169.80 218.90
er Share -124.96 -136.09 -172.32 -148.90 -225.01
29.48 42.08 37.57 43.40 39.28
11.05 11.06 8.62 8.81 10.34
15.60 22.25 20.32 17.09 31.22
81.38 65.02 74.40 63.61 98.23
65.78 42.77 54.09 46.52 67.01
6.66 5.85 5.69 4.44 4.95
1.06 0.98 1.00 0.99 0.99
1.09 1.01 1.03 1.02 1.02
812.90 628.90 649.30 632.00 688.70
35.30 22.50 35.30 33.50 96.70
0.00 0.00 0.00 0.00 0.00
0.00 0.00 0.00 0.00 0.00
3.60 3.10 2.50 0.00 0.00
share data.
rdance with IFRS, 2015: 0.00000, 2014: 0.00000
Balance Sheet · Income Statement · CashfloFinancial Summary
Year End 31st Dec 2011 2012 2013 2014 2015 2016 2017E 2018E CAGR / A
Revenue £m 4,153 3,666 3,333 3,494 3,951 4,395 4,954 5,100 +1.1
Operating Profit £m 146.7 192.7 150.2 190.2 206.9 196.4 +6.0
Net Profit £m 134.6 148.8 100.2 120.7 132.8 124.2 142.4 150.1 -1.6
EPSReported p 31.8 34.4 23.2 25.4 28.0 26.1 -3.8
EPSNormalised p 46.0 34.7 33.7 27.2 32.1 32.0 34.0 35.3 -7.0
EPSGrowth % +30.9 -24.6 -2.8 -19.2 +17.9 -0.2 +6.15 +3.68
PERatio x 7.26 6.84 6.60
x 1.18 1.86 2.28
Profitability
% 3.5 5.3 4.5 5.4 5.2 4.5 +4.7
% 3.9 2.7 3.2 3.4 3.0
% 8.0 8.9 7.6 9.1 9.9 8.9 +8.7
% 15.1 10.2 13.1 14.2 14.7 +13.5
Cashflow
p 24.4 -5.92 -18.2 26.1 15.4 15.4 -8.8
p 2.98 4.23 6.51 6.07 6.40 7.85 +21.4
p 21.4 -10.2 -24.7 20.0 9.03 7.57 -18.8
Last ex-div: 11th May, paid: 9th Jun more
Year End 31st Dec 2011 2012 2013 2014 2015 2016 2017E 2018E CAGR / A
£m 4,153 3,666 3,333 3,494 3,951 4,395 4,954 5,100 +1.1
£m 146.7 192.7 150.2 190.2 206.9 196.4 +6.0
£m 134.6 148.8 100.2 120.7 132.8 124.2 142.4 150.1 -1.6
p 31.8 34.4 23.2 25.4 28.0 26.1 -3.8
p 46.0 34.7 33.7 27.2 32.1 32.0 34.0 35.3 -7.0
% +30.9 -24.6 -2.8 -19.2 +17.9 -0.2 +6.15 +3.68
x 7.26 6.84 6.60
x 1.18 1.86 2.28
Profitability
% 3.5 5.3 4.5 5.4 5.2 4.5 +4.7
% 3.9 2.7 3.2 3.4 3.0
% 8.0 8.9 7.6 9.1 9.9 8.9 +8.7
ROE % 15.1 10.2 13.1 14.2 14.7 +13.5
Cashflow
Op. Cashflow ps p 24.4 -5.92 -18.2 26.1 15.4 15.4 -8.8
Capex ps p 2.98 4.23 6.51 6.07 6.40 7.85 +21.4
Free Cashflow ps p 21.4 -10.2 -24.7 20.0 9.03 7.57 -18.8
Dividends
Dividend ps p 16.9 17.3 17.5 17.8 18.3 18.5 18.9 19.1 +1.8
Dividend Growth % +9.03 +2.07 +1.45 +1.43 +2.82 +1.10 +2.17 +1.48
% 7.93 8.10 8.22
x 1.88 2.00 1.33 1.43 1.53 1.42 1.80 1.84
Balance Sheet
Cashflow statement vs Income Statement Source : Stockopedia
Last ex-div: 11th May, paid: 9th Jun more
p 31.8 34.4 23.2 25.4 28.0 26.1 -3.8
p 46.0 34.7 33.7 27.2 32.1 32.0 34.0 35.3 -7.0
% +30.9 -24.6 -2.8 -19.2 +17.9 -0.2 +6.15 +3.68
x 7.26 6.84 6.60
x 1.18 1.86 2.28
Profitability
% 3.5 5.3 4.5 5.4 5.2 4.5 +4.7
% 3.9 2.7 3.2 3.4 3.0
% 8.0 8.9 7.6 9.1 9.9 8.9 +8.7
% 15.1 10.2 13.1 14.2 14.7 +13.5
Cashflow
p 24.4 -5.92 -18.2 26.1 15.4 15.4 -8.8
p 2.98 4.23 6.51 6.07 6.40 7.85 +21.4
p 21.4 -10.2 -24.7 20.0 9.03 7.57 -18.8
Dividends
p 16.9 17.3 17.5 17.8 18.3 18.5 18.9 19.1 +1.8
% +9.03 +2.07 +1.45 +1.43 +2.82 +1.10 +2.17 +1.48
% 7.93 8.10 8.22
Dividend Cover x 1.88 2.00 1.33 1.43 1.53 1.42 1.80 1.84
Balance Sheet
£m 495 659.6 416.1 473.9 462.2 469.8 -1.0
£m -188.3 149.8 21.6 44.5 41.7 52.4
We’ve covered this.
“Owner’s earning” are
consistently much much
less than earnings. Cash
conversion is appalling.
Dividend is not normally
being covered by FCF
Stockopedia’s
first summary
page
But that’s not all …
A+
Liquidity (ttm)
Curr. Ratio 1.02
Quick Ratio 0.99
Interest Cov. 23.1
Efficiency (ttm)
Asset Turnover 1.04
Rec's Turnover 3.82
Stock Turnover 56.5
Other Ratios
Leverage (ttm) total -intang +pension
Gross Gearing % 98.2 213
Net Gearing % 31.2 146
Cash / Assets % 10.6 12.9
Latest interim period (ended 31st Dec '16) vs. prior year
Sales Growth 16.0 %
EPSGrowth -44.3 %
Everything I have said so far
ignores Carillion’s pension deficit.
How was it going to finance that ?
Stockopedia’s
first summary
page
Some indicators for 2016’s accounts
5PiotroskiF-Score
1.01Altman Z2-Score
Health Trend
BankruptcyRisk
EarningsManipulation Risk
A+
The Piotroski F-Score is a nine-criteria scoring system,
each of which relate to the change in a ratio based on
the company's accounts. The weakest stocks, scoring 2
or lower, are five times more likely to fall into financial
problems.
The Bankruptcy Risk Meter is a visual representation
of how likely a company is to head into serious
financial difficulty within 2 years. The metric is derived
from the Altman Z-Score, a statistical indicator
generated from balance sheet ratios. Tests have
shown that the Distress Zone is 80-90% accurate in
predicting bankruptcy.
The Earnings Manipulation Risk Indicator gives a
representation of how likely a company has been
manipulating accounts to inflate earnings. It is based
on the Beneish M-Score, derived from a set of 8 ratios
from a company's accounts. If the switch is on,
Beneish's research implies an 86% probability that the
firm is manipulating earnings.
Table&showing&trend
Altman'
Date
For'2013'(at'08/04/14)' 1.63
For'2014'(at'04/04/15) 1.47
For'2015'(at'09/04/16) 1.56
For'2016'(at'14/03/17) 1.01
Mid'2017'(at'05/08/17) 0.80
End'2017'(at'02/12/17) )3.45
Who could have seen this coming?
The company Percentage of equity which has been shorted
Carillion 27.2 per cent
Ocado Group 19.5 per cent
WM Morrison Supermarkets 16.1 per cent
Wood Group 12.3 per cent
Tullow Oil 12.2 per cent
Debenhams 12 per cent
Marks and Spencer 10.8 per cent
Mitie Group 10.6 per cent
Lancashire Holdings 9 per cent
Pets at Home 8.8 per cent
Sainsbury's 8.7 per cent
Hansteen Holding 8.3 per cent
“The dirty dozen”:
Source:
City AM
25th July 2017
Info: Short selling is the
sale of a security that is
not owned by the seller
or that the seller has
borrowed. Short selling is
motivated by the belief
that a security's price will
decline, enabling it to be
bought back at a lower
price to make a profit.
Interpreting Ratios – Caution!
– Ratios offer a simple explanation
– Beware coming to wrong conclusions
– See them as a “guide” to make conclusions – they are not conclusive proof
of anything
– Take professional and qualified advice
– The bigger your project / package / risk; the more advice would be
warranted
– A Corporate Report provides a “true and fair view” – it is reliable but it is
not perfect
– Beware; accounting policies, valuation methods, effect of goodwill, brand
equity, estimation, optimism bias, sophistication of notes.
Ask further questions, dig deeper, look for trends, check / test your
findings, seek professional help if it doesn’t make sense &/or not happy
with answers.
Section 5 : Typical Financial Due Diligence Activities
▪ Prioritizing
▪ A look at common Financial Due Diligence approaches
▪ Do they go far enough?
▪ Is it done at the best time?
▪ Do we understand what the provider’s responses are telling
us?
▪ Risk Appetite
Priorities
▪ C&P Guide (chapter 3)
▪ Prioritising high priority or high risk packages
Priorities and Risk?
▪ Do we assess the package risk?
▪ E.g. particular suppliers or sectors?
– Less frequently used items
– Are they cash-dependent trades?
– Long lead times, specialisms
– Is there any choice?
– Mission critical
– Heavily reliant on one particular customer type?
– FMJ.co.uk (March 2018) “The UK FTSE support services sector
issued 42 profit warnings in 2017 – the most of any sector”
General Risk Factors
▪ Some of the risk factors identified by an EY report:
– Delays and cancellations
– Other clients and their reputations
– Pricing / inflationary pressures
– Heavy exposure to public sector, with unrealistic funding expectations
– Problem contracts
– Increasing turnover with stagnant or decreasing profit
– Profit warnings
– Uncertainties
– Potential Brexit impacts
– Increasing competition
– Slow growth in their sector
– Changes in their sector
Common Approaches
▪ Principle in English Law: “Caveat Emptor” (Buyer Beware)
▪ It’s Up to You
Financial Due Diligence options
Private Sector
– Request their Financial Accounts
– Credit agency reports
– Companies House research
– Company specific PQQS
– Industry standard PQQs
– Accreditation bodies
– Industry schemes
Industry Standard PQQs
– Bsi: PAS 91:2013 – Construction
▪ A standardised pre-qualification questionnaire
▪ Reduce duplication
▪ Updated late 2017
▪ To be eligible for prequalification, it is necessary that:
– suppliers are able to demonstrate ….. financial and other essential capabilities
Core Modules
▪ C2 Financial Information
– 2 years audited accounts for medium and large companies
▪ C3 Business & Professional Standing
– Criminal or court action, including for bankruptcy proceedings
– Alternate questions available for public sector, including the grounds for:
» mandatory exclusion; such as failure to pay taxes or social security contributions.
» Discretionary exclusion; such as bankruptcy, insolvency,
Accreditation bodies / Schemes
– Various industry bodies / organisations
– Many focused on Health and Safety
– Check what methods they use
– A “Questionnaire” is just the start
Financial Due Diligence options
Public Contracts Regulations 2015
▪ Mandatory and discretionary exclusions for non-payment of taxes etc
▪ Discretionary exclusions
– where the economic operator is bankrupt or is the subject of insolvency or winding-up
proceedings, …….
▪ Selection Criteria
– related and proportionate to the subject-matter of the contract
– contracting authorities may impose requirements ensuring that economic operators
possess the necessary economic and financial capacity to perform the contract
– The minimum yearly turnover that economic operators are required to have shall not
exceed twice the estimated contract value
– Ratios, for example that between assets and liabilities, may be taken into consideration
where the contracting authority specifies the methods and criteria for such
consideration in the procurement documents
Section 6
– What else could we do?
– When could we do it?
When do we do Financial Due diligence?
– Prior to tender?
– As part of the tender?
– After tender (and hopefully prior to award)?
– Ongoing (after award)?
– NB. There may be Public Sector restrictions on your project
Reviewing Responses
Read it
Understand it
Act on it
Reviewing Responses – The Outcome
– If you identify an issue, what is the governance to ensure it is
addressed?
– Risk appetite – no “one size fits all” answer
– The more due diligence you do, the more costly the process (at least
in the short term)
– But, much cheaper to avoid a bad deal in the long run
What more can we do - Summary
1. Do you currently apply Financial Due Diligence to all
contracts?
2. Is it the same process / level of diligence applied for all
contracts?
3. When do you do your due diligence?
4. Are we restricted in the selection criteria available to us?
5. Do you perform due diligence on their sub-contractors?
6. Are ongoing financial updates made during contract
implementation to check if anything has changed?
7. Are recommendations (following due diligence) formalised?
Summary
▪ Insolvency can be debilitating for your project
▪ There are various sources of information about a companies
solvency
▪ Do we do due diligence and is it proportionate to the
situation?
▪ Do we actually review the responses and act on the
information?
▪ This is the first of a series of seminars by the Contracts & Procurement SIG on spotting
the warning signs, taking practical steps to protect your organization and project, and
dealing with Provider insolvency.
This presentation was delivered
at an APM webinar
To find out more about upcoming
webinars please visit our website
www.apm.org.uk/events

Lessons learnt from the Carillion collapse part 1: Selecting a financially sound provider webinar, 21 February 2019

  • 1.
    Lessons learnt fromthe Carillion collapse part 1: Selecting a financially sound provider webinar Presented by Philip Reese BSc (Hons) MRICS MAPM MCIPS CBIFM & Dr Jon Broome BEng PhD MAPM
  • 2.
    Series Introduction Lessons learntfrom the Carillion collapse : ▪ Part 1 : Selecting a financially sound Provider. ▪ Part 2 : 10 ways to protect yourself through the contract – Sarah Schutte – 3 April 2019 ▪ Part 3: Coping with failing Providers; real-life lessons – Alastair Greenan – 30 May 2019
  • 3.
    Key Questions fortoday ▪ Carillion became insolvent and it seemingly took many by surprise, but was it really a ‘surprise’ ? ▪ And importantly, what can we learn from it so that we do not appoint Providers for future projects who then become insolvent?
  • 4.
    Overview Philip : ▪ Whatare bankruptcy and insolvency ? ▪ What impacts can insolvency have ▪ Overview of a “Company Report” Jon : ▪ Carillion - The warning signs from an amateur investors perspective Philip : ▪ Typical Financial Due Diligence Questions: are they fit for purpose ? ▪ What else could we be asking? ▪ What do we do with the information we receive?
  • 5.
    Disclaimer We are notgiving you advice over which suppliers to use or over due process. We are just raising your awareness, as project managers, so you know ▪ when to seek further advice from accountants, lawyers &/or commercial/procurement professionals, and ▪ be able to have more intelligent conversations with them
  • 6.
    About Philip ▪ CharteredQuantity Surveyor and chartered member of CIPS ▪ Honours Degree in Commercial Management ▪ 20+ years C&P experience globally, predominantly identifying contract strategy and selecting Providers ▪ Responsibilities for selecting supply chains for projects, programmes and ongoing portfolios across a range of industry sectors ▪ Construction works, capex projects, facilities management, other ongoing services ▪ Work includes: major project management companies and client organisations; ranging from huge multi-nationals to smaller regional and local providers ▪ Range of due diligence approaches and appetites for commercial risk encountered
  • 7.
    Section 1: Insolvency ▪What are bankruptcy and insolvency? ▪ What the potential effects on your project?
  • 8.
    Insolvency – Terminology& Info ▪ Insolvency is a term used for both companies and individuals. ▪ As an individual = Bankruptcy ▪ For a company = Corporate Insolvency Different terminology and; Different rules ▪ See https://www.gov.uk/government/organisations/insolvency- service
  • 9.
    Insolvency – Whatis it? ▪ Company becomes insolvent if it is unable to pay its debts ▪ 2 key tests: – Cash flow – Value of assets versus liabilities Company is technically insolvent if either apply But, they may still be trading Formal insolvency proceedings must be commenced for the company to actually become Formally Insolvent.
  • 10.
    Insolvency – theTypes ▪ Option 1 (when Technically Insolvent) ▪ Informal arrangement with creditors To try to prevent; ▪ 4 different types of Formal Insolvency procedures: – Company Voluntary Arrangement (CVA) – Administration – Administrative Receivership – Liquidation (winding up) (closure) All types run by a qualified and licensed Insolvency Practitioner Insolvency Act 1986
  • 11.
    Type 4 -Liquidation ▪ e.g. Carillion, 2018 https://www.pwc.co.uk/services/business- recovery/administrations/carillion.html ) – Liquidation “winds-up” the company – Stops trading Can either be; – Instigated by the Directors, – Voluntary or Compulsory liquidation, or – Creditors can also apply to wind-up an insolvent company – Overseen by a “Liquidator” ▪ Ends affairs of the company ▪ Assets cashed – “liquidate” ▪ Collect any money owed ▪ Distribute cash
  • 12.
    Insolvency – Whathappens / Who gets paid? ▪ If sufficient funds: ▪ Cash will be distributed to the following; – Fees of the Insolvency Practitioner / Liquidator – Preferential creditors - including employees (e.g. wages) – Prescribed part – max £600K – Fixed charge costs - secured creditors' claims – Unsecured creditors' claims – Shareholders.
  • 13.
    Carillion – TheImpact ▪ Fourteen NHS trusts ▪ Public sector procurement thresholds ▪ Political questioning over delivery models (such as PFI) ▪ 1,141 redundancies ▪ 7,600 jobs transferred to other employers ▪ Multiple public enquiries ▪ Giant pension deficits ▪ Supply chain ▪ Who else relies on their supply chain? ▪ Positive benefits too – review of payment practices
  • 14.
    Insolvency – TheImpact on the PM Delivery Labour issues Material suppliers / ownership Supply chain and sub-contractors Re-procurement Unfinished works Unable to lawfully trade Time-consuming Programme slippage / significant delay Project viability Individuals Uncertainty Pensions / wages / salaries Morale Introspection Self doubt Stressful Customers / Other Organisations Who else needs their projects completing? You’re unlikely to be the only ones affected Do their sub-contractors want paying? Lenders withdraw funding? Client nerves – cancel the project? Perception Media Hear-say Disruption Industry-wide impact / nerves / confidence Delayed investment decisions
  • 15.
    Section 3 –Company Reports ▪ Publicly Available Financial Information ▪ Companies House ▪ https://beta.companieshouse.gov.uk/ – Director details – Financial accounts / Corporate report – Filing history – Charges – Insolvency – Follow companies
  • 16.
    Why look atCompany Reports? ▪ Not just about avoiding insolvency: – General financial standing – Reputation – Quality of work – Can they deliver? – Ability to borrow – Long term outlook
  • 17.
    Corporate Reports ▪ Astatutory requirement ▪ A report to shareholders/funders ▪ The success or otherwise of the operations ▪ Accounts for the performance of management ▪ Enables judgements and decision making for many stakeholders ▪ Not precisely accurate ▪ You can compare trends from year to year
  • 18.
    What is ina Corporate Report? ▪ Profit & Loss Account ▪ Balance Sheet ▪ Cash Flow statement ▪ Notes to the accounts – Explanations and detailed analysis ▪ Governance arrangements ▪ Directors Report (per Companies Act 1985) ▪ Independent Audit Report ▪ Commentary – Interpretations – Statements – Focus points – Implications of the accounting data for the business and it’s objectives – A “Chairman’s Statement”
  • 19.
    Basic Principles tolook out for ▪ Is the business a “going concern”? ▪ Easily understandable? ▪ Are the accounts prudent? ▪ Consistency in approach from year to year ▪ “Off balance sheet” ▪ Utilise Accounting Ratios to get key information
  • 20.
    Accounts – alwaysremember Revenue is vanity Profit is sanity Cash is king
  • 21.
    Other Information onRequest As well as freely available reports, these can be obtained: ▪ Management accounts ▪ Management information ▪ Credit agency reports – Warnings – Advisory notes – Ratings – Maximum aggregate contract values
  • 22.
    About Jon ▪ Chairof C&P SIG for last ten years (on & off). ▪ 25 years C&P experience, but predominantly in use of NEC family of contracts and contract strategy, NOT selecting Providers ▪ Got fed up with paying for low returns and poor advice from financial services sector, so started to do it myself some 6+ years ago ▪ Progressively started to invest directly in public companies ▪ Style : Good to great companies – sustainable growth - at a discount to fair price (GARP). ▪ Filtering process is : financial publications; financial websites; company websites & accounts. ▪ Now APM Trustee Board member and its Investment’s Champion
  • 23.
    What we willlook at Carillion’s ▪ Income Statement ▪ Balance Sheet ▪ Cashflow Statement ▪ Financial Indicators ▪ Other sources over time
  • 24.
    Carillion : theprofits were fine, weren’t they ?
  • 25.
    So how didthis happen ? i.e. was it foreseeable ?
  • 26.
    What is a:Profit & Loss Account ? ▪ Shows transactions during the year ▪ “Matched” and accrued for – Revenues – Costs – Profits ▪ Gross ▪ Operating expense ▪ Net – Taxes – Dividends – Reserves
  • 27.
    Operating Profit (adjusted)195.50 170.10 200.40 200.00 2 Investment Income 34.30 26.50 25.10 26.00 Exceptional Items -1.60 -45.20 -0.30 9.40 - Net Interest -29.10 -40.30 -57.50 -54.30 - Pre-tax Profit 164.80 110.60 142.60 155.10 1 Tax 9.90 4.30 15.10 15.70 Net Profit 154.90 106.30 127.50 139.40 1 Minority Interests 6.10 6.10 6.80 6.60 Profit For Financial Year 148.80 100.20 120.70 132.80 1 Ordinary Dividends 70.40 74.60 75.70 76.80 Non Equity Dividends 0.00 0.00 0.00 0.00 Retained Profit 78.40 25.60 45.00 56.00 Per Share Data DPS p 17.00 17.35 17.60 17.85 Normalized EPS p 35.16 34.71 25.46 26.43 Reported EPS p 34.40 23.20 25.40 28.20 Norm Discontinued EPS p 0.00 0.00 0.00 0.00 Investment Ratios Operating Margin 3.99 4.63 4.18 4.04 DPS Growth % 6.25 2.06 1.44 1.42 Dividend Cover x 2.07 2.00 1.45 1.48 Norm EPS Growth % -8.74 -1.30 -26.63 3.81 Reported EPS Growth % 8.18 -32.56 9.48 11.02 Other Market Cap at B/S Date 1,363.91 1,422.14 1,444.80 1,303.38 1,0 Foreign Turnover 812.90 864.40 861.70 946.90 1,1 Discontinued Turnover 0.00 0.00 0.00 0.00 Discontinued Pre-tax Profit 0.00 0.00 0.00 0.00 Discontinued Post-tax Profit 0.00 0.00 0.00 0.00 Carillion Income Statement Source : morningstar 09Carillion Income statement | CLLN - Morningstar Carillion PLC CLLN Period Show Report Dates View Rounding Export to Excel 5 Years Ascending Income Statement 2012 2013 2014 2015 Fiscal Year Ends 31/12/2012 31/12/2013 31/12/2014 31/12/2015 Turnover 3,666.20 3,332.60 3,493.90 3,950.70 Expenses 3,472.30 3,208.20 3,293.80 3,741.30 EBITDA 251.60 254.00 238.40 238.80 EBIT 189.40 190.50 193.60 193.40 Operating Profit (reported) 193.90 124.40 200.10 209.40 Operating Profit (adjusted) 195.50 170.10 200.40 200.00 Investment Income 34.30 26.50 25.10 26.00 Exceptional Items -1.60 -45.20 -0.30 9.40 Net Interest -29.10 -40.30 -57.50 -54.30 Pre-tax Profit 164.80 110.60 142.60 155.10 Tax 9.90 4.30 15.10 15.70 Net Profit 154.90 106.30 127.50 139.40 Minority Interests 6.10 6.10 6.80 6.60 Profit For Financial Year 148.80 100.20 120.70 132.80 Ordinary Dividends 70.40 74.60 75.70 76.80 Non Equity Dividends 0.00 0.00 0.00 0.00 Retained Profit 78.40 25.60 45.00 56.00 Per Share Data DPS p 17.00 17.35 17.60 17.85 Normalized EPS p 35.16 34.71 25.46 26.43 Reported EPS p 34.40 23.20 25.40 28.20 Norm Discontinued EPS p 0.00 0.00 0.00 0.00 09/03/2018 11:45ome statement | CLLN - Morningstar lion PLC CLLN Show Report Dates View Rounding Export to Excel Ascending e Statement 2012 2013 2014 2015 2016 Ends 31/12/2012 31/12/2013 31/12/2014 31/12/2015 31/12/2016 3,666.20 3,332.60 3,493.90 3,950.70 4,394.90 3,472.30 3,208.20 3,293.80 3,741.30 4,213.00 251.60 254.00 238.40 238.80 255.40 189.40 190.50 193.60 193.40 210.40 Profit (reported) 193.90 124.40 200.10 209.40 181.90 Profit (adjusted) 195.50 170.10 200.40 200.00 215.70 t Income 34.30 26.50 25.10 26.00 36.30 al Items -1.60 -45.20 -0.30 9.40 -23.30 st -29.10 -40.30 -57.50 -54.30 -35.20 ofit 164.80 110.60 142.60 155.10 146.70 9.90 4.30 15.10 15.70 17.20 154.90 106.30 127.50 139.40 129.50 nterests 6.10 6.10 6.80 6.60 5.30 Financial Year 148.80 100.20 120.70 132.80 124.20 Dividends 70.40 74.60 75.70 76.80 78.90 y Dividends 0.00 0.00 0.00 0.00 0.00 rofit 78.40 25.60 45.00 56.00 45.30 e Data 17.00 17.35 17.60 17.85 18.35 d EPS p 35.16 34.71 25.46 26.43 33.01 EPS p 34.40 23.20 25.40 28.20 25.90 ontinued EPS p 0.00 0.00 0.00 0.00 0.00 Profit (reported) 193.90 124.40 200.10 209.40 181.90 Profit (adjusted) 195.50 170.10 200.40 200.00 215.70 t Income 34.30 26.50 25.10 26.00 36.30 al Items -1.60 -45.20 -0.30 9.40 -23.30 st -29.10 -40.30 -57.50 -54.30 -35.20 ofit 164.80 110.60 142.60 155.10 146.70 9.90 4.30 15.10 15.70 17.20 154.90 106.30 127.50 139.40 129.50 nterests 6.10 6.10 6.80 6.60 5.30 Financial Year 148.80 100.20 120.70 132.80 124.20 Dividends 70.40 74.60 75.70 76.80 78.90 y Dividends 0.00 0.00 0.00 0.00 0.00 rofit 78.40 25.60 45.00 56.00 45.30 Data 17.00 17.35 17.60 17.85 18.35 d EPS p 35.16 34.71 25.46 26.43 33.01 EPS p 34.40 23.20 25.40 28.20 25.90 ontinued EPS p 0.00 0.00 0.00 0.00 0.00 nt Ratios Margin 3.99 4.63 4.18 4.04 4.26 h % 6.25 2.06 1.44 1.42 2.80 Cover x 2.07 2.00 1.45 1.48 1.80 Growth % -8.74 -1.30 -26.63 3.81 24.89 EPS Growth % 8.18 -32.56 9.48 11.02 -8.16 p at B/S Date 1,363.91 1,422.14 1,444.80 1,303.38 1,015.83 rnover 812.90 864.40 861.70 946.90 1,100.70 ed Turnover 0.00 0.00 0.00 0.00 0.00 ed Pre-tax Profit 0.00 0.00 0.00 0.00 0.00 ed Post-tax Profit 0.00 0.00 0.00 0.00 0.00 It’s a growth company ! Consistent adjustments cause concern i.e. not ‘exceptional’ ! Last year’s does not add up. Not going up with turnover Depreciation & Amortisation is small for a large company High interest vs Profit
  • 28.
    Per Share datafrom Income Statement Exceptional Items -1.60 -45.20 -0.30 9.40 Net Interest -29.10 -40.30 -57.50 -54.30 Pre-tax Profit 164.80 110.60 142.60 155.10 Tax 9.90 4.30 15.10 15.70 Net Profit 154.90 106.30 127.50 139.40 Minority Interests 6.10 6.10 6.80 6.60 Profit For Financial Year 148.80 100.20 120.70 132.80 Ordinary Dividends 70.40 74.60 75.70 76.80 Non Equity Dividends 0.00 0.00 0.00 0.00 Retained Profit 78.40 25.60 45.00 56.00 Per Share Data DPS p 17.00 17.35 17.60 17.85 Normalized EPS p 35.16 34.71 25.46 26.43 Reported EPS p 34.40 23.20 25.40 28.20 Norm Discontinued EPS p 0.00 0.00 0.00 0.00 Investment Ratios Operating Margin 3.99 4.63 4.18 4.04 DPS Growth % 6.25 2.06 1.44 1.42 Dividend Cover x 2.07 2.00 1.45 1.48 Norm EPS Growth % -8.74 -1.30 -26.63 3.81 Reported EPS Growth % 8.18 -32.56 9.48 11.02 Other Market Cap at B/S Date 1,363.91 1,422.14 1,444.80 1,303.38 Foreign Turnover 812.90 864.40 861.70 946.90 Discontinued Turnover 0.00 0.00 0.00 0.00 Discontinued Pre-tax Profit 0.00 0.00 0.00 0.00 Discontinued Post-tax Profit 0.00 0.00 0.00 0.00 -1.60 -45.20 -0.30 9.40 -23.30 -29.10 -40.30 -57.50 -54.30 -35.20 164.80 110.60 142.60 155.10 146.70 9.90 4.30 15.10 15.70 17.20 154.90 106.30 127.50 139.40 129.50 6.10 6.10 6.80 6.60 5.30 r 148.80 100.20 120.70 132.80 124.20 70.40 74.60 75.70 76.80 78.90 0.00 0.00 0.00 0.00 0.00 78.40 25.60 45.00 56.00 45.30 17.00 17.35 17.60 17.85 18.35 35.16 34.71 25.46 26.43 33.01 34.40 23.20 25.40 28.20 25.90 S p 0.00 0.00 0.00 0.00 0.00 3.99 4.63 4.18 4.04 4.26 6.25 2.06 1.44 1.42 2.80 2.07 2.00 1.45 1.48 1.80 -8.74 -1.30 -26.63 3.81 24.89 % 8.18 -32.56 9.48 11.02 -8.16 e 1,363.91 1,422.14 1,444.80 1,303.38 1,015.83 812.90 864.40 861.70 946.90 1,100.70 0.00 0.00 0.00 0.00 0.00 rofit 0.00 0.00 0.00 0.00 0.00 Profit 0.00 0.00 0.00 0.00 0.00 This reflects the reported and adjusted profit divided by number of shares
  • 29.
    Summary so far ▪As an investor … … loosing interest already. ▪ As an organisation, choosing who to do business with (whether as a key provider or client) … … some amber flags raised already that would want to find out more about.
  • 30.
    What is a:Balance Sheet ? ▪ Shows financial position at a point in time – the end of its financial year ▪ Assets – Fixed (long-term) – valuable for either generating profit or as a sellable item ▪ Land, buildings, plant ▪ Net book value (after depreciation) – Current – Cashable within a year ▪ Cash, stocks, trade debtors – Who are their customers? Are they likely to pay on time? ▪ Claims & liabilities – any amounts owed – Current (due within the year) ▪ Trade creditors, accruals, bank overdraft, taxes, dividends declared – Long-term ▪ Asset minus liabilities = Capital (shareholder’s funds or “equity interest”) ▪ Has the capital increased or decreased since last year? ▪ But does not usually include other more intangible “assets” such as brand power, know-how, skill, morale etc.
  • 31.
    Carillion Balance Statementpart 1 Source : morningstar 09/03/2018 11:46Carillion Balance Sheet | CLLN - Morningstar Carillion PLC CLLN Period Show Report Dates View Rounding Export to Excel 5 Years Ascending Balance Sheet 2012 2013 2014 2015 2016 Fiscal Year Ends 31/12/2012 31/12/2013 31/12/2014 31/12/2015 31/12/2016 Assets Non Current Assets Intangible 1,536.60 1,552.80 1,614.10 1,634.20 1,669.30 Tangible 125.80 128.20 141.90 140.50 144.10 Investments 237.90 159.30 139.90 165.20 180.30 Other 124.50 116.40 147.80 116.50 169.60 Total 2,024.80 1,956.70 2,043.70 2,056.40 2,163.30 Current Assets Stock 55.30 48.60 50.10 64.30 78.80 Debtors 1,122.30 1,216.30 1,328.70 1,272.00 1,674.80 Cash and Securities 660.00 418.30 473.90 476.80 516.20 Total 1,837.60 1,683.20 1,852.70 1,813.10 2,269.80 Held for Disposal 0.00 0.00 0.00 0.00 0.00 Total Assets 3,862.40 3,639.90 3,896.40 3,869.50 4,433.10 Liabilities and Equity Liabilities Current 1,687.80 1,661.60 1,808.20 1,771.60 2,217.40 Non-Current 1,163.90 994.70 1,193.70 1,081.30 1,485.80 Total 2,851.70 2,656.30 3,001.90 2,852.90 3,703.20 Equity Share Capital 236.30 236.30 236.30 236.30 236.30 Reserves 762.60 730.90 636.40 757.20 464.80 Shareholders Funds 998.90 967.20 872.70 993.50 701.10 Minorities 11.80 16.40 21.80 23.10 28.80 09/03/2018 11:46| CLLN - Morningstar LC CLLN Show Report Dates View Rounding Export to Excel Ascending 2012 2013 2014 2015 2016 31/12/2012 31/12/2013 31/12/2014 31/12/2015 31/12/2016 ts 1,536.60 1,552.80 1,614.10 1,634.20 1,669.30 125.80 128.20 141.90 140.50 144.10 237.90 159.30 139.90 165.20 180.30 124.50 116.40 147.80 116.50 169.60 2,024.80 1,956.70 2,043.70 2,056.40 2,163.30 55.30 48.60 50.10 64.30 78.80 1,122.30 1,216.30 1,328.70 1,272.00 1,674.80 es 660.00 418.30 473.90 476.80 516.20 1,837.60 1,683.20 1,852.70 1,813.10 2,269.80 0.00 0.00 0.00 0.00 0.00 3,862.40 3,639.90 3,896.40 3,869.50 4,433.10 1,687.80 1,661.60 1,808.20 1,771.60 2,217.40 1,163.90 994.70 1,193.70 1,081.30 1,485.80 2,851.70 2,656.30 3,001.90 2,852.90 3,703.20 236.30 236.30 236.30 236.30 236.30 762.60 730.90 636.40 757.20 464.80 ds 998.90 967.20 872.70 993.50 701.10 11.80 16.40 21.80 23.10 28.80 Intangibles = Goodwill, Intellectual Property (inc capitalised R&D), Brands etc. Carillion, as a FM/ construction company does not have any obvious IP, Brands etc, so likely to be ‘goodwill’ from purchases. In 2009, Carillion Intangibles went up £220m due to a purchase. Does not appear to be any writing down of goodwill, although is at £45m pa Turnover went up £450m & debtors £400m. Increase is not proportional. Debtor days ? But cash increased. How ?
  • 32.
    Carillion Balance Statementpart 2 Source : morningstar 2,024.80 1,956.70 2,043.70 2,056.40 2,163.30 55.30 48.60 50.10 64.30 78.80 1,122.30 1,216.30 1,328.70 1,272.00 1,674.80 ities 660.00 418.30 473.90 476.80 516.20 1,837.60 1,683.20 1,852.70 1,813.10 2,269.80 al 0.00 0.00 0.00 0.00 0.00 3,862.40 3,639.90 3,896.40 3,869.50 4,433.10 ity 1,687.80 1,661.60 1,808.20 1,771.60 2,217.40 1,163.90 994.70 1,193.70 1,081.30 1,485.80 2,851.70 2,656.30 3,001.90 2,852.90 3,703.20 236.30 236.30 236.30 236.30 236.30 762.60 730.90 636.40 757.20 464.80 unds 998.90 967.20 872.70 993.50 701.10 11.80 16.40 21.80 23.10 28.80 1,010.70 983.60 894.50 1,016.60 729.90 and Equity 3,862.40 3,639.90 3,896.40 3,869.50 4,433.10 155.80 215.20 177.30 169.80 218.90 alue Per Share -124.96 -136.09 -172.32 -148.90 -225.01 29.48 42.08 37.57 43.40 39.28 11.05 11.06 8.62 8.81 10.34 15.60 22.25 20.32 17.09 31.22 Total 2,024.80 1,956.70 2,043.70 Current Assets Stock 55.30 48.60 50.10 Debtors 1,122.30 1,216.30 1,328.70 Cash and Securities 660.00 418.30 473.90 Total 1,837.60 1,683.20 1,852.70 Held for Disposal 0.00 0.00 0.00 Total Assets 3,862.40 3,639.90 3,896.40 Liabilities and Equity Liabilities Current 1,687.80 1,661.60 1,808.20 Non-Current 1,163.90 994.70 1,193.70 Total 2,851.70 2,656.30 3,001.90 Equity Share Capital 236.30 236.30 236.30 Reserves 762.60 730.90 636.40 Shareholders Funds 998.90 967.20 872.70 Minorities 11.80 16.40 21.80 Total 1,010.70 983.60 894.50 Total Liabilities and Equity 3,862.40 3,639.90 3,896.40 Net Borrowings 155.80 215.20 177.30 Investment Ratios Net Tangible Asset Value Per Share -124.96 -136.09 -172.32 ROCE 29.48 42.08 37.57 ROE 11.05 11.06 8.62 Net Gearing 15.60 22.25 20.32 Stock 55.30 48.60 50.10 Debtors 1,122.30 1,216.30 1,328.70 1,27 Cash and Securities 660.00 418.30 473.90 47 Total 1,837.60 1,683.20 1,852.70 1,81 Held for Disposal 0.00 0.00 0.00 Total Assets 3,862.40 3,639.90 3,896.40 3,86 Liabilities and Equity Liabilities Current 1,687.80 1,661.60 1,808.20 1,77 Non-Current 1,163.90 994.70 1,193.70 1,08 Total 2,851.70 2,656.30 3,001.90 2,85 Equity Share Capital 236.30 236.30 236.30 23 Reserves 762.60 730.90 636.40 75 Shareholders Funds 998.90 967.20 872.70 99 Minorities 11.80 16.40 21.80 Total 1,010.70 983.60 894.50 1,01 Total Liabilities and Equity 3,862.40 3,639.90 3,896.40 3,86 Net Borrowings 155.80 215.20 177.30 16 Investment Ratios Net Tangible Asset Value Per Share -124.96 -136.09 -172.32 -14 ROCE 29.48 42.08 37.57 ROE 11.05 11.06 8.62 Net Gearing 15.60 22.25 20.32 Gross Gearing 81.38 65.02 74.40 Cash 65.78 42.77 54.09 6.66 5.85 5.69 ities 660.00 418.30 473.90 476.80 516.20 1,837.60 1,683.20 1,852.70 1,813.10 2,269.80 al 0.00 0.00 0.00 0.00 0.00 3,862.40 3,639.90 3,896.40 3,869.50 4,433.10 ity 1,687.80 1,661.60 1,808.20 1,771.60 2,217.40 1,163.90 994.70 1,193.70 1,081.30 1,485.80 2,851.70 2,656.30 3,001.90 2,852.90 3,703.20 236.30 236.30 236.30 236.30 236.30 762.60 730.90 636.40 757.20 464.80 unds 998.90 967.20 872.70 993.50 701.10 11.80 16.40 21.80 23.10 28.80 1,010.70 983.60 894.50 1,016.60 729.90 and Equity 3,862.40 3,639.90 3,896.40 3,869.50 4,433.10 155.80 215.20 177.30 169.80 218.90 alue Per Share -124.96 -136.09 -172.32 -148.90 -225.01 29.48 42.08 37.57 43.40 39.28 11.05 11.06 8.62 8.81 10.34 15.60 22.25 20.32 17.09 31.22 81.38 65.02 74.40 63.61 98.23 65.78 42.77 54.09 46.52 67.01 Amounts it owes (debt) has gone up by £850m (on £4.5bn turnover), and amount it is owed (from previous) went up by £400m, Stock 55.30 48.60 50.10 Debtors 1,122.30 1,216.30 1,328.70 Cash and Securities 660.00 418.30 473.90 Total 1,837.60 1,683.20 1,852.70 Held for Disposal 0.00 0.00 0.00 Total Assets 3,862.40 3,639.90 3,896.40 Liabilities and Equity Liabilities Current 1,687.80 1,661.60 1,808.20 Non-Current 1,163.90 994.70 1,193.70 Total 2,851.70 2,656.30 3,001.90 Equity Share Capital 236.30 236.30 236.30 Reserves 762.60 730.90 636.40 Shareholders Funds 998.90 967.20 872.70 Minorities 11.80 16.40 21.80 Total 1,010.70 983.60 894.50 which is reflected in Net Value 1,837.60 1,683.20 1,852.70 1,813.10 2,269.80 sal 0.00 0.00 0.00 0.00 0.00 3,862.40 3,639.90 3,896.40 3,869.50 4,433.10 uity 1,687.80 1,661.60 1,808.20 1,771.60 2,217.40 1,163.90 994.70 1,193.70 1,081.30 1,485.80 2,851.70 2,656.30 3,001.90 2,852.90 3,703.20 236.30 236.30 236.30 236.30 236.30 762.60 730.90 636.40 757.20 464.80 Funds 998.90 967.20 872.70 993.50 701.10 11.80 16.40 21.80 23.10 28.80 1,010.70 983.60 894.50 1,016.60 729.90 and Equity 3,862.40 3,639.90 3,896.40 3,869.50 4,433.10 155.80 215.20 177.30 169.80 218.90 s Value Per Share -124.96 -136.09 -172.32 -148.90 -225.01 29.48 42.08 37.57 43.40 39.28 11.05 11.06 8.62 8.81 10.34 15.60 22.25 20.32 17.09 31.22 However, a large part of that Net Value is ‘old’ (and worthless) intangibles (goodwill). So what is it actually worth per share ?
  • 33.
    Some other BalanceSheet Ratios Non-Current 1,163.90 994.70 1,193.70 1,081.30 Total 2,851.70 2,656.30 3,001.90 2,852.90 Equity Share Capital 236.30 236.30 236.30 236.30 Reserves 762.60 730.90 636.40 757.20 Shareholders Funds 998.90 967.20 872.70 993.50 Minorities 11.80 16.40 21.80 23.10 Total 1,010.70 983.60 894.50 1,016.60 Total Liabilities and Equity 3,862.40 3,639.90 3,896.40 3,869.50 Net Borrowings 155.80 215.20 177.30 169.80 Investment Ratios Net Tangible Asset Value Per Share -124.96 -136.09 -172.32 -148.90 ROCE 29.48 42.08 37.57 43.40 ROE 11.05 11.06 8.62 8.81 Net Gearing 15.60 22.25 20.32 17.09 Gross Gearing 81.38 65.02 74.40 63.61 Cash 65.78 42.77 54.09 46.52 Interest Cover x 6.66 5.85 5.69 4.44 Quick Ratio r 1.06 0.98 1.00 0.99 Current Ratio r 1.09 1.01 1.03 1.02 Borrowings Total Borrowings 812.90 628.90 649.30 632.00 Due < 1 Yr 35.30 22.50 35.30 33.50 Due 1-2 Yrs 0.00 0.00 0.00 0.00 Due 2-5 Yrs 0.00 0.00 0.00 0.00 Due > 5 Yrs 3.60 3.10 2.50 0.00 GBP in Millions except per share data. Figures from 2004 in accordance with IFRS, 2015: 0.00000, 2014: 0.00000 1,687.80 1,661.60 1,808.20 1,771.60 2,217.40 1,163.90 994.70 1,193.70 1,081.30 1,485.80 2,851.70 2,656.30 3,001.90 2,852.90 3,703.20 236.30 236.30 236.30 236.30 236.30 762.60 730.90 636.40 757.20 464.80 998.90 967.20 872.70 993.50 701.10 11.80 16.40 21.80 23.10 28.80 1,010.70 983.60 894.50 1,016.60 729.90 quity 3,862.40 3,639.90 3,896.40 3,869.50 4,433.10 155.80 215.20 177.30 169.80 218.90 er Share -124.96 -136.09 -172.32 -148.90 -225.01 29.48 42.08 37.57 43.40 39.28 11.05 11.06 8.62 8.81 10.34 15.60 22.25 20.32 17.09 31.22 81.38 65.02 74.40 63.61 98.23 65.78 42.77 54.09 46.52 67.01 6.66 5.85 5.69 4.44 4.95 1.06 0.98 1.00 0.99 0.99 1.09 1.01 1.03 1.02 1.02 812.90 628.90 649.30 632.00 688.70 35.30 22.50 35.30 33.50 96.70 0.00 0.00 0.00 0.00 0.00 0.00 0.00 0.00 0.00 0.00 3.60 3.10 2.50 0.00 0.00 share data. Total 2,851.70 2,656.30 3,001.90 2,852.90 Equity Share Capital 236.30 236.30 236.30 236.30 Reserves 762.60 730.90 636.40 757.20 Shareholders Funds 998.90 967.20 872.70 993.50 Minorities 11.80 16.40 21.80 23.10 Total 1,010.70 983.60 894.50 1,016.60 Total Liabilities and Equity 3,862.40 3,639.90 3,896.40 3,869.50 Net Borrowings 155.80 215.20 177.30 169.80 Investment Ratios Net Tangible Asset Value Per Share -124.96 -136.09 -172.32 -148.90 ROCE 29.48 42.08 37.57 43.40 ROE 11.05 11.06 8.62 8.81 Net Gearing 15.60 22.25 20.32 17.09 Gross Gearing 81.38 65.02 74.40 63.61 Cash 65.78 42.77 54.09 46.52 Interest Cover x 6.66 5.85 5.69 4.44 Quick Ratio r 1.06 0.98 1.00 0.99 Current Ratio r 1.09 1.01 1.03 1.02 Borrowings Total Borrowings 812.90 628.90 649.30 632.00 Due < 1 Yr 35.30 22.50 35.30 33.50 Due 1-2 Yrs 0.00 0.00 0.00 0.00 Due 2-5 Yrs 0.00 0.00 0.00 0.00 Due > 5 Yrs 3.60 3.10 2.50 0.00 GBP in Millions except per share data. Figures from 2004 in accordance with IFRS, 2015: 0.00000, 2014: 0.00000 2,851.70 2,656.30 3,001.90 2,852.90 3,703.20 236.30 236.30 236.30 236.30 236.30 762.60 730.90 636.40 757.20 464.80 998.90 967.20 872.70 993.50 701.10 11.80 16.40 21.80 23.10 28.80 1,010.70 983.60 894.50 1,016.60 729.90 quity 3,862.40 3,639.90 3,896.40 3,869.50 4,433.10 155.80 215.20 177.30 169.80 218.90 er Share -124.96 -136.09 -172.32 -148.90 -225.01 29.48 42.08 37.57 43.40 39.28 11.05 11.06 8.62 8.81 10.34 15.60 22.25 20.32 17.09 31.22 81.38 65.02 74.40 63.61 98.23 65.78 42.77 54.09 46.52 67.01 6.66 5.85 5.69 4.44 4.95 1.06 0.98 1.00 0.99 0.99 1.09 1.01 1.03 1.02 1.02 812.90 628.90 649.30 632.00 688.70 35.30 22.50 35.30 33.50 96.70 0.00 0.00 0.00 0.00 0.00 0.00 0.00 0.00 0.00 0.00 3.60 3.10 2.50 0.00 0.00 share data. rdance with IFRS, 2015: 0.00000, 2014: 0.00000
  • 34.
    Balance Sheet ·Income Statement · CashfloFinancial Summary Year End 31st Dec 2011 2012 2013 2014 2015 2016 2017E 2018E CAGR / A Revenue £m 4,153 3,666 3,333 3,494 3,951 4,395 4,954 5,100 +1.1 Operating Profit £m 146.7 192.7 150.2 190.2 206.9 196.4 +6.0 Net Profit £m 134.6 148.8 100.2 120.7 132.8 124.2 142.4 150.1 -1.6 EPSReported p 31.8 34.4 23.2 25.4 28.0 26.1 -3.8 EPSNormalised p 46.0 34.7 33.7 27.2 32.1 32.0 34.0 35.3 -7.0 EPSGrowth % +30.9 -24.6 -2.8 -19.2 +17.9 -0.2 +6.15 +3.68 PERatio x 7.26 6.84 6.60 x 1.18 1.86 2.28 Profitability % 3.5 5.3 4.5 5.4 5.2 4.5 +4.7 % 3.9 2.7 3.2 3.4 3.0 % 8.0 8.9 7.6 9.1 9.9 8.9 +8.7 % 15.1 10.2 13.1 14.2 14.7 +13.5 Cashflow p 24.4 -5.92 -18.2 26.1 15.4 15.4 -8.8 p 2.98 4.23 6.51 6.07 6.40 7.85 +21.4 p 21.4 -10.2 -24.7 20.0 9.03 7.57 -18.8 Last ex-div: 11th May, paid: 9th Jun more Year End 31st Dec 2011 2012 2013 2014 2015 2016 2017E 2018E CAGR / A £m 4,153 3,666 3,333 3,494 3,951 4,395 4,954 5,100 +1.1 £m 146.7 192.7 150.2 190.2 206.9 196.4 +6.0 £m 134.6 148.8 100.2 120.7 132.8 124.2 142.4 150.1 -1.6 p 31.8 34.4 23.2 25.4 28.0 26.1 -3.8 p 46.0 34.7 33.7 27.2 32.1 32.0 34.0 35.3 -7.0 % +30.9 -24.6 -2.8 -19.2 +17.9 -0.2 +6.15 +3.68 x 7.26 6.84 6.60 x 1.18 1.86 2.28 Profitability % 3.5 5.3 4.5 5.4 5.2 4.5 +4.7 % 3.9 2.7 3.2 3.4 3.0 % 8.0 8.9 7.6 9.1 9.9 8.9 +8.7 ROE % 15.1 10.2 13.1 14.2 14.7 +13.5 Cashflow Op. Cashflow ps p 24.4 -5.92 -18.2 26.1 15.4 15.4 -8.8 Capex ps p 2.98 4.23 6.51 6.07 6.40 7.85 +21.4 Free Cashflow ps p 21.4 -10.2 -24.7 20.0 9.03 7.57 -18.8 Dividends Dividend ps p 16.9 17.3 17.5 17.8 18.3 18.5 18.9 19.1 +1.8 Dividend Growth % +9.03 +2.07 +1.45 +1.43 +2.82 +1.10 +2.17 +1.48 % 7.93 8.10 8.22 x 1.88 2.00 1.33 1.43 1.53 1.42 1.80 1.84 Balance Sheet Cashflow statement vs Income Statement Source : Stockopedia Last ex-div: 11th May, paid: 9th Jun more p 31.8 34.4 23.2 25.4 28.0 26.1 -3.8 p 46.0 34.7 33.7 27.2 32.1 32.0 34.0 35.3 -7.0 % +30.9 -24.6 -2.8 -19.2 +17.9 -0.2 +6.15 +3.68 x 7.26 6.84 6.60 x 1.18 1.86 2.28 Profitability % 3.5 5.3 4.5 5.4 5.2 4.5 +4.7 % 3.9 2.7 3.2 3.4 3.0 % 8.0 8.9 7.6 9.1 9.9 8.9 +8.7 % 15.1 10.2 13.1 14.2 14.7 +13.5 Cashflow p 24.4 -5.92 -18.2 26.1 15.4 15.4 -8.8 p 2.98 4.23 6.51 6.07 6.40 7.85 +21.4 p 21.4 -10.2 -24.7 20.0 9.03 7.57 -18.8 Dividends p 16.9 17.3 17.5 17.8 18.3 18.5 18.9 19.1 +1.8 % +9.03 +2.07 +1.45 +1.43 +2.82 +1.10 +2.17 +1.48 % 7.93 8.10 8.22 Dividend Cover x 1.88 2.00 1.33 1.43 1.53 1.42 1.80 1.84 Balance Sheet £m 495 659.6 416.1 473.9 462.2 469.8 -1.0 £m -188.3 149.8 21.6 44.5 41.7 52.4 We’ve covered this. “Owner’s earning” are consistently much much less than earnings. Cash conversion is appalling. Dividend is not normally being covered by FCF
  • 35.
  • 36.
    But that’s notall … A+ Liquidity (ttm) Curr. Ratio 1.02 Quick Ratio 0.99 Interest Cov. 23.1 Efficiency (ttm) Asset Turnover 1.04 Rec's Turnover 3.82 Stock Turnover 56.5 Other Ratios Leverage (ttm) total -intang +pension Gross Gearing % 98.2 213 Net Gearing % 31.2 146 Cash / Assets % 10.6 12.9 Latest interim period (ended 31st Dec '16) vs. prior year Sales Growth 16.0 % EPSGrowth -44.3 % Everything I have said so far ignores Carillion’s pension deficit. How was it going to finance that ?
  • 37.
  • 38.
    Some indicators for2016’s accounts 5PiotroskiF-Score 1.01Altman Z2-Score Health Trend BankruptcyRisk EarningsManipulation Risk A+ The Piotroski F-Score is a nine-criteria scoring system, each of which relate to the change in a ratio based on the company's accounts. The weakest stocks, scoring 2 or lower, are five times more likely to fall into financial problems. The Bankruptcy Risk Meter is a visual representation of how likely a company is to head into serious financial difficulty within 2 years. The metric is derived from the Altman Z-Score, a statistical indicator generated from balance sheet ratios. Tests have shown that the Distress Zone is 80-90% accurate in predicting bankruptcy. The Earnings Manipulation Risk Indicator gives a representation of how likely a company has been manipulating accounts to inflate earnings. It is based on the Beneish M-Score, derived from a set of 8 ratios from a company's accounts. If the switch is on, Beneish's research implies an 86% probability that the firm is manipulating earnings.
  • 39.
    Table&showing&trend Altman' Date For'2013'(at'08/04/14)' 1.63 For'2014'(at'04/04/15) 1.47 For'2015'(at'09/04/16)1.56 For'2016'(at'14/03/17) 1.01 Mid'2017'(at'05/08/17) 0.80 End'2017'(at'02/12/17) )3.45
  • 40.
    Who could haveseen this coming? The company Percentage of equity which has been shorted Carillion 27.2 per cent Ocado Group 19.5 per cent WM Morrison Supermarkets 16.1 per cent Wood Group 12.3 per cent Tullow Oil 12.2 per cent Debenhams 12 per cent Marks and Spencer 10.8 per cent Mitie Group 10.6 per cent Lancashire Holdings 9 per cent Pets at Home 8.8 per cent Sainsbury's 8.7 per cent Hansteen Holding 8.3 per cent “The dirty dozen”: Source: City AM 25th July 2017 Info: Short selling is the sale of a security that is not owned by the seller or that the seller has borrowed. Short selling is motivated by the belief that a security's price will decline, enabling it to be bought back at a lower price to make a profit.
  • 41.
    Interpreting Ratios –Caution! – Ratios offer a simple explanation – Beware coming to wrong conclusions – See them as a “guide” to make conclusions – they are not conclusive proof of anything – Take professional and qualified advice – The bigger your project / package / risk; the more advice would be warranted – A Corporate Report provides a “true and fair view” – it is reliable but it is not perfect – Beware; accounting policies, valuation methods, effect of goodwill, brand equity, estimation, optimism bias, sophistication of notes. Ask further questions, dig deeper, look for trends, check / test your findings, seek professional help if it doesn’t make sense &/or not happy with answers.
  • 42.
    Section 5 :Typical Financial Due Diligence Activities ▪ Prioritizing ▪ A look at common Financial Due Diligence approaches ▪ Do they go far enough? ▪ Is it done at the best time? ▪ Do we understand what the provider’s responses are telling us? ▪ Risk Appetite
  • 43.
    Priorities ▪ C&P Guide(chapter 3) ▪ Prioritising high priority or high risk packages
  • 44.
    Priorities and Risk? ▪Do we assess the package risk? ▪ E.g. particular suppliers or sectors? – Less frequently used items – Are they cash-dependent trades? – Long lead times, specialisms – Is there any choice? – Mission critical – Heavily reliant on one particular customer type? – FMJ.co.uk (March 2018) “The UK FTSE support services sector issued 42 profit warnings in 2017 – the most of any sector”
  • 45.
    General Risk Factors ▪Some of the risk factors identified by an EY report: – Delays and cancellations – Other clients and their reputations – Pricing / inflationary pressures – Heavy exposure to public sector, with unrealistic funding expectations – Problem contracts – Increasing turnover with stagnant or decreasing profit – Profit warnings – Uncertainties – Potential Brexit impacts – Increasing competition – Slow growth in their sector – Changes in their sector
  • 46.
    Common Approaches ▪ Principlein English Law: “Caveat Emptor” (Buyer Beware) ▪ It’s Up to You
  • 47.
    Financial Due Diligenceoptions Private Sector – Request their Financial Accounts – Credit agency reports – Companies House research – Company specific PQQS – Industry standard PQQs – Accreditation bodies – Industry schemes
  • 48.
    Industry Standard PQQs –Bsi: PAS 91:2013 – Construction ▪ A standardised pre-qualification questionnaire ▪ Reduce duplication ▪ Updated late 2017 ▪ To be eligible for prequalification, it is necessary that: – suppliers are able to demonstrate ….. financial and other essential capabilities Core Modules ▪ C2 Financial Information – 2 years audited accounts for medium and large companies ▪ C3 Business & Professional Standing – Criminal or court action, including for bankruptcy proceedings – Alternate questions available for public sector, including the grounds for: » mandatory exclusion; such as failure to pay taxes or social security contributions. » Discretionary exclusion; such as bankruptcy, insolvency,
  • 49.
    Accreditation bodies /Schemes – Various industry bodies / organisations – Many focused on Health and Safety – Check what methods they use – A “Questionnaire” is just the start
  • 50.
    Financial Due Diligenceoptions Public Contracts Regulations 2015 ▪ Mandatory and discretionary exclusions for non-payment of taxes etc ▪ Discretionary exclusions – where the economic operator is bankrupt or is the subject of insolvency or winding-up proceedings, ……. ▪ Selection Criteria – related and proportionate to the subject-matter of the contract – contracting authorities may impose requirements ensuring that economic operators possess the necessary economic and financial capacity to perform the contract – The minimum yearly turnover that economic operators are required to have shall not exceed twice the estimated contract value – Ratios, for example that between assets and liabilities, may be taken into consideration where the contracting authority specifies the methods and criteria for such consideration in the procurement documents
  • 51.
    Section 6 – Whatelse could we do? – When could we do it?
  • 52.
    When do wedo Financial Due diligence? – Prior to tender? – As part of the tender? – After tender (and hopefully prior to award)? – Ongoing (after award)? – NB. There may be Public Sector restrictions on your project
  • 53.
  • 54.
    Reviewing Responses –The Outcome – If you identify an issue, what is the governance to ensure it is addressed? – Risk appetite – no “one size fits all” answer – The more due diligence you do, the more costly the process (at least in the short term) – But, much cheaper to avoid a bad deal in the long run
  • 55.
    What more canwe do - Summary 1. Do you currently apply Financial Due Diligence to all contracts? 2. Is it the same process / level of diligence applied for all contracts? 3. When do you do your due diligence? 4. Are we restricted in the selection criteria available to us? 5. Do you perform due diligence on their sub-contractors? 6. Are ongoing financial updates made during contract implementation to check if anything has changed? 7. Are recommendations (following due diligence) formalised?
  • 56.
    Summary ▪ Insolvency canbe debilitating for your project ▪ There are various sources of information about a companies solvency ▪ Do we do due diligence and is it proportionate to the situation? ▪ Do we actually review the responses and act on the information? ▪ This is the first of a series of seminars by the Contracts & Procurement SIG on spotting the warning signs, taking practical steps to protect your organization and project, and dealing with Provider insolvency.
  • 57.
    This presentation wasdelivered at an APM webinar To find out more about upcoming webinars please visit our website www.apm.org.uk/events