Cows and fish 2009 29 communicating ecological worth $50,000
•
0 likes•290 views


Recommended
More Related Content
What's hot
What's hot (17)
Similar to Cows and fish 2009 29 communicating ecological worth $50,000
Similar to Cows and fish 2009 29 communicating ecological worth $50,000 (20)
More from Alberta Real Estate Foundation
More from Alberta Real Estate Foundation (19)
Recently uploaded
Recently uploaded (20)
Cows and fish 2009 29 communicating ecological worth $50,000
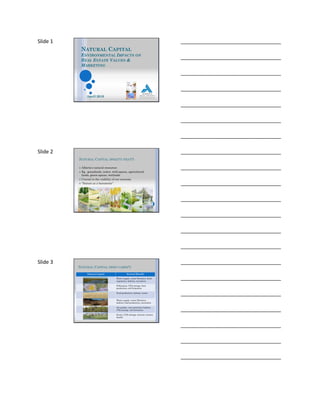
- 1. Cows and Fish www.cowsandfish.org Slide 1 ___________________________________ NATURAL CAPITAL ENVIRONMENTAL IMPACTS ON REAL ESTATE VALUES & ___________________________________ MARKETING ___________________________________ ___________________________________ April 2010 ___________________________________ ___________________________________ ___________________________________ Slide 2 ___________________________________ NATURAL CAPITAL (WHAT’S THAT?) Alberta’s natural resources ___________________________________ Eg. grasslands, water, wild spaces, agricultural lands, green spaces, wetlands Crucial to the viability of our economy “Nature as a barometer” ___________________________________ ___________________________________ ___________________________________ ___________________________________ ___________________________________ Slide 3 ___________________________________ NATURAL CAPITAL (WHO CARES?) Natural Capital Societal Benefit Water supply, water filtration, flood regulation, habitat, recreation ___________________________________ Pollination, CO2 storage, food production, soil formation Food production, habitat, scenic ___________________________________ Water supply, water filtration, habitat, food production, recreation Air quality, raw materials, habitat, CO2 storage, soil formation ___________________________________ Scenic, CO2 storage, tourism, human health ___________________________________ ___________________________________ ___________________________________
- 2. Slide 4 LOSS OF NATURAL ___________________________________ CAPITAL Degraded water quality Increased water ___________________________________ treatment costs Habitat loss (fish and aquatic species) ___________________________________ ___________________________________ ___________________________________ ___________________________________ ___________________________________ Slide 5 LOSS OF NATURAL ___________________________________ CAPITAL Increased flood risks Increased insurance ___________________________________ costs Decreased property values ___________________________________ ___________________________________ ___________________________________ ___________________________________ ___________________________________ Slide 6 LOSS OF NATURAL ___________________________________ CAPITAL Decreased agricultural production ___________________________________ Loss of land Decreased water storage ___________________________________ ___________________________________ ___________________________________ ___________________________________ ___________________________________
- 3. Slide 7 ___________________________________ VALUING NATURAL CAPITAL “Treemendous Values” Home values next to protected riparian corridors ___________________________________ increase 6% to 32% (3 studies) Parks & green space added as much as $11,000 to the value of adjacent properties (Surrey, BC) Each % increase in tree cover added $784 to the property value, with the average value of tree canopy ___________________________________ across 600 sites is $20,226 or 10.7% of the sale (Ohio) Houses abutting or looking into areas of urban natural capital resell faster ___________________________________ ___________________________________ ___________________________________ ___________________________________ Slide 8 ___________________________________ ASSESSING PROXIMATE VALUE OF PARKS & OPEN SPACE TO RESIDENTIAL PROPERTIES IN ALBERTA 6 Alberta towns/cities Proximate premiums ___________________________________ range from high of over 15% to low of less than 1% High premium parks combine well managed ___________________________________ stormwater features, with a view & privacy Low premium parks are smaller, active parks (eg. playgrounds/sports ___________________________________ fields) associated with noise & privacy intrusion ___________________________________ ___________________________________ ___________________________________ Slide 9 ___________________________________ ASSESSING PROXIMATE VALUE OF PARKS & OPEN SPACE TO RESIDENTIAL PROPERTIES IN ALBERTA ___________________________________ “Sherwood Park lots that command the highest assessment (proximate) premiums are those with views overlooking a wetland” ___________________________________ - ___________________________________ ___________________________________ ___________________________________ ___________________________________
- 4. Slide 10 ___________________________________ VALUING NATURAL CAPITAL – IN ALBERTA City of Edmonton 53% higher median house price for single detached ___________________________________ homes located near the North Saskatchewan River; 21% higher for apartments (2006) ___________________________________ ___________________________________ ___________________________________ ___________________________________ ___________________________________ Slide 11 VALUING NATURAL CAPITAL – IN ALBERTA ___________________________________ CITY OF EDMONTON RIVER VALLEY Low Estimate High Estimate Service Ecosystem Millions Air quality / Forest $4.2 $156.0 ___________________________________ filtration: Water quality / Wetlands / riparian $0.1 $0.4 purification areas Stormwater Forest $66.9 $66.9 management Erosion control Forest $4.9 $4.9 ___________________________________ Carbon Forest, shrubland, $7.1 $35.5 sequestration grassland Pest control Valley $0.8 $0.8 Total $84.0 $264.5 ___________________________________ ___________________________________ ___________________________________ ___________________________________ Slide 12 ___________________________________ VALUING NATURAL CAPITAL “Treemendous Savings” Forested neighborhoods (min ___________________________________ 40% forested canopy) save homeowners at least 4% in heating costs in the winter and 10% on cooling costs in the summer ___________________________________ ___________________________________ ___________________________________ ___________________________________ ___________________________________
- 5. Slide 13 ___________________________________ VALUING NATURAL CAPITAL “Treemendous Benefits” Increased tax revenue Decrease water treatment facility costs / upgrades ___________________________________ Decrease costs associated with flooding Decreased noise levels ___________________________________ ___________________________________ ___________________________________ ___________________________________ ___________________________________ Slide 14 ___________________________________ VALUING NATURE - WETLANDS Water Treatment & Flood Control ___________________________________ Savings: SFU study: value of intact lower Fraser River Valley wetlands in BC at 230 million/year in saved infrastructure costs Permanent plant cover reduce H20 treatment costs: ___________________________________ $5.60/hectare/yr saved for sediment filtration $23.50/hectare/yr saved for phosphorus filtration Grand River watershed, ON Flood damage costs fall by ~20% when cultivated ___________________________________ ag lands converted to permanent cover ___________________________________ ___________________________________ ___________________________________ Slide 15 ___________________________________ VALUING NATURE - WETLANDS New York City – paid ~ $1.8 billion to private ___________________________________ landowners to protect roughly 70,000 acres in the Catskills watershed saved the city nearly $8 billion in capital outlays for the development of a new water ___________________________________ filtration plant, as well as additional $200 - $300 million per year in operating costs. ___________________________________ ___________________________________ ___________________________________ ___________________________________
- 6. Slide 16 ___________________________________ NATURAL CAPITAL – AT THE LAKE Protection of water quality – good for fish, fewer algal blooms, improved ___________________________________ recreational opportunities Wildlife habitat and viewing opportunities Public safety – swimming, fishing ___________________________________ Improved protection from water level fluctuations & flood ___________________________________ ___________________________________ ___________________________________ ___________________________________ Slide 17 NATURAL CAPITAL – ON ___________________________________ THE FARM Local food security Viable agricultural industry ___________________________________ Pasture productivity Clean water ___________________________________ ___________________________________ ___________________________________ ___________________________________ ___________________________________ Slide 18 ___________________________________ NATURAL CAPITAL – IN THE CITY Access to recreation Proximity promotes exercise ___________________________________ Decrease to health care costs ___________________________________ ___________________________________ ___________________________________ ___________________________________ ___________________________________
- 7. Slide 19 ___________________________________ NATURAL CAPITAL – IN THE CITY Boost to local economy Attract business and residents ___________________________________ Good parks encourage tourism ___________________________________ ___________________________________ ___________________________________ ___________________________________ ___________________________________ Slide 20 ___________________________________ WHAT’S A WETLAND WORTH? Value of world’s ecosystem services and natural capital = US $16 to 54 trillion ___________________________________ ___________________________________ ___________________________________ ___________________________________ ___________________________________ ___________________________________ Slide 21 ___________________________________ WHAT’S A WETLAND WORTH? $430 million = value of wetland ecosystem services associated with nutrient removal and carbon sequestration lost between 1968 and 2005 ___________________________________ as a result of wetland drainage in Manitoba. $15 million = cost to replace the ecosystem services lost in Manitoba in 2005 ___________________________________ ___________________________________ ___________________________________ ___________________________________ ___________________________________
- 8. Slide 22 ___________________________________ In Canada we have “national economic accounts” whose sum = Gross National Product Where are the “national ecological accounts” to define, ___________________________________ measure & track ecological activities, whose sum = Gross National Waste Preston Manning, National Stewardship & Conservation Conference, 2009, Calgary, AB ___________________________________ ___________________________________ ___________________________________ ___________________________________ ___________________________________ Slide 23 ___________________________________ NATURAL CAPITAL: HEALTH EQUALS WEALTH ___________________________________ ___________________________________ ___________________________________ ___________________________________ ___________________________________ ___________________________________ Slide 24 ___________________________________ WHAT IS ECOLOGICAL HEALTH? Health = properly functioning condition ___________________________________ Ability of a lake, wetland, creek or river to perform ecological functions (building habitat, forage, shelter, filtering water) ___________________________________ Indicators to health (eg. amphibians, vegetation, water quality) ___________________________________ ___________________________________ ___________________________________ ___________________________________
- 9. Slide 25 WHAT DOES ECOLOGICAL HEALTH LOOK ___________________________________ LIKE? GREEN is not always GOOD ___________________________________ ___________________________________ ___________________________________ ___________________________________ ___________________________________ ___________________________________ Slide 26 ___________________________________ KEY CHARACTERISTICS OF HEALTH Vegetation – mix short, medium, tall Very few weeds (dandelion, thistle) Generally shrubs (willows), sometimes trees, plus ___________________________________ other grasses, cattails, wildflowers. ___________________________________ ___________________________________ ___________________________________ ___________________________________ ___________________________________ Slide 27 Contact Us ___________________________________ Kelsey Spicer-Rawe, Riparian Specialist Cows and Fish Red Deer/Airdrie 403-340-7693 ___________________________________ kspicer@cowsandfish.org Kerri O’Shaughnessy, Riparian Specialist Cows and Fish Edmonton 780-720-8289 ___________________________________ koshaugh@cowsandfish.org Norine Ambrose, Program Manager Cows and Fish Lethbridge ___________________________________ 403-381-5538 nambrose@cowsandfish.org ___________________________________ ___________________________________ ___________________________________
- 10. Slide 28 Contact Us ___________________________________ Amanda Halawell, Riparian/Range Specialist Cows and Fish Calgary 403-275-4400 ___________________________________ abogen@cowsandfish.org Kathryn Hull, Riparian/Range Specialist Cows and Fish Calgary 403-275-4400 ___________________________________ khull@cowsandfish.org Michael Gerrand, Riparian Specialist Cows and Fish Lethbridge/Pincher Creek ___________________________________ 403-627-3412 mgerrand@cowsandfish.org ___________________________________ ___________________________________ ___________________________________ Slide 29 Contact Us ___________________________________ www.cowsandfish.org ___________________________________ • publications / factsheets • riparian health checklists • community stewardship ideas • digital stories / videos ___________________________________ • donations ___________________________________ ___________________________________ ___________________________________ ___________________________________ Slide 30 Cows and Fish References ___________________________________ All available from: www.cowsandfish.org/publications ___________________________________ 1. Caring for the Green Zone – Riparian Areas and Grazing Management 2. Caring for the Green Zone – A User’s Guide to Health 3. Riparian Health Checklist – Lakes & Wetlands, Creeks & Steams ___________________________________ 4. Crops, Creeks & Sloughs 5. Value of Wetlands 6. Protecting Shorelines & Streambanks Naturally 7. Growing Restoration – Natural Fixes to Fortify Streambanks ___________________________________ 8. Biodiversity and Riparian Areas – Life in the Green Zone 9. Water Quality and Riparian Areas ___________________________________ ___________________________________ ___________________________________
- 11. Slide 31 Quick References ___________________________________ 1. Green Communities Guide – Land Stewardship Centre of Canada (www.landstewardship.org) 2. Green Among the Concrete – Canada West Foundation (www.cwf.ca) ___________________________________ 3. Conservation: An Investment that Pays: The Economic Benefit of Parks and Open Space – The Trust for Public Land (USA) (www.tpl.org) 4. The Montana Watercourse - (www.mtwatercourse.org) 5. Natural Values: Linking the Environment to ___________________________________ the Economy. Factsheet #13: Urban Natural Capital – Ducks Unlimited Canada (www.ducks.ca) 6. Urban Forest Values: Economic Benefits of Trees in Cities – University of Washington ___________________________________ (www.cfr.washington.edu/research/envmind) 7. Room to Roam – Montana (www.montana.edu/setback/) ___________________________________ ___________________________________ ___________________________________ Slide 32 Quick References ___________________________________ 8. Centre for Watershed Protection (USA) (www.cwp.org) 9. Heritage Hills Wetland Project – Strathcona County (www.strathcona.ab.ca) ___________________________________ 10. Valuation of Tree Canopy on Property Values of Six Communities in Cincinatti, Ohio. Dimke, Kelly C. (www.etd.ohiolink.edu) 11. Riparian Areas Generate Property Value Premiums for Landowners – University of Arizona. Colby & Wishart. ___________________________________ 12. Caring for Shoreline Properties – Alberta Conservation Association (www.ab-conservation.com) ___________________________________ ___________________________________ ___________________________________ ___________________________________