SlideShare a Scribd company logo
1 of 73
What is Power BI
Power BI is a self-serviced, cloud-based reporting, Data visualization, Business Intelligence
software
Self Service-if you are able to complete your work by doing Drag& Drop, Point& Click. That Kind
of software you call it as Self-Service software.
What is reporting/ Data Visualization:
Presenting the data in the form of image (Visualizations--There are 200 plus visualizations in
Power BI) is called Data Visualization. (End users can understand the data within seconds)
Presenting the data in a structured format as we can call as Reporting.
For ex: If customer wants the sales by region means you can take a tabular visual and drag Sales
and Region columns to it. There are many visual are there. We can show data in many
structured visual forms. Just I taken Table example here.
Here you can observe some visuals, then where are other visuals means you can right click on
highliated part (…) of below screen after you will able to see like other screen
After clicking more visuals it will navigate to market place, there you can see lot of visuals. And
you can add visuals to power bi desktop.
(Hardly tableau have 50plus visualizations. This is also one of the differences between the
Power BI and tableau.)
Data analytics: if you have million of records and top of it you want to calculate some of sales,
then how will you do you cannot manually do sum, in this case you need some data analytic
software. this case power Bi will take care of it. Power Bi has a feature
When you call data analyticsoftware—with the help of some software you are able to analyze
huge volume of data. We call the software is called Data analytic software.
Power Bi is a tool where you can load millions of data and you can perform analysis on the data.
Business Intelligence: BI is the process which converts business data into actionable item.
Business data means-=OLTP systems Actionable Item= Reports/Dashboards
Company-Amazon
Business-E commerce
Business data-Generally what type of business data E commerce company have
Like-how many sales are happened in last year, how many orders cancelled. And etc.
OLTP ETL OLAP Reports/Dashboard Sharing
with client -Entire this process is called Business Intelligence.
By using all Power Bi components, we can do BI activities.
Power Bi Components/Software’s/Tools/Product
1) Power Bi Desktop- A Development Software (A Desktop-based authoring tool of choice for
connecting, transforming, and modeling data for creating interactive reports)
 Power Query- ETL (Power Query Editor)
How will you go to Power Query
In Power Bi desktop there is a option called Transform data/Edit queries. It will navigate
to query editor. That part is called “Power Query”
There we Can Prepare the data for Reporting by Transform option (Data preparation
activities). here We can do transformations (ETL Operations). For doing all these
activities we have GUI options in Query Editor. Behind GUI options Microsoft are written
in M language Code.
Once did close and apply means the data will load to Power Pivot.
When you load the table from power query to power pivot, you can see the tables in
Model view.
Power Query uses M language do to transformations.
 Power Pivot- OLAP. in this section you can perform DAX
Power Pivot is a In-memory component(xvelocity)- In memory component means it is
also database which contains tables (which we are loaded from power Query).
Power Pivot is a in memory database. It can store all the tables along with the data.
When compare to normal database, In-memory data base are much powerful.
Internally we have a software for Power Pivot, that software name is vertipac software.
(And similarly, we have SAP in memory database in market)
When you click on Close and Apply in Power Query, this vertipac software will come into
the picture.
What vertipac does means- it will compress (Approx. 1/10th of source data) the data and
stores the data in columnar format. This is completely is a internally mechanism. As a
developer we no need do anything here. Power BI will take care of it.
If Normal source having 5 tables with 100GB memory means, in power pivot vertipac
will compress into 10GB data. So, it compressing 1/10th part of original size.
Why in memories databases are Powerful
In Normal database (SQl or Oracle), they can store the data in row wise. When it
comes to in memory database they can store the data columnwise.
In memory means always they usa RAM memory.
Data will be loaded to application after some transformations.,
Data Modeling-establishing the relationship between tables is called Data Modeling
activities.
creating schemas, we can create new information from existing info. Creating columns
and Measures. DAX functions-Data analysis expression language-Functional language.
In power Pivot total we can perform 2 tasks:
1)Data modeling activities --will be done in model view
2)Enhancing data- Creating new information using existed information.—these will be
done in Data view.
Ex: by using DAX functions we can do some operations here.
Power pivot uses DAX language to enhance the data.
 Online answer what will you do in power pivot is we prepare a dataset.
 Power View- Create reports.
We will use dataset(which was prepared in power pivot step) as datasource to create a
report in power view.
Visualizing the data, Creating Visualizations (Data Visualization activities)
Based on color you can find which indicates to which one.
Power Query
Power Pivot
Power View
2)Power BI Service- Azure cloud-based server which is used to sharing the reports with End
user. https://app.powerbi.com
A web-based service for collaboration, sharing, creation of dashboards, and additional
functionality such as Q&A and alerts. It may also be referred to as the “Power Bi Site” or
PowerBI.com or the Power Bi Web Portal
3)Power BI Reporting Server- On Premise server which is used to sharing the reports with End
user.
An alternative to the Power BI Service for deploying Power Bi Reports within an on-premises
data center, as opposed to the cloud-based Power Bi Service. Power BI Report Server requires a
Power BI Premium license.
4) Power BI Mobile-Viewing the Reports and dashboards from anywhere in Mobile.
5)On-Premises Gateway- An agent installed within the corporate network to allow secure
access to organizational data stored on-premises. There are two options: Enterprise and
Personal
6)Power BI Embedded- APIs for embedding visuals into a custom application.
Power BI Architecture
License
Power Bi Free:
 Incudes the ability to use the power bi Service for personal use.
 It allows you to connect hundreds of data sources (no limit/restriction other than the
amount of data you pull in), clean and prepare your data, and build visualizations (no
limit). All the types of visualizations options in Power BI Pro are available in Power BI
free.
Power Bi Pro:
 Incudes all power BI free features.
 The Size of an importeddatasetislimitedto2GB perindividuadataset.
 A data refreshscheduleforanimporteddatasetislimitedtoa maximumof 8 timesperdaywith
a PowerBi Prolicense.
Power Bi Premium:
 PowerBi PremiumalsoincludesaPowerBi ReportServersubscription.
 On-Premisesreportpublishing.APIsforcustomapplicationintegration.
OLTP and OLAP
OLTP-Online Transactional Processing
OLAP- Online Analytical Processing
OLTP Systems will store the day to day business data transactions. There we can perform
insert/delete/update operations. OLTP systems are not recommended for Analysis/Reporting
purpose.
OLAP Systems are Data Warehouse, there we can have extracted data from different sources to
analyze the data.
What data we need to move From OLTP to OLAP is the Data that is required for Analysis
Purpose. In below case we no need entire business data, we need only finance data for
analyzing/creating the report.
ETL-Extract, Transform,Load
Transform- convertingthe datafromone format toanotherformat iscalledTransforming.
Get Data
Is used to get the data from different sources. Power BI supportsmorethan100 different data
sources.
Get Data GUI option is available in both Desktop and Query Editor Pane.
 When we are getting data from Desktop that time “Load”, “Transform”
,” Cancel” buttons are available. If Developer Click on Transform button, it will navigate
to Query Editor pane. There we can do Transformations.
 If you are getting data in Query Editor pane, that time “Load”, “Cancel” buttons will be
available. Why because you are already in Transforms editor panel so here no need
Transform button.
Different type of data source are:
1)File- Excel, Text/CSV, XML, JSON, Folder, PDF, SharePoint Folder.
2)Database-SQL Server Database, Oracle Database, MySQL Database, Postgre Database etc...
3)Power Platform-Power BI Datasets, Power BI data flows, etc.…
4)Azure-Azure SQL Database, Azure SQL Datawarehouse etc.…
5)Online Services-Facebook, Google Analytics, Salesforce Objects, Azure Devops (Beta) etc.…
6)Others-Web, Python script, Spark, R Script etc.…
Get Data from Excel:
If “Simple “Excel having 5 sheets means, Power Bi will convert in 5 pivot tables.
Below screenshots from Power BI Software
How to do data looks like structured way.
Here an Example by using Excel format.
Load below excel into Query Editor
After loading. It shows like blow
Step 1: Do Transpose -This is treats like Rows as Column and Column as Rows
Step 2: Fill The data to remove nulls
Step 3: Make 1st column as Header
Step 4: Unpivot the years columns
Step 5: Rename the column names how you need it.
Working with SQL Server Database
Import Mode
Direct Mode
Splitting Columns:
Power BI have an option to split the columns.
Ex: We have Table with the column “Full Name”.
Task: Split the FirstName column like first name and last name.
Solution: There are few possibilities to split the column.
In Query Editor we can do that by Right click on required column.
Split columnsBy delimiter (in our example we have spaces in between words so am using
delimiter option, but there are different options available based on our scenarios)
After clicked on OK on above screen, the data comes like below. You can observe that Full
Name is spitted into Full Name1 and Full Name2.
If you want change the column names you can change how you want.
Keynote: You cannot split column when column data type is DATE.in this case change data type
to text and do operations what you need and then later change datatype to DATE. And to do
Date operations we have a “Date “option in Query Editor GUI.
Change Data Type
 Data types are in Power BI
 Decimal Number
 Fixed Decimal Number
 Whole Number
 Percentage
 Date/Time
 Date
 Time
 Date/Time/Time zone
 Duration
 Text
 True/False
 Binary
Once you have uploaded the data in your power bi desktop, we must make sure the data tables
that we are uploaded should have some unique property to it.
Ex: A “Sample “table that contains a date values under “Date” column’s that data type of the
column must be date.
In above image the data type of “Date” column is “Any”. So you have to change the type to
“Date”
After clicked “Date”. The data type changed to Date.
Working with Dates:
We have a column with Dates.
There you can see records are like this format under Date column 19-06-1989
But in report you want to show like below
Case1: Add an extra column with Year values
Date Year
19-06-1989 1989
In above case you must click on ADD Column option in query Editor.
Case 2: In the same column you must show year instead of entire Date.
If you clearly observe above 2 columns Complete Date records under Date column itself
changed to Year wise.
So Key points are:
 When you are doing under ADD column Tab means the extra column is adding for that
table (Case 1).
 When you are doing same operation under Transform Tab means it will
Transforming/Changing the same column (Case 2)
 Dimensions table to Fact table default relationship is One To Many.
ADD Columns
 Merge Columns
We have a table withFirstName andLast Name columns.Butwe wantto show Full Name ina single
column.Inthiscase PowerQueryEditor>Addcolumn>Merge Columns.
These are the separatoroptionswhenwe are Mergingthe selectedcolumns.
 Conditional Columns
The heading itself says that a column which is based on certain condition.
Ex: Add a column if country=USA then it should be region
If Country=India it should be sub region
If Country not equal to India or USA, then it should be Others
Current Data:
After adding a condition for new column
Merge and Append Queries
Merge:
We have a table with names Student and Teacher.
There we have a common ID column.
Power BI provides a feature to combine/merge the tables. (Joining conditions required)
After Clicked on OK
When to go for Merge:
Here an Example:
We knew that In Snowflake Schema must have a relationship between 2 Dimension tables. In
this case if we use merge these 2 dimensions table into a single table by using Merge Concept
so that automatically schema also moved to Star Schema.
Merging the Tables using Multiple Join Conditions
How to Merge 3 Tables
Use Fuzzy Matching Option
Append:
It means appears another table data in the same table which we want to append it. (No Joining
conditions required). We can call Append as a Union in Database world.
When to go for Append:
Here an Example:
Suppose we have 2 tables with same columns in our schema better to make a single table by
using Append.
A simple explanation:
We have a “Prod” table in SQL server, Excel file. But we need these two tables in our
requirement. In this case we will fetch Prod table from 2(SQL and Excel) Sources. So, after get
Prod table in query editor we will have 2 mentions with prod table. So, we can union the both
two Prod tables into a Single able by using Append functionality.
Query Options in Query Editor
a) Copy Query,Paste Query, Delete Query,Rename Query
b) Enable Load, Include in report Refresh
c) Duplicate Query, Reference Query
d) Move to Group,Move Up, Move Down
e) Create Function, Convertto Parameter
f) Advanced Editor,Properties
Data Modeling
Creating a Report is not called Data Modeling
1. Dimension Column, Fact Column, Dimension Table, Fact Table
Fact column/Measure column:
A column should satisfy 2 conditions,
 The data type of the column must be a number
 The number column needs to create an impact on the business
Dimension column.
The data type of the column may or may not be numeric.
All text columns and date columns are dimension columns.
In below example.
Channel Type and Customer Country are Dimensions
Sales Amount is a Fact column.
Channel type Customer Country Sales Amount
A india 100$
B Usa 101$
Fact (Data)= Data table contains a information about process. Data Table=Business Process
Dimension (Look-Up) =who what when where how
- (Calendar table also a lookup table)
Measures-Define ones use it everywhere
Data Table (Fact Table) Lookup Table (Dimensions)
Business Process Who, What, Where, When, How
Tall & Skinny Shor & Squat
Numbers Words
Relationships
One to Many Relationship:
Below one is an example of one to many. Why because one customer can purchase number of
sales.
One to One Relationship
Many toOne Relationship
Many toMany Relationship
Schemas in Power BI
First, we need to understand Facts and Dimensions before we start Schemas.
Ex: Total Sales, Product Values these are numbers and I can say these are Measures. Measures
are numbers.
Measures majorly stored in Fact Tables. And Dimensions describes what these measures mean.
1)Star Schema
 Here Data is de-normalized. And Joining’s are less. More Maintenance.
2)Snowflake Schema
 At least one of the dimension table should not have a relationship with Fact table.
 Here Data is normalized. And Joining’s are more. Less Maintenance.
 Extended of star schema is called snowflake schema.
3) Galaxy Schema or Hybrid Schema or Fact Constellation Schema
A Galaxy Schema contains two fact table that share dimension tables between them. It is also
called fact Constellation Schema. The schema is viewed as a collection of stars hence the name
Galaxy Schema.
DAX Data Analysis Expression – Categories
Measures are 2 Types
 Implicit Measure-SUM, MAX,MIN
 Explicit MeasureWe have to write manually, by clicking new column, new table
Quick Measures
DAXis a functional language.
What DAXcontain is Functions+ Operators,withthe helpof functionsandoperatorsyouwill writethe
DAX.
 TextFunctions
 Logical Functions
 Date andTime Functions
 FilterFunctions
 Math & Statistical Functions
 Time IntelligenceFunctions
 Informationfunctions
 Iterative Functions
 Parentand childfunctions
 Otherfunctions
 Rank FunctionsandVariable
Text Functions:
CONCATENATE
Joinstwotextstringsintoone textstring.
Syntax:CONCATENATE(<text1>,<text2>)
Scenario:newmeasure:=concatenate(sanjay,bi)
CONCATENATEX
Concatenatesthe resultof anexpressionevaluatedforeachrow ina table
Syntax:CONCATENATEX(<table>,<expression>,[delimiter])
CONCATENATEX(STUDENT,[FirstName] &“ “ & [LastName],“,”hlihkhi
EXACT
ComparestwotextstringsandreturnsTRUE if theyare exactlythe same,FALSEotherwise.EXACTis
case-sensitivebutignoresformattingdifferences.Youcanuse EXACT to testtextbeingenteredintoa
document.
Syntax:EXACT(<text1>,<text2>)
FIND
Returnsthe startingpositionof one textstringwithinanothertextstring.FINDiscase-sensitive.
Syntax:FIND(<find_text>,<within_text>[,[<start_num>][,<NotFoundValue>]])
Example
The followingformulafindsthe positionof the firstletterof the productdesignation,BMX,inthe string
that containsthe productdescription.
=FIND("BMX","lineof BMXracing goods")
LEFT
Returnsthe specifiednumberof charactersfromthe start of a textstring.
Syntax:LEFT(<text>,<num_chars>)
Returnsthe numberof characters ina textstring.
RIGHT
RIGHT returnsthe lastcharacter or characters ina textstring,basedonthe numberof characters you
specify.
Syntax:RIGHT(<text>,<num_chars>)
LEN
Returnsthe numberof characters ina textstring.
Syntax:LEN(<text>)
LOWER
Convertsall lettersinatextstringto lowercase.
Syntax:LOWER(<TEXT>)
UPPER
Convertsa textstringtoall uppercase letters
Syntax:UPPER(<TEXT>)
MID
Returnsa stringof charactersfrom the middle of atextstring,givena startingpositionandlength.
Syntax:MID(<text>,<start_num>,<num_chars>)
REPLACE
REPLACE replacespartof a textstring,basedonthe numberof characters youspecify,withadifferent
textstring.
Syntax:REPLACE(<old_text>,<start_num>,<num_chars>,<new_text>)
REPITITION
Repeatstextagivennumberof times.Use REPT to fill acell witha numberof instancesof a textstring.
Syntax:REPT(<text>,<num_times>)
SEARCH
Returnsthe numberof the character at whicha specificcharacteror textstringisfirstfound,reading
lefttoright.Search iscase-insensitiveandaccentsensitive.
Syntax:SEARCH(<find_text>,<within_text>[,[<start_num>][,<NotFoundValue>]])
TRIM
Removesall spacesfromtext exceptforsinglespacesbetweenwords.
Syntax:TRIM(<text>)
VALUE
Convertsa textstringthatrepresentsanumberto a number.
Syntax:VALUE(<text>)
Logical Functions
Logical functionsactupon an expressiontoreturn informationaboutthe valuesor setsinthe
expression.Forexample,youcanuse the IF functiontocheckthe resultof an expressionandcreate
conditional results.
AND
Checkswhetherbothargumentsare TRUE, and returnsTRUE if bothargumentsare TRUE. Otherwise
returnsfalse.
Syntax:AND(<logical1>,<logical2>)
Scenario:Newmeasure=IF(AND(4>3,3<4),"BOTHTRUE","ANYONEFALSE")
OR
Checkswhetherone of the argumentsisTRUE to return TRUE. The functionreturnsFALSEif both
argumentsare FALSE.
Syntax OR(<logical1>,<logical2>)
Scenario:New measure== IF(OR(1>3,3<4),"ONETRUE","BOTHFALSE")
TRUE
Returnsthe logical value TRUE.
Syntax:TRUE()
Scenario:New measure=IF(SUM(FactPayments[Discount_Fee])=1900000, TRUE(),FALSE())
IF
Checksif a conditionprovidedasthe firstargumentismet.Returnsone value if the conditionisTRUE,
and returnsanothervalue if the conditionisFALSE.
Syntax:IF(logical_test>,<value_if_true>,value_if_false)
Scenario:New Column=IF(FactPayments[Tax amount]<200,"LOW",IF(FactPayments[Tax
amount]<250,"MED","HIGH"))
IFERROR
Evaluatesanexpressionandreturnsaspecifiedvalue if the expressionreturnsanerror;otherwise
returnsthe value of the expressionitself.
Syntax:IFERROR(value,value_if_error)
Scenario:New Measure=IFERROR(24/0,9999)
IN
ReturnsTrue if the scalar value showsupinat leastone row of the inputrelation.
Syntax:IN
Scenario:New Measure=CALCULATE(SUM(FactPayments[Discount_Fee]),DimCourse[CourseID] IN
{"MSBI-F","MSBI-N"})
SWITCH (Appliesmultiple conditions)
Evaluatesanexpressionagainstalistof valuesandreturnsone of multiplepossibleresultexpressions.
Syntax:SWITCH(<expression>,<value>,<result>[,<value>,<result>]…[,<else>])
Scenario:Newcolumn=Increment
disc_fee=switch(FactPayments[ModeID],"Online",FactPayments[Discount_Fee]
*10/100,"Classroom",FactPayments[Discount_Fee] *20/100,"Customized",
FactPayments[Discount_Fee]*30/100)
Date and Time Functions
CALENDAR
Returnsa table witha single columnnamed“Date”thatcontainsa contiguoussetof dates. The range of
datesisfrom the specifiedstartdate tothe specifiedenddate,inclusiveof those twodates.
Syntax:CALENDAR(<start_date>,<end_date>)
Examples
The followingformulareturnsatable withdatesbetweenJanuary1st,2020 andDecember31st, 2020.
=CALENDAR(DATE (2020, 1, 1), DATE (2020, 12, 31))
DATE
Returnsthe specifieddate indatetime format.
Syntax: DATE(<year>,<month>,<day>)
Example: ReturningaSimple Date
Code
=DATE (2020,3,28)
CALENDAR AUTO
Returnsa table witha single columnnamed“Date”thatcontainsa contiguoussetof dates. The range of
datesiscalculatedautomaticallybasedondatainthe model.
Syntax:CALENDARAUTO()
TODAY
Returns the current date.
Syntax: TODAY()
UTCToday
Returnsthe currentUTC
Syntax:UTCTODAY()
UTCNow
Returnsthe currentUTC date and time
Syntax:UTCNOW()
NOW
Returnsthe currentdate andtime indatetime format.
Syntax:NOW()
DAY
Returnsthe day of the month,a numberfrom1 to 31.
Syntax:DAY(DATE)
WEEKDAY
Returnsa number2. By defaultthe dayrangesfrom1 (Sunday) to7 (Saturday).
Syntax:WEEKDAY(<date>,<return_type>)
MONTH
Returnsthe monthas a numberfrom1 (January) to12 (December).
Syntax:MONTH(<datetime>)
YEAR
Returnsthe yearof a date as a fourdigitintegerinthe range 1900-9999.
Syntax:YEAR(<date>)
DATEDIFF
Returnsthe count of interval boundariescrossedbetweentwodates.
Syntax:DATEDIFF(<start_date>,<end_date>,<interval>)
YEARFRAC
Calculatesthe fractionof the yearrepresentedbythe numberof whole daysbetweentwodates.
Syntax: YEARFRAC(<start_date>,<end_date>,<basis>).
EOMONTH
Returnsthe date in datetime formatof the lastdayof the month,before oraftera specified numberof
months.
Syntax : EOMONTH(<start_date>,<months>)
WEEKNUM
Returnsthe weeknumberforthe givendate andyearaccording to the return_type value.The week
numberindicateswherethe weekfallsnumericallywithinayear.
Syntax: WEEKNUM(<date>,<return_type>)
EDATE
Returnsthe date that is the indicatednumberof monthsbeforeorafterthe start date.
Syntax:EDATE(<start_date>,<months>)
DATEVALUE
Convertsa date inthe formof textto a date indatetime format.
Syntax:DATEVALUE(date_text)
TIMEVALUE
Convertsa time intextformatto a time indatetime format.
Syntax:TIMEVALUE(time_text)
HOUR
Returnsthe hour as a numberfrom0 (12:00 A.M.) to 23 (11:00 P.M.)
Syntax:HOUR(<datetime>)
MINUTE
Returnsthe minute asa numberfrom0 to 59, givena date and time value.
Syntax:MINUTE(<datetime>)
Filter Functions
Filteringoperationstomanipulate the datacontext.
Context
Contextisone of the most importantDAXconceptsto understand.There are twotypesof contextin
DAX:row contextandfiltercontext.We’llfirstlookatrow context.
Row context
Row contextismosteasilythoughtof asthe current row.It applieswheneveraformulahasa function
that appliesfilterstoidentify asingle row inatable.The functionwill inherentlyapplya row contextfor
each rowof the table overwhichitis filtering.Thistype of row contextmostoften appliestomeasures.
Filtercontext
Filtercontextisalittle more difficulttounderstandthanrow context.Youcan mosteasilythinkof filter
contextas:One or more filtersappliedinacalculationthatdeterminesaresultorvalue.
Filtercontextdoesn’texistinplace of row context;rather, itappliesinadditiontorow context.For
example,tofurthernarrowdownthe valuestoinclude inacalculation, youcanapplya filtercontext,
whichnotonlyspecifiesthe rowcontext,butalsospecifiesaparticularvalue (filter) inthatrow context.
Why isfiltercontextsoimportanttoDAX?Because while filtercontextcanmosteasilybe appliedby
addingfieldstoavisualization,filtercontextcanalsobe appliedinaDAX formulabydefiningafilter
usingfunctionssuchas ALL, RELATED, FILTER, CALCULATE, by relationships,andbyothermeasuresand
columns. Forexample,let’slookatthe followingformulainameasure namedStore Sales:
Thisformulaincludesthe followingsyntax elements:
A. The measure name, Store Sales.
B. The equalssignoperator(=),whichindicatesthe beginningof the formula.
C. The CALCULATE function,whichevaluatesanexpression, asanargument,ina contextthatis
modifiedbythe specifiedfilters.
D. Parenthesis (),whichsurroundanexpressioncontainingone ormore arguments.
E. A measure [Total Sales] inthe same table as an expression.The Total Salesmeasure hasthe formula:
=SUM(Sales[SalesAmount]).
F. A comma (,),whichseparatesthe firstexpressionargumentfromthe filterargument.
G. The fullyqualifiedreferencedcolumn, Channel[ChannelName].Thisisourrow context.Eachrow in
thiscolumnspecifiesachannel,such asStore or Online.
H. The particularvalue, Store,asa filter.Thisisourfiltercontext.
Thisformulaensuresonlysalesvaluesdefinedbythe Total Salesmeasure are calculatedonlyforrowsin
the Channel[ChannelName]column,withthe value Storeusedasa filter.
Filter
Returnsa table that representsasubsetof anothertable orexpression.
Syntax:FILTER(<table>,<filter>)
Returns-A table containingonlythe filteredrows.(Returnsatable thathas beenfiltered.)
Scenario:GotoNewTable=Filter(Dimcourse,Dimcourse[Coursename]=”Azure FastTrack”)
Filters
Returnsthe valuesthatare directlyappliedasfilterstocolumnName. i.e.,Returns atable of the filter
valuesapplieddirectlytothe specifiedcolumn.
Syntax:FILTERS(<columnName>)
Scenario:GotoNewTable=Filters(Dimcourse[Coursename]=’”Azure FastTrack”)
All
Returnsall the rowsin a table,or all the valuesina column,ignoringanyfiltersthatmighthave been
applied.Thisfunctionisusefulforclearingfiltersandcreatingcalculationsonall the rowsina table.
Syntax:ALL( {<table>| <column>[,<column>[,<column>[,…]]]} )
Scenario:
Take an yearslicerandsee the result, whenyearchangesDiscounttotal 1 changes,where as Discount
total 2 doesnot change. Take twocards and show the result.
Discounttotal 2 = sumx(all(FactPayments),FactPayments[Discount_Fee])
Total discountfees =SUMX(FactPayments,FactPayments[Discount_Fee])
All Except
Removesall contextfiltersin the table exceptfiltersthathave beenappliedtothe specifiedcolumns.
Syntax:ALLEXCEPT(<table>,<column>[,<column>[,…]])
Scenario:Take yearfilter,change year,itdoesnotchange the values.Where asMonthname if you
change, it will affect.
Discounttotal 2 = calculate(sum(FactPayments[Discount_Fee]),allexcept(DimDate,DimDate[Month])
Calculate
Evaluatesanexpressioninacontextthatismodifiedbythe specifiedfilters.
Syntax:CALCULATE(<expression>,<filter1>,<filter2>…)
Scenario:
Discounttotal 2 = calculate(sum(FactPayments[Discount_Fee]),allexcept(DimDate,DimDate[Month])
Calculate Table(we can create table of rows n columns)
CALCULATE functionrequiresasitsfirstargumentanexpressionthatreturnsa single value,the
CALCULATETABLE functiontakesatable of values.Evaluatesatable expressioninacontextmodifiedby
the givenfilters.
Syntax:CALCULATETABLE(<expression>,<filter1>,<filter2>,…)
Scenario:Display2017 yeardata
NewTable:Caltab2017 rows= CALCULATETABLE(FactPayments,DimDate[Year]=2017)
Scenario:Total Discountfee in2017 usingcalculate table
NewMeasure:Caltab_2017_TDF=
sumx(CALCULATETABLE(FactPayments,DimDate[Year]=2017),FactPayments[Discount_Fee])
Count Rows and Distincts
Distinctrowswithcountof rows.
Syntax:DISTINCT(<table>)<column>
COUNTROWS(<column>)
Scenario:Countrowsof distinctDiscountfee infacttable.
DISTINCTROWCOUNT= COUNTROWS(DISTINCT(FactPayments[Discount_Fee]))
Related
Returnsa relatedvalue fromanothertable.
Syntax:RELATED (<COLUMN>)
Scenario:Create newcolumnCoursedetailinFactpaymentsusingRelatedfunctionwhichjoinsfacttable
withDimCourse table withnewcolumnretrievingwithvaluesagainsteachcourseid(joiningcolumn)
withcourse name details.
Goto FactpaymentsNewColumnCoursedetail =RELATED(DimCourse[Coursename])
Process:Each Courseidvalue fromFactpaymentspassedtothe model,joinwithDimcourse table and
thenmatchedrow Coursename itgetsfromDimcourse table.
Joinconcept:One value passand getone value againsteachmatchedcourseid(1:1)—Joinandreturna
single value againsteachmatchedid.
RelatedTable
Evaluatesa table expressioninacontextmodifiedbythe givenfiltersandreturna table of values.
Syntax:Syntax RELATEDTABLE(<tableName>)
Scenario:FindoutinCoursetableforeachcourseidtotal discountfee generated.
Goto CoursetableTotalDF=SUMX(RELATEDTABLE(FactPayments),FactPayments[Discount_Fee])
Process:Each CourseidfromDimCourse passedtoFactpayments,compare andgettable of rowsand
thensumof all the retrievedrowstotal created.
Joinconcept:One value passedandmanyvaluesretrieval (1:many)—joinandreturntable data.
Values
Returnsa one-columntable thatcontainsthe distinctvaluesfromthe specifiedtable orcolumn.Inother
words,duplicate valuesare removedandonlyuniquevaluesare returned.
Syntax:VALUES(<TableNameOrColumnName>)
Scenario:Displayonlycoursenames.Syntax:Course_values=Values(Dimcourse[coursename])
Scenario:Displaycountof coursename.
Syntax:gotonewcolumn=Countrows(Values(Dimcourse[coursename]))
HasoneValue
ReturnsTRUE whenthe contextforcolumnName hasbeenfiltereddowntoone distinctvalue only.
Otherwise isFALSE.
Syntax:HASONEVALUE(<columnName>)
Scenario:If courseIDhas one value,thenitwill show youcount.Otherwise returnsBLANK.
Goto New column
Hasonevalue=IF(HASONEVALUE(FactPayments[CourseID]),FILTERS(FactPayments[CourseID]),BLANK())
HasoneFilter
ReturnsTRUE whenthe numberof directlyfilteredvaluesoncolumnName isone;otherwise returns
FALSE.
Syntax:HASONEFILTER(<columnName>)
Scenario:If courseIDhas one value,thenitwill show youcount.Otherwise returnsBLANK.
Goto New column
HasoneFilter=IF(HASONEFILTER(FactPayments[CourseID]),FILTERS(FactPayments[CourseID]),BLANK())
IsCrossFiltered
ReturnsTRUE whencolumnName oranothercolumninthe same orrelatedtable isbeingfiltered.
Syntax:ISCROSSFILTERED(<columnName>)
Scenario:GotoNewcolumn Iscrossfilter=ISFILTERED(DimDate[Quarter])
IsFiltered
ReturnsTRUE whencolumnName isbeingfiltereddirectly.If there isnofilteronthe columnorif the
filteringhappensbecauseadifferentcolumninthe same table orina relatedtable isbeingfiltered then
the functionreturnsFALSE.
Syntax:ISFILTERED(<columnName>)
Scenario:GotoNewcolumn Isfiltered=ISFILTERED(DimDate[Quarter])
Keepfilters
Modifieshowfiltersare appliedwhileevaluatingaCALCULATE or CALCULATETABLE function.
Syntax:KEEPFILTERS(<expression>)
SelectedValue
Returnsthe value whenthe contextforcolumnName hasbeenfiltereddowntoone distinctvalue only.
Otherwise returnsalternateResult.
Syntax:SELECTEDVALUE(<columnName>[,<alternateResult>])
Scenario:GotoNewMeasure= SELECTEDVALUE(DimCourse[Coursename],"XYZ"),use cardforthe
measure valuesandcoursename inslicer,if novalue selectedinslicercarddisplaysalternate value
XYZ.
UseRelationship
Specifiesthe relationshiptobe usedina specificcalculationasthe one thatexistsbetween
columnName1andcolumnName2.
Syntax:USERELATIONSHIP(<columnName1>,<columnName2>)
Scenario:
DiscountFee_Relationship=CALCULATE(sum(FactPayments[Discount_Fee]),
USERELATIONSHIP(FactPayments[Date],DimDate[Date]))
No value returned,butthe relationshipisutilized.
Math & Statistical Functions
The mathematical functionsinDataAnalysisExpressions(DAX) are verysimilartothe Excel mathematical
and trigonometric functions.
SUM
Adds all the numbers in a column.
Syntax: SUM(<COLUMN>)
Example: The following example adds all the numbers that are contained in the column, Amt, from the
table. Sales=SUM(Sales[Amt])
SUMX
Returns the sum of an expression evaluated for each row in a table.
Syntax: SUMX(<table>, <expression>)
The following example first filters the table,Factpayments, on the expression and then returnsthe sum
of all values in the column, Discount_Fee.
Total discountfees =SUMX(FactPayments,FactPayments[Discount_Fee])
CEILING
Roundsa numberup, to the nearestintegerorto the nearestmultipleof significance.
Syntax:CEILING(<number>,<significance>)
Example
The followingformulareturns4.45.This mightbe useful if youwantto avoidusingsmallerunitsinyour
pricing.If an existingproductispricedat$4.42, you can use CEILING toround pricesupto the nearest
unitof five cents.
=CEILING(4.42,0.05)
CURRENCY
Evaluates the argument and returns the result as currency data type.
Syntax: CURRENCY(<value>)
Example Convert number 1234.56 to currency data type. =CURRENCY(1234.56) Returns the value
$1234.5600.
DIVIDE
Performs division and returns alternate result or BLANK() on division by 0.
Syntax: DIVIDE(<numerator>, <denominator> [,<alternateresult>])
Example: The following example returns 2.5. =DIVIDE(5,2)
Example: The following example returns BLANK. =DIVIDE(5,0)
Example: The following example returns 1. =DIVIDE(5,0,1)
Time Intelligence Functions
These functionsworkonrunningdatesof currentand past.
Sameperiodlast year
Returnsa table that containsa columnof datesshiftedone yearbackintime fromthe datesinthe
specifieddatescolumn,in the currentcontext.
Syntax : SAMEPERIODLASTYEAR(<dates>)
Parallelperiod
Returnsa table that containsa columnof datesthat representsaperiodparalleltothe datesinthe
specifieddatescolumn,inthe currentcontext,withthe datesshiftedanumber of intervalseither
forwardintime or back in time.
Syntax:PARALLELPERIOD(<dates>,<number_of_intervals>,<interval>)
Previousyear
Returnsa table that containsa columnof all datesfromthe previousyear,giventhe lastdate inthe
datescolumn,inthe currentcontext.
Syntax:PREVIOUSYEAR(<dates>[,<year_end_date>])
Previousquarter
Returnsa table that containsa columnof all datesfromthe previousquarter,basedonthe firstdate in
the datescolumn,inthe current context.
Syntax:PREVIOUSQUARTER(<dates>)
Previousmonth
Returnsa table that containsa columnof all datesfromthe previousmonth,basedonthe firstdate in
the datescolumn,inthe current context.
Syntax:PREVIOUSMONTH(<dates>)
Previousday
Returnsa table that containsa columnof all datesrepresentingthe daythatis previoustothe firstdate
inthe datescolumn,inthe currentcontext.
Syntax : PREVIOUSDAY(<dates>)
Datesbetween
Returnsa table that containsa columnof datesthat begins withthe start_date andcontinuesuntil the
end_date.
Syntax: DATESBETWEEN(<dates>,<start_date>,<end_date>)
Datesinperiod
Returnsa table that containsa columnof datesthat beginswiththe start_date andcontinuesforthe
specifiednumber_of_intervals.
Syntax: DATESINPERIOD(<dates>,<start_date>,<number_of_intervals>,<interval>)
Start of Month
Returnsthe firstdate of the monthin the currentcontextforthe specifiedcolumnof dates.
Syntax:STARTOFMONTH(<dates>)
Start of Quarter
Returnsthe firstdate of the quarterin the currentcontextforthe specifiedcolumnof dates.
Syntax:STARTOFQUARTER(<dates>)
Start of Year
Returnsthe firstdate of the yearin the currentcontextfor the specifiedcolumnof dates.
Syntax:STARTOFYEAR(<dates>)
End of Month
Returnsthe lastdate of the month inthe current contextforthe specifiedcolumnof dates.
Syntax :ENDOFMONTH(<dates>)
End of Quarter
Returnsthe lastdate of the quarter inthe current contextforthe specifiedcolumnof dates
Syntax:ENDOFQUARTER(<dates>)
End of Year
Returnsthe lastdate of the year inthe current contextforthe specifiedcolumnof dates.
Syntax:ENDOFYEAR(<dates>[,<year_end_date>])
Dates YTD
Returnsa table that containsa Columnof the datesfor the yearto date,inthe currentcontext.
Syntax:DATESYTD(<dates>[,<year_end_date>])
Dates QTD
Returnsa table that containsa columnof the datesfor the quarterto date,in the currentcontext.
Syntax:DATESQTD(<dates>)
Dates MTD
Returnsa table that containsa columnof the datesfor the monthto date,in the currentcontext.
Syntax:DATESMTD(<dates>)
Total YTD
Evaluatesthe year-to-datevalue of the expressioninthe currentcontext.
Syntax:TOTALYTD(<expression>,<dates>[,<filter>][,<year_end_date>])
Total QTD
Evaluatesthe value of the expressionforthe datesinthe quarterto date,inthe current context.
Syntax:TOTALQTD(<expression>,<dates>[,<filter>])
Total MTD
Evaluatesthe value of the expressionforthe monthtodate,inthe currentcontext.
Syntax:TOTALMTD(<expression>,<dates>[,<filter>])
Firstdate
Returnsthe firstdate in the currentcontextforthe specifiedcolumnof dates.
Syntax:FIRSTDATE(<dates>)
FirstNonBlank
Returnsthe firstvalue inthe column,column,filteredbythe currentcontext,wherethe expressionis
not blank.
Syntax:FIRSTNONBLANK(<column>,<expression>)
Lastdate
Returnsthe lastdate inthe current contextforthe specifiedcolumnof dates.
Syntax:LASTDATE(<dates>)
LastNonblankdate
Returnsthe lastvalue inthe column,column,filtered bythe currentcontext,where the expressionis
not blank.
Syntax:LASTNONBLANK(<column>,<expression>)
Nextday
Returnsa table that containsa columnof all datesfromthe nextday,basedonthe firstdate specifiedin
the datescolumninthe currentcontext
Syntax:NEXTDAY(<dates>)
Nextmonth
Returnsa table that containsa columnof all datesfromthe nextmonth,basedonthe firstdate
specifiedinthe datescolumninthe currentcontext
Syntax:NEXTMONTH(<dates>)
NextQuarter
Returnsa table that contains a columnof all datesfromthe nextquarter,basedonthe firstdate
specifiedinthe datescolumninthe currentcontext
Syntax:NEXTQUARTER(<dates>)
Information functions
DAXinformationfunctionslookatthe cell or row that is providedasanargument and tellsyouwhether
the value matchesthe expectedtype.Forexample,the ISERRORfunctionreturnsTRUEif the value that
youreference containsanerror.
CONTAINS
Returnstrue if valuesforall referredcolumnsexist,orare contained,inthose columns; otherwise,the
functionreturnsfalse.
Syntax:CONTAINS(<table>,<columnName>,<value>[,<columnName>,<value>]…)
Scenario:Returntrue or false,if courseID=”MSBI-F”andModeID=”Online”available infacttable
Course_Mode_Exists=CONTAINS(FactPayments,FactPayments[CourseID],"MSBI-F",
FactPayments[ModeID],"Online")
IN Operator / CONTAINSROW
ReturnsTRUE if a row of valuesexistsorcontainedinatable,otherwise returnsFALSE.Exceptsyntax,
the IN operatorandCONTAINSROWfunctionare functionallyequivalent.
IN OperatorSyntax :
<scalarExpr> IN <tableExpr>
( <scalarExpr1>, <scalarExpr2>,… ) IN <tableExpr>
ContainsRow
syntax:
CONTAINSROW(<tableExpr>,<scalarExpr>[,<scalarExpr>,…])
Scenario:GotoNewTable ContainsRow =FILTER(ALL(DimCourseMode[ModeID]),CONTAINSROW({
"Online","Classroom"},[ModeID]))
QueryExecution:Bring All modeidsirrespective of flter.
Withinthe listfilterfunctionappliescondition{containsrow}.
Note:Containsgivessingle valuesonlyastrue/false,againstsinglecolumn.
Where as Containsrowgivesmultiple valuesagainstmultiple columnsinarow.
IsError
Checkswhetheravalue isan error,and returnsTRUE or FALSE.
Syntax:ISERROR(<value>)
Iserror_val = iserror([Columname]/0)
Scenario:If there isan error substistuingwith99999 if(iserror(FactPayments[M1]/0),99999)
IsBlank
Checkswhetheravalue isblank,andreturnsTRUE or FALSE.
Syntax:ISBLANK(<value>)
Scenario:GotoNewcolumn=ISBLANK(DimCourse[CourseID])
Checksthe value againstcourseidcolumnandreturnstrue/false.
IsEven& IsOdd
If valuesisEvenresultas True and if value isOddresultas false.
Isblank= ISBLANK(DimCourse[CourseID])
Syntax=ISEVEN(number)
Scenario: = ISEVEN(DimCourse[Duration]) returnsresultasTrue,durationvaluesare all even.
= ISOdd(DimCourse[Duration])returnsresultasFalse,durationvaluesare all even.
IsNumber
Checkswhetheravalue isa number,andreturnsTRUE or FALSE.
Syntax:ISNUMBER(<value>)
IsText
Checksif a value istext,andreturnsTRUE OR FALSE
Syntax:ISTEXT(<VALUE>)
IsLogical
Checkswhetheravalue isa logical value,(TRUEor FALSE/Booleanvalues) andreturnsTRUEor FALSE.
Syntax:ISLOGICAL(<value>)
IsNontext
Checksif a value isnot text(blankcellsare nottext),andreturnsTRUE or FALSE.
Syntax:ISNONTEXT(<value>)
IsonOrafter
A boolean functionthatemulatesthe behaviorof a‘Start At’clause and returnstrue for a row that
meetsall of the conditionparameters.
Thisfunctiontakesa variable numberof triples,the firsttwovaluesinatriple are the expressionstobe
compared,andthe thirdparameterindicatesthe sortorder.The sortorder can be ascending(default) or
descending.
Basedon the sort order,the firstparameteriscomparedwiththe secondparameter. Ifthe sort order is
ascending,the comparisonto be done isfirst parameter greater than or equal to second parameter.If
the sort orderis descending,the comparisontobe done issecondparameterlessthanorequal to first
parameter.
Syntax:ISONORAFTER(<scalar_expression>,<scalar_expression>sort_order][,scalar_expression>,
<scalar_expression>,[sort_order][,…])
Scenario: ison= ISONORAFTER(DimDate[Date],DimDate[Month],ASC)resultsasTrue
ison= ISONORAFTER(DimDate[Date],DimDate[Month],DESC)resultsasFalse
LookupValue
Returnsthe value inresult_columnName forthe row thatmeetsall criteriaspecifiedby
search_columnName andsearch_value.
Syntax:LOOKUPVALUE( <result_columnName>,<search_columnName>,<search_value>[,
<search_columnName>,<search_value>]…)
Scenario:GotoNewMeasure=
LOOKUPVALUE(DimCourse[Coursename],DimCourse[CourseID],"msbi-c")
UserName
Returnsthe domainname andusername fromthe credentialsgiventothe systematconnectiontime
Syntax:USERNAME()
Scenario:GotoMeasure=Username()
Iterative Functions
Parent and child functions
These Data AnalysisExpressions(DAX) functionshelpusersmanage datathatispresentedasa
parent/childhierarchyintheirdatamodels.
Withthese functions:
 A user can obtain the entire lineage of parents a row has,
 How many levels has the lineage to the top parent,
 Who is the parent n-levels above the current row,
 Who is the n-descendant from the top of the current row hierarchy
 And is certain parent a parent in the currsent row hierarchy?
Parent-Child functions in DAX
The following table contains a Parent-Child hierarchy on the columns: EmployeeKey and
ParentEmployeeKey that is used in all the functions examples.
In the above table youcansee thatemployee 112 hasno parentdefined,employee14has employee112
as manager(ParentEmployeeKey),employee 3 has employee 14as managerand employees11, 13, and
162 have employee 3 as manager. The above helps to understand that employee 112 has no manager
above her/himandshe/he isthe topmanagerforall employees shownhere;also,employee 3reportsto
employee 14 and employees 11, 13, 162 report to 3.
The followingtable presentsthe availablefunctions,abrief descriptionof the functionandanexampleof
the function over the same data shown above.
PATH function(DAX) - Returnsa delimitedtextwiththe identifiersof all the parentsto the currentrow,
starting with the oldest or top most until current.
Remarks
Returnsa delimitedtextstringwiththe identifiersof all the parentsof the current identifier,startingwith
the oldest and continuing until current.
A delimited text string containing the identifiers of all the parents to the current identifier.
This function is used in tables that have some kind of internal hierarchy, to return the items that are
related to the current row value. For example, in an Employees table that contains employees, the
managers of employees, and the managers of the managers, you can return the path that connects an
employeetohisorhermanager.The pathisnot constrainedtoasingle levelof parent-childrelationships;
it can return related rows that are several levels up from the specified starting row.
 The delimiter used to separate the ascendants is the vertical bar, '|'.
 The values in ID_columnName and parent_columnName must have the same data type, textor
integer.
 Valuesinparent_columnName mustbe presentinID_columnName.Thatis, youcannot lookup
a parent if there is no value at the child level.
 If parent_columnName is BLANK then PATH() returns ID_columnName value. In other words, if
you lookfor the manager of an employee butthe parent_columnName columnhasnodata, the
PATH function returns just the employee ID.
 If ID_columnName hasduplicatesandparent_columnName isthe same forthose duplicatesthen
PATH() returnsthe commonparent_columnName value;however,if parent_columnName value
is different for those duplicates then PATH() returns an error. In other words, if you have two
listingsforthe same employee IDandtheyhave the same managerID,the PATHfunctionreturns
the ID for that manager. However, if there are two identical employee IDs that have different
manager IDs, the PATH function returns an error.
 If ID_columnName is BLANK then PATH() returns BLANK.
 If ID_columnName contains a vertical bar '|' then PATH() returns an error.
PATHLENGTH function (DAX) - Returns the number of levels in a given PATH(), starting at current level
until the oldest or top most parent level. In the following example column PathLength is defined as ‘
=PATHLENGTH([Path]) ’; the example includes all data from the Path() example to help understand how
this function works.
Remarks
This DAX function is not supported for use in DirectQuery mode.
PATHITEM function(DAX) - Returnsthe itemat the specifiedpositionfromaPATH() like result,counting
from left to right. In the following example column PathItem - 4th from left is defined as ‘
=PATHITEM([Path], 4) ’; this example returns the EmployeKeyat fourth position in the Path string from
the left, using the same sample data from the Path() example.
Remarks
 Thisfunctioncan be usedto returna specificlevel fromahierarchyreturnedbyaPATH function.
For example, you could return just the skip-level managers for all employees.
 If you specify a number for position that is less than one (1) or greater than the number of
elements in path, the PATHITEMfunction returns BLANK
 If type is not a valid enumeration element an error is returned.
PATHITEMREVERSE function (DAX) - Returns the item at position from a PATH() like function result,
countingbackwardsfromrightto left.Inthe followingexamplecolumnPathItemReverse - 3rdfromright
is defined as ‘=PATHITEMREVERSE([Path],3) ’; thisexample returns the EmployeKey at third positionin
the Path string from the right, using the same sample data from the Path() example.
Remarks
 This function can be used to get an individual item from a hierarchy resulting from a PATH
function.
 This function reverses the standard order of the hierarchy, so that closest items are listed first,
For example,if the PATh function returns a list of managers above an employee in a hierarchy,
the PATHITEMREVERSE function returns the employee’s immediate manager in position 2
because position 1 contains the employee’s id.
 If the number specified for position islessthan one (1) or greater than the number of elements
in path, the PATHITEMfunction returns BLANK.
 If type is not a valid enumeration element an error is returned.
PATHCONTAINS function (DAX) - Returns TRUE if the specified item exists within the specified path. In
the followingexamplecolumnPathContains - employee162isdefinedas‘=PATHCONTAINS([Path],"162")
’; thisexample returnsTRUEif the givenpathcontainsemployee162. Thisexample usesthe resultsfrom
the Path() example above.
Remarks
If itemis an integernumberit is convertedto textand then the functionis evaluated.If conversionfails
then the function returns an error.
Rank Functions and Variable
Other functions
Providesamechanismfordeclaringaninline setof datavalues.(SimilartoCreate Table- Helpstocreate
a dynamictable withrows.
Syntax:DATATABLE(ColumnName1,DataType1,ColumnName2,DataType2...,{{Value1,Value2...},
{ValueN,ValueN+1...}...})
Scenario:NEWTABLE=STUDENT TABLE=DataTable("IDNO",STRING,"NAME",STRING,{
{"STU1","AKASH"},{"STU2","VISHU"},{"STU3","RAGHU"}, {"STU4","KIRAN"},{" STU5","KRISH"} } )
EXCEPT
Returnsthe rowsof one table whichdonot appearin anothertable.Syntax
EXCEPT(<table_expression1>,<table_expression2>)
Scenario:
NEW TABLE ST1 = DataTable("IDNO",STRING,"NAME",STRING,{ {"STU1","AKASH"},{" STU2","VISHU"}})
NEW TABLE ST2 = DataTable("IDNO",STRING,"NAME",STRING,{ {"STU1","AKASH"},{"STU3","KIRAN"}} )
NOW:EXSTU1STU2 = EXCEPT('NEWTABLE ST1','NEW TABLE ST2')
UNION
Createsa union(join) table fromapairof tables.
Syntax:UNION(<table_expression1>,<table_expression2>[,<table_expression>]…)
Scenario:USTU1_STU2= UNION('NEWTABLE ST1','NEW TABLE ST2')
INTERSECT
Returnsthe row intersectionof twotables,retainingduplicates.
Syntax : INTERSECT(<table_expression1>,<table_expression2>)
Scenario:INTSTU1_STU2= INTERSECT('NEWTABLE ST1','NEW TABLE ST2')
GENERATESERIES
Returnsa single columntable containingthe valuesof anarithmeticseries,thatis,asequence of values
inwhicheach differsfromthe precedingbya constantquantity.The name of the columnreturnedis
Value.
Syntax:GENERATESERIES(<startValue>,<endValue>[,<incrementValue>])
Scenario:New Table=GENERATESERIES(1,10,2)
Returnsa table witha single column,startingwith1andincrementby2.
GROUPBY
The GROUPBY functionissimilartothe SUMMARIZE function.However,GROUPBYdoesnotdo an
implicitCALCULATEforany extensioncolumnsthatitadds.GROUPBY permitsanew function,
CURRENTGROUP(),to be usedinside aggregationfunctionsinthe extensioncolumnsthatitadds.
GROUPBY attemptsto reuse the data that hasbeengroupedmakingithighlyperformant.
Syntax:GROUPBY (<table>,[<groupBy_columnName1>],[<name>,<expression>]…)
Scenario:Inst_Mode_Total =
GROUPBY(FactPayments,FactPayments[InstituteID],FactPayments[ModeID],"Total
Fee",SUMx(currentgroup(),FactPayments[Discount_Fee]))
SUMMARIZECOLUMNS
Strict comparisonsemanticsare usedduringjoin.There isnotype coercion;forexample,1doesnot
equal 1.0. Returnsa summarytable overa set of groups.
Syntax:SUMMARIZECOLUMNS( <groupBy_columnName>[,< groupBy_columnName>]…,
[<filterTable>]…[,<name>,<expression>]…)
Scenario:Inst_Mode_Total =
SUMMARIZECOLUMNS(FactPayments[InstituteID],FactPayments[ModeID],FactPayments,"Total",SUM(F
actPayments[Discount_Fee]))
TREATAS
Appliesthe resultof a table expressionasfilterstocolumnsfromanunrelatedtable.
Syntax:TREATAS(table_expression,<column>[,<column>[,<column>[,…]]]} )
Scenario:Findingthe total fromDimcourse andDimcourse_new basedonselectionfromDimcourse
query.
1.create anothertable Dimcourse_newwithsimilarfew courseidvalues.
2. create connectionwithfacttable.
3. Take sliceranduse courseid
4. create measure like belowanduse incard.
NewMeasure=Diff_Tablesum=calculate(sum(FactPayments[Discount_Fee]),
treatas(values(DimCourse[CourseID]),DimCourse_New[CourseID]))
There are 2 types of calculations in DAX.
 Calculated Measures
 Calculated column
Calculated column Calculated Measures
Calculated column are created during the
data load (That means during refresh of the
data). It is stored as part of the data table.
Calculated column is always a row level. It
calculates row by row.
New measure is created is on the fly that
means it is not stored as part of the data
model, but it is created based on the context
of visualization.
Calculated columns are faster because the
values are be stored
Slower
Do not prefer Calculated column for
Ratio(coloumn1/coloumn2) activities.
For Ratio, you need to create a calculated
measure
When you are creating make sure that click
on the particular table which going to you are
creating calculated column.
When creating Calculated measures, no need
to click on a table why because we can drag
measure to a required table.
implicit Measure
Q) Why Explicit measures are better than Implicit measures
There are 3 reasons
 Control
 Re-Use
 Connected Reports
Calculated Columns
A calculated column is a new column that you can created by defining of a calculation that
transforms or combines two or more elements of existing Data. Creating a calculate column is a
simple way to enrich and enhance your data.
For example, you can create a new column by combing two columns into one.
One useful reason for creating calculated column is to a establish a relationship between two
tables, when no unique field exist that can be used to establish a relationship.
To create a measure in a report view Modeling TabNew Column
Calculated Measure
Is a calculation that exists in your Power BI data model.
To create a measure in a report view Modeling TabNew Measure
Drill Through
Entering Data
Here we can manually create a table also we can copy the data from excel to here.
Calendar Table
I can say that if there is a Date field in table, you better have to create a calendar table.
If a sales table start date 2014 and end date is 2016, the calendar table range must cover 2014
to 2017.then only we can cover all the data.
There are two benefits of creating a calendar table.
1)Time Saving—We can perform Date functions easily.
2)Look up table-We can take Date/Month as keys in this lookup table.
There are many ways to create a calendar table.
 1)Excel
 2)SQL
 3)Azure
 4)DAX (Calendar Auto)
But my favorite method is Using Power Bi Query Editor by using DAX function.
Power BI Desktop>Modeling tab>New Table>Enterbelow DAX function
D_Calendar = ADDCOLUMNS ( CALENDAR (DATE(2000,1,1), DATE(2049,12,31)), "Date_Int",
FORMAT ( [Date], "YYYYMMDD" ), "Year", YEAR ( [Date] ), "Month", FORMAT ( [Date], "MM" ),
"Year_Month", FORMAT ( [Date], "YYYY-MM" ), "Year_Month_Name", FORMAT ( [Date], "YYYY-
mmm" ), "Month_Name", FORMAT ( [Date], "mmm" ), "Week", WEEKDAY ( [Date] ), "Week_Day",
FORMAT ( [Date], "dddd" ), "Qtr", "Q" & FORMAT ( [Date], "Q" ), "Year_Qtr", FORMAT ( [Date],
"YYYY" ) & "-Q" & FORMAT ( [Date], "Q" ))
Creating and Managing Hierarchies
To help your users navigate through your data, you can create hierarchies to help them
understand the different levels in your data and how can they move up and down between
them.
Time Intelligence
Do exercise for Date field by using Drill Up and Drill down options
Manually typing Data in Data table
Yes, we can able to add data manually for table that table we created in query editor by using
Enter Data option in query editor.
Include and Exclude
Difference between Copy, Duplicate, Reference in Query Editor
When to use:
Copy Duplicate Reference
After creating a Duplicate
table, it will be shown all
applied steps from source
table.
After creating a Reference
table, it will not be shown all
applied steps from source
table.
If we change anything in
source table those changes
never reflected in Duplicate
table
If we change anything in
source table those changes
also reflected in Reference
table
If we change anything in
Duplicate table, it will not
affect Source table
If we change anything in
Reference table, it will not
affect Source table
Diff b/w Added column (Conditional Column) and Calculated column
Addcolumn- (Conditional column) Calculatedcolumn
Conditional columnyoucanfindinQuery
Editor.
CalculatedColumnyoucanfindinPowerBi Desktop
Hear Conditionsare used. DAXexpressionsare usedhear.
Buttons, Selection, Bookmarks and Toggle Button.
Buttons
 There islistof buttonsavailableinPowerBIdesktop.
 If you wantto create a ButtonwithSome text go to lastoption BLANK.Afterclickingthatbutton
an emptybuttonwill be appearinyourDesktop.Youcan give textto that Buttonbyusing
buttonproperties.
Bookmarks and Selection
For creatingBookmarksandSelectionyoujustnavigate toView tab. There youfindlistof optionsseen
inbelow.
Row Level Security
Row-Level security allows you to secure your data at the row level with security filters based on
roles you create. Using the Manage roles button in the Modeling Tab, you an create roles then
use DAX expressions to control what each role sees. Then, once you publish it up to the web,
you can assign users to each role.
Power BI Visualizations
Stacked bar chart Stacked ColumnChart
Line Chart Area Chart
Pie Chart Donut Chart
Tree Map Map Card
Gauge Multi Card KPI
Table Matrix
KPI Traffice Light Visulizations
Display Tool Tip Visual
Templates and Themes
Ask a Question Functionality
Whichis veryinteresting functionalitywhichhasgivenbyinPowerBi.
If you ask anyquestionof topof anyvisual itwill create new visual(The visual isbasedonarequested
question)
Understanding the Mash Up language behind GUI Options.
Publish a Report to the Web (Power BI cloud Service)
1. There are 2 ways to Publishareport,butbothare do same operations.
Menu,SelectFile>PublishtoWeb  Use GUI option
2. Clickon Publish
 Afterclickeditwill openthe dialogbox toEnter Credentials.
(If youalreadyloginwithcredentialswhile workingonReportmeansit will notaskagain)
 Give Office orany type of organizational accounts.Like @hcl.com.
(@gmail,@outllok,@yahoowill notworkhere)
AndIt will askyouto Selecta destination.(Listof workspaceswill be appeared).
Afterselecteddestination,youreportwill be published.
Afterpublishedyoucansee yourreportin https://app.powerbi.com/home
Go to workspace where you published. I published in My Workspace so am clicking on My
workspace, after you clicked you can be able to see your report.
We can also Edit the Report
 A dialogthatexplainsyouwillgetanembedcode thatletsyoushare the reporton a website or
inmail
 Whenyouselectcreate embedcode,PowerBIpresentsanotherdialog,tellingyouagainthat
youare about to share yourdata witheveryone onthe internet.Make sure thatis okay!
Dashboard
We can a pic multiple visual fromdifferentreportstoa Dashboard.
How to create a Dashboard
Clickon highliatedpart to create a new dashboard.
After clicked,Give the Name
Am givingname as Sample
Now you can add reports to this dashboard.
First go to a report and pin a visual which you want to add to a dashboard.
Clickon that pin symbol,it will opena windowthere you can map to existingdashoard or new one.
here also you have a chance to create a new dashboard.
Similarly,am adding two more visualsto tisdashboard.
After adding3 visualsinto a SAMPLE dashboard. Now check belowscreen.
(Ifyou click on any visual it will navigate to that actual report)
We can performbelowhighliatedthingsin a dashboard for a any visual.
Dataset
Power bi gateway
The systemthat lets you connect your on-premises data sources to the power BI service is
called the Data Gateway
It is small application that runs on your computer and uses a pre-arranged schedule to connect
to your data, gather any updates, and push them up to the Power BI service.
Gateways are categorized into 2 types.
 Personal Gateway
 Enterprise Gateway
The Personal Gateway is a version of the Data Gateway that can be used without any
administrator Configuration.
Note: personal mode gateways will not appear there, only Enterprise mode gateways will be
appeared. So, if you use enterprise gateway you will see it under Manage Gateways.
Free license allows us to schedule 8 times per a day.
Paid license which is more.
Key Points
 We are using that Sales(5000KB) excel file and developed a report and saved in local
machine with name Sales. pbix. If you compare size of .pbix file is lesser than the
original excels. pbix file size may be 2000KB. .pbix size is always lesser than the size
of original source
 If values are like 20.00,25.00,26.00 but you want like 20,25,26 so in this case change
data type of column to Text. So automatically values will come like without .00
 If you Want to hide a table in a Report view, you go to modeling part and do right
click(…) on the table and click on Hide in Report View.
Few Concepts in Power Bi
1) Ribbons in Power Bi
What is meant by Ribbon-Graphical control element is a graphical control element in
the form of a set of toolbars placed on several tabs. ... The usage of the term "ribbon"
Below example is a Ribbon of power Bi desktop in a Report View.
2) Advance Editor and Query Dependence in Query Editor.
3) Filters in Power Query and their Purpose in Query Editor
4) Types of Filters in Power Query (Basic Filtering, Advanced Filtering) in Query Editor
5) Auto Filter / Basic Filtering in Query Editor and Filter Multiple Columns
6) Group Rows / Group by in built Row Transformations in Query Editor
7) Manage Parameters (Manage Parameters, Edit Parameters, New Parameter) in Query
Editor
8) Suggested Values (Any Value, List of Values, Query), Convert to List
9) Query Parameters and Power BI Templates
10) .pbix(Power BI File) and .pbit(Power BI Template File)
11) Refresh Preview, Refresh All, Cancel Refresh
12) Sorting Data
Questions and Answers
1) Difference between Dashboard and Report?
2) What is DAX Studio?
3) Explain about Power Bi service and Power Bi Report server?
4) Difference between Fact, Dimension, Attribute in PowerBI?
5) Difference between Measure and Calculated Column?
6) Difference between Copy, Duplicate and Reference?
7) What Is meant by Calculated table in Power BI, and how many ways to create
calculate table?
8) Scheduling in Power BI?
9) Do you work on ALLEXCEPT function-DAX?
10) How to do filter to show the records by year wise or quarter wise or monthly wise?
11) What is Power Bi?
Power Bi is a self-serviced cloud-based Business Intelligence software.
12) Why can’t we directly create report on OLTP systems? Why it was not recommended?
13) Current version of Power Bi desktop?
2.83 64 bit released in July 2020
Project Info:
 Project Name?
 Which sources are using in your project?
 How you are using Gateways?
 SSAS ETL tool is using or not in your project?
 How will you share the Reports to Clients and With In your organization?
 Which cloud service is using in project?
 How to give access to your dashboard for a set of people?
 Scheduling intervals?
 How you are getting tasks-means how they are allocating work?
 How will you send the reports to testing team?
Power bi notes

More Related Content

What's hot

Power BI Online Training hyderabad | Power BI online Course
Power BI Online Training hyderabad   | Power BI online Course Power BI Online Training hyderabad   | Power BI online Course
Power BI Online Training hyderabad | Power BI online Course Cynix Technologies
 
Power BI vs Tableau: Which One is Best For Business Intelligence
Power BI vs Tableau: Which One is Best For Business IntelligencePower BI vs Tableau: Which One is Best For Business Intelligence
Power BI vs Tableau: Which One is Best For Business IntelligenceStat Analytica
 
Intro for Power BI
Intro for Power BIIntro for Power BI
Intro for Power BIMartin X
 
DAX and Power BI Training - 004 Power Query
DAX and Power BI Training - 004 Power QueryDAX and Power BI Training - 004 Power Query
DAX and Power BI Training - 004 Power QueryWill Harvey
 
Power BI Data Modeling.pdf
Power BI Data Modeling.pdfPower BI Data Modeling.pdf
Power BI Data Modeling.pdfVishnuGone
 
Data Visualization Using PowerBI.pdf
Data Visualization Using PowerBI.pdfData Visualization Using PowerBI.pdf
Data Visualization Using PowerBI.pdfR20BBA040
 
Power BI Made Simple
Power BI Made SimplePower BI Made Simple
Power BI Made SimpleJames Serra
 
Power BI Full Course | Power BI Tutorial for Beginners | Edureka
Power BI Full Course | Power BI Tutorial for Beginners | EdurekaPower BI Full Course | Power BI Tutorial for Beginners | Edureka
Power BI Full Course | Power BI Tutorial for Beginners | EdurekaEdureka!
 
Microsoft Power BI | Brief Introduction | PPT
Microsoft Power BI | Brief Introduction | PPTMicrosoft Power BI | Brief Introduction | PPT
Microsoft Power BI | Brief Introduction | PPTSophia Smith
 
What is Power BI
What is Power BIWhat is Power BI
What is Power BIDries Vyvey
 
Introduction to Power BI to make smart decisions
Introduction to Power BI to make smart decisionsIntroduction to Power BI to make smart decisions
Introduction to Power BI to make smart decisionsVIVEK GURURANI
 
Introduction to Microsoft Power BI
Introduction to Microsoft Power BIIntroduction to Microsoft Power BI
Introduction to Microsoft Power BICCG
 
Introduction to Power BI and Data Visualization
Introduction to Power BI and Data VisualizationIntroduction to Power BI and Data Visualization
Introduction to Power BI and Data VisualizationSwapnil Jadhav
 

What's hot (20)

Power bi
Power biPower bi
Power bi
 
Power BI Online Training hyderabad | Power BI online Course
Power BI Online Training hyderabad   | Power BI online Course Power BI Online Training hyderabad   | Power BI online Course
Power BI Online Training hyderabad | Power BI online Course
 
Power BI vs Tableau: Which One is Best For Business Intelligence
Power BI vs Tableau: Which One is Best For Business IntelligencePower BI vs Tableau: Which One is Best For Business Intelligence
Power BI vs Tableau: Which One is Best For Business Intelligence
 
Intro for Power BI
Intro for Power BIIntro for Power BI
Intro for Power BI
 
DAX and Power BI Training - 004 Power Query
DAX and Power BI Training - 004 Power QueryDAX and Power BI Training - 004 Power Query
DAX and Power BI Training - 004 Power Query
 
Power BI Data Modeling.pdf
Power BI Data Modeling.pdfPower BI Data Modeling.pdf
Power BI Data Modeling.pdf
 
Data Visualization Using PowerBI.pdf
Data Visualization Using PowerBI.pdfData Visualization Using PowerBI.pdf
Data Visualization Using PowerBI.pdf
 
Power BI Made Simple
Power BI Made SimplePower BI Made Simple
Power BI Made Simple
 
Power BI Overview
Power BI Overview Power BI Overview
Power BI Overview
 
Power Bi Basics
Power Bi BasicsPower Bi Basics
Power Bi Basics
 
Power BI Full Course | Power BI Tutorial for Beginners | Edureka
Power BI Full Course | Power BI Tutorial for Beginners | EdurekaPower BI Full Course | Power BI Tutorial for Beginners | Edureka
Power BI Full Course | Power BI Tutorial for Beginners | Edureka
 
Microsoft Power BI | Brief Introduction | PPT
Microsoft Power BI | Brief Introduction | PPTMicrosoft Power BI | Brief Introduction | PPT
Microsoft Power BI | Brief Introduction | PPT
 
What is Power BI
What is Power BIWhat is Power BI
What is Power BI
 
Introduction to Power BI to make smart decisions
Introduction to Power BI to make smart decisionsIntroduction to Power BI to make smart decisions
Introduction to Power BI to make smart decisions
 
Power bi overview
Power bi overview Power bi overview
Power bi overview
 
Power BI visuals
Power BI visualsPower BI visuals
Power BI visuals
 
Power BI
Power BIPower BI
Power BI
 
Introduction to Microsoft Power BI
Introduction to Microsoft Power BIIntroduction to Microsoft Power BI
Introduction to Microsoft Power BI
 
Power BI for Developers
Power BI for DevelopersPower BI for Developers
Power BI for Developers
 
Introduction to Power BI and Data Visualization
Introduction to Power BI and Data VisualizationIntroduction to Power BI and Data Visualization
Introduction to Power BI and Data Visualization
 

Similar to Power bi notes

Power BI vs Tableau | Key features and Comparison 2022 
Power BI vs Tableau | Key features and Comparison 2022 Power BI vs Tableau | Key features and Comparison 2022 
Power BI vs Tableau | Key features and Comparison 2022 Sparity1
 
Summary of all tools and microsoft power bi
Summary of all tools and microsoft power biSummary of all tools and microsoft power bi
Summary of all tools and microsoft power biOmar Khan
 
LIBA++Lecture+Notes_Power+BI.docx.pdf
LIBA++Lecture+Notes_Power+BI.docx.pdfLIBA++Lecture+Notes_Power+BI.docx.pdf
LIBA++Lecture+Notes_Power+BI.docx.pdfDivya Thakur
 
Sap Interview Questions - Part 1
Sap Interview Questions - Part 1Sap Interview Questions - Part 1
Sap Interview Questions - Part 1ReKruiTIn.com
 
MICROSOFT POWER BI PPT.pptx
MICROSOFT POWER BI PPT.pptxMICROSOFT POWER BI PPT.pptx
MICROSOFT POWER BI PPT.pptxridazulquarnain
 
Power BI by Lamees El-Ghazily.pptx
Power BI by Lamees El-Ghazily.pptxPower BI by Lamees El-Ghazily.pptx
Power BI by Lamees El-Ghazily.pptxLamees EL- Ghazoly
 
ActiveWarehouse/ETL - BI & DW for Ruby/Rails
ActiveWarehouse/ETL - BI & DW for Ruby/RailsActiveWarehouse/ETL - BI & DW for Ruby/Rails
ActiveWarehouse/ETL - BI & DW for Ruby/RailsPaul Gallagher
 
Power business intelligence
Power business intelligencePower business intelligence
Power business intelligenceaasthabadoniya1
 
Power BI - Business Intelligence Getting Started Guide - PREVIEW
Power BI - Business Intelligence Getting Started Guide - PREVIEWPower BI - Business Intelligence Getting Started Guide - PREVIEW
Power BI - Business Intelligence Getting Started Guide - PREVIEWDavid J Rosenthal
 
Microsoft Power Stack 2019 [Power BI, Excel, Azure & Friends]
Microsoft Power Stack 2019 [Power BI, Excel, Azure & Friends]Microsoft Power Stack 2019 [Power BI, Excel, Azure & Friends]
Microsoft Power Stack 2019 [Power BI, Excel, Azure & Friends]Olivier Travers
 
Power bi (1)Power BI Online Training Hyderabad | power bi online training ben...
Power bi (1)Power BI Online Training Hyderabad | power bi online training ben...Power bi (1)Power BI Online Training Hyderabad | power bi online training ben...
Power bi (1)Power BI Online Training Hyderabad | power bi online training ben...Big IT Trainings
 
Microsoft Power BI Overview
Microsoft Power BI OverviewMicrosoft Power BI Overview
Microsoft Power BI OverviewNetwoven Inc.
 
Business Reporting with SharePoint And Self-service BI with PowerPivot
Business Reporting with SharePoint And Self-service BI with PowerPivotBusiness Reporting with SharePoint And Self-service BI with PowerPivot
Business Reporting with SharePoint And Self-service BI with PowerPivotPerficient, Inc.
 
powerbi_advanced_cheatsheet.LECTURE NOTES PDF
powerbi_advanced_cheatsheet.LECTURE NOTES PDFpowerbi_advanced_cheatsheet.LECTURE NOTES PDF
powerbi_advanced_cheatsheet.LECTURE NOTES PDFProject Cubicle
 
Difference Between Power BI and Tavleau.pptx
Difference Between Power BI and Tavleau.pptxDifference Between Power BI and Tavleau.pptx
Difference Between Power BI and Tavleau.pptxSanjeev Banerjee
 

Similar to Power bi notes (20)

Power BI vs Tableau | Key features and Comparison 2022 
Power BI vs Tableau | Key features and Comparison 2022 Power BI vs Tableau | Key features and Comparison 2022 
Power BI vs Tableau | Key features and Comparison 2022 
 
Summary of all tools and microsoft power bi
Summary of all tools and microsoft power biSummary of all tools and microsoft power bi
Summary of all tools and microsoft power bi
 
LIBA++Lecture+Notes_Power+BI.docx.pdf
LIBA++Lecture+Notes_Power+BI.docx.pdfLIBA++Lecture+Notes_Power+BI.docx.pdf
LIBA++Lecture+Notes_Power+BI.docx.pdf
 
Sap Interview Questions - Part 1
Sap Interview Questions - Part 1Sap Interview Questions - Part 1
Sap Interview Questions - Part 1
 
PowerBIvsTableau.pptx
PowerBIvsTableau.pptxPowerBIvsTableau.pptx
PowerBIvsTableau.pptx
 
MICROSOFT POWER BI PPT.pptx
MICROSOFT POWER BI PPT.pptxMICROSOFT POWER BI PPT.pptx
MICROSOFT POWER BI PPT.pptx
 
Power BI by Lamees El-Ghazily.pptx
Power BI by Lamees El-Ghazily.pptxPower BI by Lamees El-Ghazily.pptx
Power BI by Lamees El-Ghazily.pptx
 
ActiveWarehouse/ETL - BI & DW for Ruby/Rails
ActiveWarehouse/ETL - BI & DW for Ruby/RailsActiveWarehouse/ETL - BI & DW for Ruby/Rails
ActiveWarehouse/ETL - BI & DW for Ruby/Rails
 
Power business intelligence
Power business intelligencePower business intelligence
Power business intelligence
 
Power BI - Business Intelligence Getting Started Guide - PREVIEW
Power BI - Business Intelligence Getting Started Guide - PREVIEWPower BI - Business Intelligence Getting Started Guide - PREVIEW
Power BI - Business Intelligence Getting Started Guide - PREVIEW
 
Microsoft Power Stack 2019 [Power BI, Excel, Azure & Friends]
Microsoft Power Stack 2019 [Power BI, Excel, Azure & Friends]Microsoft Power Stack 2019 [Power BI, Excel, Azure & Friends]
Microsoft Power Stack 2019 [Power BI, Excel, Azure & Friends]
 
Power BI Interview Questions
Power BI Interview QuestionsPower BI Interview Questions
Power BI Interview Questions
 
SAP BI/BW
SAP BI/BWSAP BI/BW
SAP BI/BW
 
Power bi (1)Power BI Online Training Hyderabad | power bi online training ben...
Power bi (1)Power BI Online Training Hyderabad | power bi online training ben...Power bi (1)Power BI Online Training Hyderabad | power bi online training ben...
Power bi (1)Power BI Online Training Hyderabad | power bi online training ben...
 
Microsoft Power BI Overview
Microsoft Power BI OverviewMicrosoft Power BI Overview
Microsoft Power BI Overview
 
DA Syllabus outline (2).pptx
DA Syllabus outline (2).pptxDA Syllabus outline (2).pptx
DA Syllabus outline (2).pptx
 
Business Reporting with SharePoint And Self-service BI with PowerPivot
Business Reporting with SharePoint And Self-service BI with PowerPivotBusiness Reporting with SharePoint And Self-service BI with PowerPivot
Business Reporting with SharePoint And Self-service BI with PowerPivot
 
powerbi_advanced_cheatsheet.LECTURE NOTES PDF
powerbi_advanced_cheatsheet.LECTURE NOTES PDFpowerbi_advanced_cheatsheet.LECTURE NOTES PDF
powerbi_advanced_cheatsheet.LECTURE NOTES PDF
 
Difference Between Power BI and Tavleau.pptx
Difference Between Power BI and Tavleau.pptxDifference Between Power BI and Tavleau.pptx
Difference Between Power BI and Tavleau.pptx
 
Power BI
Power BIPower BI
Power BI
 

Recently uploaded

Building Real-Time Data Pipelines: Stream & Batch Processing workshop Slide
Building Real-Time Data Pipelines: Stream & Batch Processing workshop SlideBuilding Real-Time Data Pipelines: Stream & Batch Processing workshop Slide
Building Real-Time Data Pipelines: Stream & Batch Processing workshop SlideChristina Lin
 
XpertSolvers: Your Partner in Building Innovative Software Solutions
XpertSolvers: Your Partner in Building Innovative Software SolutionsXpertSolvers: Your Partner in Building Innovative Software Solutions
XpertSolvers: Your Partner in Building Innovative Software SolutionsMehedi Hasan Shohan
 
办理学位证(UQ文凭证书)昆士兰大学毕业证成绩单原版一模一样
办理学位证(UQ文凭证书)昆士兰大学毕业证成绩单原版一模一样办理学位证(UQ文凭证书)昆士兰大学毕业证成绩单原版一模一样
办理学位证(UQ文凭证书)昆士兰大学毕业证成绩单原版一模一样umasea
 
The Essentials of Digital Experience Monitoring_ A Comprehensive Guide.pdf
The Essentials of Digital Experience Monitoring_ A Comprehensive Guide.pdfThe Essentials of Digital Experience Monitoring_ A Comprehensive Guide.pdf
The Essentials of Digital Experience Monitoring_ A Comprehensive Guide.pdfkalichargn70th171
 
Implementing Zero Trust strategy with Azure
Implementing Zero Trust strategy with AzureImplementing Zero Trust strategy with Azure
Implementing Zero Trust strategy with AzureDinusha Kumarasiri
 
Building a General PDE Solving Framework with Symbolic-Numeric Scientific Mac...
Building a General PDE Solving Framework with Symbolic-Numeric Scientific Mac...Building a General PDE Solving Framework with Symbolic-Numeric Scientific Mac...
Building a General PDE Solving Framework with Symbolic-Numeric Scientific Mac...stazi3110
 
Advancing Engineering with AI through the Next Generation of Strategic Projec...
Advancing Engineering with AI through the Next Generation of Strategic Projec...Advancing Engineering with AI through the Next Generation of Strategic Projec...
Advancing Engineering with AI through the Next Generation of Strategic Projec...OnePlan Solutions
 
Cloud Management Software Platforms: OpenStack
Cloud Management Software Platforms: OpenStackCloud Management Software Platforms: OpenStack
Cloud Management Software Platforms: OpenStackVICTOR MAESTRE RAMIREZ
 
Asset Management Software - Infographic
Asset Management Software - InfographicAsset Management Software - Infographic
Asset Management Software - InfographicHr365.us smith
 
Unit 1.1 Excite Part 1, class 9, cbse...
Unit 1.1 Excite Part 1, class 9, cbse...Unit 1.1 Excite Part 1, class 9, cbse...
Unit 1.1 Excite Part 1, class 9, cbse...aditisharan08
 
Try MyIntelliAccount Cloud Accounting Software As A Service Solution Risk Fre...
Try MyIntelliAccount Cloud Accounting Software As A Service Solution Risk Fre...Try MyIntelliAccount Cloud Accounting Software As A Service Solution Risk Fre...
Try MyIntelliAccount Cloud Accounting Software As A Service Solution Risk Fre...MyIntelliSource, Inc.
 
Professional Resume Template for Software Developers
Professional Resume Template for Software DevelopersProfessional Resume Template for Software Developers
Professional Resume Template for Software DevelopersVinodh Ram
 
EY_Graph Database Powered Sustainability
EY_Graph Database Powered SustainabilityEY_Graph Database Powered Sustainability
EY_Graph Database Powered SustainabilityNeo4j
 
Alluxio Monthly Webinar | Cloud-Native Model Training on Distributed Data
Alluxio Monthly Webinar | Cloud-Native Model Training on Distributed DataAlluxio Monthly Webinar | Cloud-Native Model Training on Distributed Data
Alluxio Monthly Webinar | Cloud-Native Model Training on Distributed DataAlluxio, Inc.
 
Call Girls in Naraina Delhi 💯Call Us 🔝8264348440🔝
Call Girls in Naraina Delhi 💯Call Us 🔝8264348440🔝Call Girls in Naraina Delhi 💯Call Us 🔝8264348440🔝
Call Girls in Naraina Delhi 💯Call Us 🔝8264348440🔝soniya singh
 
What is Fashion PLM and Why Do You Need It
What is Fashion PLM and Why Do You Need ItWhat is Fashion PLM and Why Do You Need It
What is Fashion PLM and Why Do You Need ItWave PLM
 
What are the features of Vehicle Tracking System?
What are the features of Vehicle Tracking System?What are the features of Vehicle Tracking System?
What are the features of Vehicle Tracking System?Watsoo Telematics
 
ODSC - Batch to Stream workshop - integration of Apache Spark, Cassandra, Pos...
ODSC - Batch to Stream workshop - integration of Apache Spark, Cassandra, Pos...ODSC - Batch to Stream workshop - integration of Apache Spark, Cassandra, Pos...
ODSC - Batch to Stream workshop - integration of Apache Spark, Cassandra, Pos...Christina Lin
 
Intelligent Home Wi-Fi Solutions | ThinkPalm
Intelligent Home Wi-Fi Solutions | ThinkPalmIntelligent Home Wi-Fi Solutions | ThinkPalm
Intelligent Home Wi-Fi Solutions | ThinkPalmSujith Sukumaran
 
KnowAPIs-UnknownPerf-jaxMainz-2024 (1).pptx
KnowAPIs-UnknownPerf-jaxMainz-2024 (1).pptxKnowAPIs-UnknownPerf-jaxMainz-2024 (1).pptx
KnowAPIs-UnknownPerf-jaxMainz-2024 (1).pptxTier1 app
 

Recently uploaded (20)

Building Real-Time Data Pipelines: Stream & Batch Processing workshop Slide
Building Real-Time Data Pipelines: Stream & Batch Processing workshop SlideBuilding Real-Time Data Pipelines: Stream & Batch Processing workshop Slide
Building Real-Time Data Pipelines: Stream & Batch Processing workshop Slide
 
XpertSolvers: Your Partner in Building Innovative Software Solutions
XpertSolvers: Your Partner in Building Innovative Software SolutionsXpertSolvers: Your Partner in Building Innovative Software Solutions
XpertSolvers: Your Partner in Building Innovative Software Solutions
 
办理学位证(UQ文凭证书)昆士兰大学毕业证成绩单原版一模一样
办理学位证(UQ文凭证书)昆士兰大学毕业证成绩单原版一模一样办理学位证(UQ文凭证书)昆士兰大学毕业证成绩单原版一模一样
办理学位证(UQ文凭证书)昆士兰大学毕业证成绩单原版一模一样
 
The Essentials of Digital Experience Monitoring_ A Comprehensive Guide.pdf
The Essentials of Digital Experience Monitoring_ A Comprehensive Guide.pdfThe Essentials of Digital Experience Monitoring_ A Comprehensive Guide.pdf
The Essentials of Digital Experience Monitoring_ A Comprehensive Guide.pdf
 
Implementing Zero Trust strategy with Azure
Implementing Zero Trust strategy with AzureImplementing Zero Trust strategy with Azure
Implementing Zero Trust strategy with Azure
 
Building a General PDE Solving Framework with Symbolic-Numeric Scientific Mac...
Building a General PDE Solving Framework with Symbolic-Numeric Scientific Mac...Building a General PDE Solving Framework with Symbolic-Numeric Scientific Mac...
Building a General PDE Solving Framework with Symbolic-Numeric Scientific Mac...
 
Advancing Engineering with AI through the Next Generation of Strategic Projec...
Advancing Engineering with AI through the Next Generation of Strategic Projec...Advancing Engineering with AI through the Next Generation of Strategic Projec...
Advancing Engineering with AI through the Next Generation of Strategic Projec...
 
Cloud Management Software Platforms: OpenStack
Cloud Management Software Platforms: OpenStackCloud Management Software Platforms: OpenStack
Cloud Management Software Platforms: OpenStack
 
Asset Management Software - Infographic
Asset Management Software - InfographicAsset Management Software - Infographic
Asset Management Software - Infographic
 
Unit 1.1 Excite Part 1, class 9, cbse...
Unit 1.1 Excite Part 1, class 9, cbse...Unit 1.1 Excite Part 1, class 9, cbse...
Unit 1.1 Excite Part 1, class 9, cbse...
 
Try MyIntelliAccount Cloud Accounting Software As A Service Solution Risk Fre...
Try MyIntelliAccount Cloud Accounting Software As A Service Solution Risk Fre...Try MyIntelliAccount Cloud Accounting Software As A Service Solution Risk Fre...
Try MyIntelliAccount Cloud Accounting Software As A Service Solution Risk Fre...
 
Professional Resume Template for Software Developers
Professional Resume Template for Software DevelopersProfessional Resume Template for Software Developers
Professional Resume Template for Software Developers
 
EY_Graph Database Powered Sustainability
EY_Graph Database Powered SustainabilityEY_Graph Database Powered Sustainability
EY_Graph Database Powered Sustainability
 
Alluxio Monthly Webinar | Cloud-Native Model Training on Distributed Data
Alluxio Monthly Webinar | Cloud-Native Model Training on Distributed DataAlluxio Monthly Webinar | Cloud-Native Model Training on Distributed Data
Alluxio Monthly Webinar | Cloud-Native Model Training on Distributed Data
 
Call Girls in Naraina Delhi 💯Call Us 🔝8264348440🔝
Call Girls in Naraina Delhi 💯Call Us 🔝8264348440🔝Call Girls in Naraina Delhi 💯Call Us 🔝8264348440🔝
Call Girls in Naraina Delhi 💯Call Us 🔝8264348440🔝
 
What is Fashion PLM and Why Do You Need It
What is Fashion PLM and Why Do You Need ItWhat is Fashion PLM and Why Do You Need It
What is Fashion PLM and Why Do You Need It
 
What are the features of Vehicle Tracking System?
What are the features of Vehicle Tracking System?What are the features of Vehicle Tracking System?
What are the features of Vehicle Tracking System?
 
ODSC - Batch to Stream workshop - integration of Apache Spark, Cassandra, Pos...
ODSC - Batch to Stream workshop - integration of Apache Spark, Cassandra, Pos...ODSC - Batch to Stream workshop - integration of Apache Spark, Cassandra, Pos...
ODSC - Batch to Stream workshop - integration of Apache Spark, Cassandra, Pos...
 
Intelligent Home Wi-Fi Solutions | ThinkPalm
Intelligent Home Wi-Fi Solutions | ThinkPalmIntelligent Home Wi-Fi Solutions | ThinkPalm
Intelligent Home Wi-Fi Solutions | ThinkPalm
 
KnowAPIs-UnknownPerf-jaxMainz-2024 (1).pptx
KnowAPIs-UnknownPerf-jaxMainz-2024 (1).pptxKnowAPIs-UnknownPerf-jaxMainz-2024 (1).pptx
KnowAPIs-UnknownPerf-jaxMainz-2024 (1).pptx
 

Power bi notes

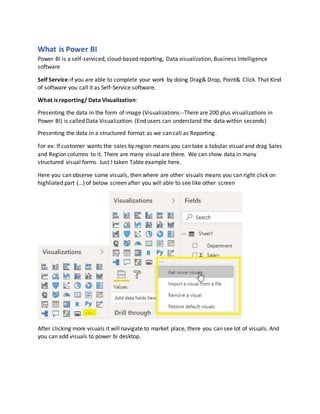
  • 1. What is Power BI Power BI is a self-serviced, cloud-based reporting, Data visualization, Business Intelligence software Self Service-if you are able to complete your work by doing Drag& Drop, Point& Click. That Kind of software you call it as Self-Service software. What is reporting/ Data Visualization: Presenting the data in the form of image (Visualizations--There are 200 plus visualizations in Power BI) is called Data Visualization. (End users can understand the data within seconds) Presenting the data in a structured format as we can call as Reporting. For ex: If customer wants the sales by region means you can take a tabular visual and drag Sales and Region columns to it. There are many visual are there. We can show data in many structured visual forms. Just I taken Table example here. Here you can observe some visuals, then where are other visuals means you can right click on highliated part (…) of below screen after you will able to see like other screen After clicking more visuals it will navigate to market place, there you can see lot of visuals. And you can add visuals to power bi desktop.
  • 2. (Hardly tableau have 50plus visualizations. This is also one of the differences between the Power BI and tableau.) Data analytics: if you have million of records and top of it you want to calculate some of sales, then how will you do you cannot manually do sum, in this case you need some data analytic software. this case power Bi will take care of it. Power Bi has a feature When you call data analyticsoftware—with the help of some software you are able to analyze huge volume of data. We call the software is called Data analytic software. Power Bi is a tool where you can load millions of data and you can perform analysis on the data. Business Intelligence: BI is the process which converts business data into actionable item. Business data means-=OLTP systems Actionable Item= Reports/Dashboards Company-Amazon Business-E commerce Business data-Generally what type of business data E commerce company have
  • 3. Like-how many sales are happened in last year, how many orders cancelled. And etc. OLTP ETL OLAP Reports/Dashboard Sharing with client -Entire this process is called Business Intelligence. By using all Power Bi components, we can do BI activities. Power Bi Components/Software’s/Tools/Product 1) Power Bi Desktop- A Development Software (A Desktop-based authoring tool of choice for connecting, transforming, and modeling data for creating interactive reports)  Power Query- ETL (Power Query Editor) How will you go to Power Query
  • 4. In Power Bi desktop there is a option called Transform data/Edit queries. It will navigate to query editor. That part is called “Power Query” There we Can Prepare the data for Reporting by Transform option (Data preparation activities). here We can do transformations (ETL Operations). For doing all these activities we have GUI options in Query Editor. Behind GUI options Microsoft are written in M language Code. Once did close and apply means the data will load to Power Pivot. When you load the table from power query to power pivot, you can see the tables in Model view. Power Query uses M language do to transformations.  Power Pivot- OLAP. in this section you can perform DAX Power Pivot is a In-memory component(xvelocity)- In memory component means it is also database which contains tables (which we are loaded from power Query). Power Pivot is a in memory database. It can store all the tables along with the data. When compare to normal database, In-memory data base are much powerful. Internally we have a software for Power Pivot, that software name is vertipac software. (And similarly, we have SAP in memory database in market) When you click on Close and Apply in Power Query, this vertipac software will come into the picture. What vertipac does means- it will compress (Approx. 1/10th of source data) the data and stores the data in columnar format. This is completely is a internally mechanism. As a developer we no need do anything here. Power BI will take care of it. If Normal source having 5 tables with 100GB memory means, in power pivot vertipac will compress into 10GB data. So, it compressing 1/10th part of original size. Why in memories databases are Powerful
  • 5. In Normal database (SQl or Oracle), they can store the data in row wise. When it comes to in memory database they can store the data columnwise. In memory means always they usa RAM memory. Data will be loaded to application after some transformations., Data Modeling-establishing the relationship between tables is called Data Modeling activities. creating schemas, we can create new information from existing info. Creating columns and Measures. DAX functions-Data analysis expression language-Functional language. In power Pivot total we can perform 2 tasks: 1)Data modeling activities --will be done in model view 2)Enhancing data- Creating new information using existed information.—these will be done in Data view. Ex: by using DAX functions we can do some operations here. Power pivot uses DAX language to enhance the data.  Online answer what will you do in power pivot is we prepare a dataset.  Power View- Create reports. We will use dataset(which was prepared in power pivot step) as datasource to create a report in power view. Visualizing the data, Creating Visualizations (Data Visualization activities) Based on color you can find which indicates to which one. Power Query Power Pivot Power View 2)Power BI Service- Azure cloud-based server which is used to sharing the reports with End user. https://app.powerbi.com A web-based service for collaboration, sharing, creation of dashboards, and additional functionality such as Q&A and alerts. It may also be referred to as the “Power Bi Site” or PowerBI.com or the Power Bi Web Portal
  • 6. 3)Power BI Reporting Server- On Premise server which is used to sharing the reports with End user. An alternative to the Power BI Service for deploying Power Bi Reports within an on-premises data center, as opposed to the cloud-based Power Bi Service. Power BI Report Server requires a Power BI Premium license. 4) Power BI Mobile-Viewing the Reports and dashboards from anywhere in Mobile. 5)On-Premises Gateway- An agent installed within the corporate network to allow secure access to organizational data stored on-premises. There are two options: Enterprise and Personal 6)Power BI Embedded- APIs for embedding visuals into a custom application. Power BI Architecture
  • 7. License Power Bi Free:  Incudes the ability to use the power bi Service for personal use.  It allows you to connect hundreds of data sources (no limit/restriction other than the amount of data you pull in), clean and prepare your data, and build visualizations (no limit). All the types of visualizations options in Power BI Pro are available in Power BI free. Power Bi Pro:  Incudes all power BI free features.  The Size of an importeddatasetislimitedto2GB perindividuadataset.  A data refreshscheduleforanimporteddatasetislimitedtoa maximumof 8 timesperdaywith a PowerBi Prolicense.
  • 8. Power Bi Premium:  PowerBi PremiumalsoincludesaPowerBi ReportServersubscription.  On-Premisesreportpublishing.APIsforcustomapplicationintegration.
  • 9.
  • 10. OLTP and OLAP OLTP-Online Transactional Processing OLAP- Online Analytical Processing OLTP Systems will store the day to day business data transactions. There we can perform insert/delete/update operations. OLTP systems are not recommended for Analysis/Reporting purpose. OLAP Systems are Data Warehouse, there we can have extracted data from different sources to analyze the data. What data we need to move From OLTP to OLAP is the Data that is required for Analysis Purpose. In below case we no need entire business data, we need only finance data for analyzing/creating the report. ETL-Extract, Transform,Load Transform- convertingthe datafromone format toanotherformat iscalledTransforming. Get Data Is used to get the data from different sources. Power BI supportsmorethan100 different data sources. Get Data GUI option is available in both Desktop and Query Editor Pane.  When we are getting data from Desktop that time “Load”, “Transform” ,” Cancel” buttons are available. If Developer Click on Transform button, it will navigate to Query Editor pane. There we can do Transformations.
  • 11.  If you are getting data in Query Editor pane, that time “Load”, “Cancel” buttons will be available. Why because you are already in Transforms editor panel so here no need Transform button. Different type of data source are: 1)File- Excel, Text/CSV, XML, JSON, Folder, PDF, SharePoint Folder. 2)Database-SQL Server Database, Oracle Database, MySQL Database, Postgre Database etc... 3)Power Platform-Power BI Datasets, Power BI data flows, etc.… 4)Azure-Azure SQL Database, Azure SQL Datawarehouse etc.… 5)Online Services-Facebook, Google Analytics, Salesforce Objects, Azure Devops (Beta) etc.… 6)Others-Web, Python script, Spark, R Script etc.… Get Data from Excel: If “Simple “Excel having 5 sheets means, Power Bi will convert in 5 pivot tables. Below screenshots from Power BI Software How to do data looks like structured way. Here an Example by using Excel format. Load below excel into Query Editor
  • 12. After loading. It shows like blow Step 1: Do Transpose -This is treats like Rows as Column and Column as Rows Step 2: Fill The data to remove nulls Step 3: Make 1st column as Header Step 4: Unpivot the years columns
  • 13. Step 5: Rename the column names how you need it. Working with SQL Server Database Import Mode Direct Mode Splitting Columns: Power BI have an option to split the columns. Ex: We have Table with the column “Full Name”. Task: Split the FirstName column like first name and last name.
  • 14. Solution: There are few possibilities to split the column. In Query Editor we can do that by Right click on required column. Split columnsBy delimiter (in our example we have spaces in between words so am using delimiter option, but there are different options available based on our scenarios)
  • 15. After clicked on OK on above screen, the data comes like below. You can observe that Full Name is spitted into Full Name1 and Full Name2. If you want change the column names you can change how you want. Keynote: You cannot split column when column data type is DATE.in this case change data type to text and do operations what you need and then later change datatype to DATE. And to do Date operations we have a “Date “option in Query Editor GUI. Change Data Type  Data types are in Power BI  Decimal Number  Fixed Decimal Number  Whole Number  Percentage  Date/Time  Date  Time
  • 16.  Date/Time/Time zone  Duration  Text  True/False  Binary Once you have uploaded the data in your power bi desktop, we must make sure the data tables that we are uploaded should have some unique property to it. Ex: A “Sample “table that contains a date values under “Date” column’s that data type of the column must be date. In above image the data type of “Date” column is “Any”. So you have to change the type to “Date” After clicked “Date”. The data type changed to Date.
  • 17. Working with Dates: We have a column with Dates. There you can see records are like this format under Date column 19-06-1989 But in report you want to show like below Case1: Add an extra column with Year values Date Year 19-06-1989 1989 In above case you must click on ADD Column option in query Editor.
  • 18. Case 2: In the same column you must show year instead of entire Date.
  • 19. If you clearly observe above 2 columns Complete Date records under Date column itself changed to Year wise. So Key points are:  When you are doing under ADD column Tab means the extra column is adding for that table (Case 1).  When you are doing same operation under Transform Tab means it will Transforming/Changing the same column (Case 2)  Dimensions table to Fact table default relationship is One To Many. ADD Columns  Merge Columns We have a table withFirstName andLast Name columns.Butwe wantto show Full Name ina single column.Inthiscase PowerQueryEditor>Addcolumn>Merge Columns. These are the separatoroptionswhenwe are Mergingthe selectedcolumns.
  • 20.  Conditional Columns The heading itself says that a column which is based on certain condition. Ex: Add a column if country=USA then it should be region If Country=India it should be sub region If Country not equal to India or USA, then it should be Others Current Data: After adding a condition for new column
  • 21. Merge and Append Queries Merge: We have a table with names Student and Teacher. There we have a common ID column. Power BI provides a feature to combine/merge the tables. (Joining conditions required)
  • 23. When to go for Merge: Here an Example: We knew that In Snowflake Schema must have a relationship between 2 Dimension tables. In this case if we use merge these 2 dimensions table into a single table by using Merge Concept so that automatically schema also moved to Star Schema. Merging the Tables using Multiple Join Conditions How to Merge 3 Tables Use Fuzzy Matching Option Append: It means appears another table data in the same table which we want to append it. (No Joining conditions required). We can call Append as a Union in Database world.
  • 24. When to go for Append: Here an Example: Suppose we have 2 tables with same columns in our schema better to make a single table by using Append. A simple explanation: We have a “Prod” table in SQL server, Excel file. But we need these two tables in our requirement. In this case we will fetch Prod table from 2(SQL and Excel) Sources. So, after get Prod table in query editor we will have 2 mentions with prod table. So, we can union the both two Prod tables into a Single able by using Append functionality. Query Options in Query Editor a) Copy Query,Paste Query, Delete Query,Rename Query b) Enable Load, Include in report Refresh c) Duplicate Query, Reference Query d) Move to Group,Move Up, Move Down e) Create Function, Convertto Parameter f) Advanced Editor,Properties
  • 25. Data Modeling Creating a Report is not called Data Modeling 1. Dimension Column, Fact Column, Dimension Table, Fact Table Fact column/Measure column: A column should satisfy 2 conditions,  The data type of the column must be a number  The number column needs to create an impact on the business Dimension column. The data type of the column may or may not be numeric. All text columns and date columns are dimension columns. In below example. Channel Type and Customer Country are Dimensions Sales Amount is a Fact column. Channel type Customer Country Sales Amount A india 100$ B Usa 101$ Fact (Data)= Data table contains a information about process. Data Table=Business Process Dimension (Look-Up) =who what when where how - (Calendar table also a lookup table) Measures-Define ones use it everywhere Data Table (Fact Table) Lookup Table (Dimensions) Business Process Who, What, Where, When, How Tall & Skinny Shor & Squat Numbers Words
  • 26. Relationships One to Many Relationship: Below one is an example of one to many. Why because one customer can purchase number of sales. One to One Relationship Many toOne Relationship Many toMany Relationship Schemas in Power BI First, we need to understand Facts and Dimensions before we start Schemas. Ex: Total Sales, Product Values these are numbers and I can say these are Measures. Measures are numbers. Measures majorly stored in Fact Tables. And Dimensions describes what these measures mean.
  • 27. 1)Star Schema  Here Data is de-normalized. And Joining’s are less. More Maintenance. 2)Snowflake Schema  At least one of the dimension table should not have a relationship with Fact table.  Here Data is normalized. And Joining’s are more. Less Maintenance.  Extended of star schema is called snowflake schema.
  • 28. 3) Galaxy Schema or Hybrid Schema or Fact Constellation Schema A Galaxy Schema contains two fact table that share dimension tables between them. It is also called fact Constellation Schema. The schema is viewed as a collection of stars hence the name Galaxy Schema. DAX Data Analysis Expression – Categories Measures are 2 Types  Implicit Measure-SUM, MAX,MIN  Explicit MeasureWe have to write manually, by clicking new column, new table Quick Measures DAXis a functional language. What DAXcontain is Functions+ Operators,withthe helpof functionsandoperatorsyouwill writethe DAX.  TextFunctions  Logical Functions  Date andTime Functions  FilterFunctions  Math & Statistical Functions  Time IntelligenceFunctions  Informationfunctions
  • 29.  Iterative Functions  Parentand childfunctions  Otherfunctions  Rank FunctionsandVariable Text Functions: CONCATENATE Joinstwotextstringsintoone textstring. Syntax:CONCATENATE(<text1>,<text2>) Scenario:newmeasure:=concatenate(sanjay,bi) CONCATENATEX Concatenatesthe resultof anexpressionevaluatedforeachrow ina table Syntax:CONCATENATEX(<table>,<expression>,[delimiter]) CONCATENATEX(STUDENT,[FirstName] &“ “ & [LastName],“,”hlihkhi EXACT ComparestwotextstringsandreturnsTRUE if theyare exactlythe same,FALSEotherwise.EXACTis case-sensitivebutignoresformattingdifferences.Youcanuse EXACT to testtextbeingenteredintoa document. Syntax:EXACT(<text1>,<text2>) FIND Returnsthe startingpositionof one textstringwithinanothertextstring.FINDiscase-sensitive. Syntax:FIND(<find_text>,<within_text>[,[<start_num>][,<NotFoundValue>]]) Example The followingformulafindsthe positionof the firstletterof the productdesignation,BMX,inthe string that containsthe productdescription. =FIND("BMX","lineof BMXracing goods") LEFT Returnsthe specifiednumberof charactersfromthe start of a textstring. Syntax:LEFT(<text>,<num_chars>) Returnsthe numberof characters ina textstring. RIGHT RIGHT returnsthe lastcharacter or characters ina textstring,basedonthe numberof characters you specify.
  • 30. Syntax:RIGHT(<text>,<num_chars>) LEN Returnsthe numberof characters ina textstring. Syntax:LEN(<text>) LOWER Convertsall lettersinatextstringto lowercase. Syntax:LOWER(<TEXT>) UPPER Convertsa textstringtoall uppercase letters Syntax:UPPER(<TEXT>) MID Returnsa stringof charactersfrom the middle of atextstring,givena startingpositionandlength. Syntax:MID(<text>,<start_num>,<num_chars>) REPLACE REPLACE replacespartof a textstring,basedonthe numberof characters youspecify,withadifferent textstring. Syntax:REPLACE(<old_text>,<start_num>,<num_chars>,<new_text>) REPITITION Repeatstextagivennumberof times.Use REPT to fill acell witha numberof instancesof a textstring. Syntax:REPT(<text>,<num_times>) SEARCH Returnsthe numberof the character at whicha specificcharacteror textstringisfirstfound,reading lefttoright.Search iscase-insensitiveandaccentsensitive. Syntax:SEARCH(<find_text>,<within_text>[,[<start_num>][,<NotFoundValue>]]) TRIM Removesall spacesfromtext exceptforsinglespacesbetweenwords. Syntax:TRIM(<text>) VALUE Convertsa textstringthatrepresentsanumberto a number. Syntax:VALUE(<text>)
  • 31. Logical Functions Logical functionsactupon an expressiontoreturn informationaboutthe valuesor setsinthe expression.Forexample,youcanuse the IF functiontocheckthe resultof an expressionandcreate conditional results. AND Checkswhetherbothargumentsare TRUE, and returnsTRUE if bothargumentsare TRUE. Otherwise returnsfalse. Syntax:AND(<logical1>,<logical2>) Scenario:Newmeasure=IF(AND(4>3,3<4),"BOTHTRUE","ANYONEFALSE") OR Checkswhetherone of the argumentsisTRUE to return TRUE. The functionreturnsFALSEif both argumentsare FALSE. Syntax OR(<logical1>,<logical2>) Scenario:New measure== IF(OR(1>3,3<4),"ONETRUE","BOTHFALSE") TRUE Returnsthe logical value TRUE. Syntax:TRUE() Scenario:New measure=IF(SUM(FactPayments[Discount_Fee])=1900000, TRUE(),FALSE()) IF Checksif a conditionprovidedasthe firstargumentismet.Returnsone value if the conditionisTRUE, and returnsanothervalue if the conditionisFALSE. Syntax:IF(logical_test>,<value_if_true>,value_if_false) Scenario:New Column=IF(FactPayments[Tax amount]<200,"LOW",IF(FactPayments[Tax amount]<250,"MED","HIGH")) IFERROR Evaluatesanexpressionandreturnsaspecifiedvalue if the expressionreturnsanerror;otherwise returnsthe value of the expressionitself. Syntax:IFERROR(value,value_if_error) Scenario:New Measure=IFERROR(24/0,9999) IN ReturnsTrue if the scalar value showsupinat leastone row of the inputrelation.
  • 32. Syntax:IN Scenario:New Measure=CALCULATE(SUM(FactPayments[Discount_Fee]),DimCourse[CourseID] IN {"MSBI-F","MSBI-N"}) SWITCH (Appliesmultiple conditions) Evaluatesanexpressionagainstalistof valuesandreturnsone of multiplepossibleresultexpressions. Syntax:SWITCH(<expression>,<value>,<result>[,<value>,<result>]…[,<else>]) Scenario:Newcolumn=Increment disc_fee=switch(FactPayments[ModeID],"Online",FactPayments[Discount_Fee] *10/100,"Classroom",FactPayments[Discount_Fee] *20/100,"Customized", FactPayments[Discount_Fee]*30/100) Date and Time Functions CALENDAR Returnsa table witha single columnnamed“Date”thatcontainsa contiguoussetof dates. The range of datesisfrom the specifiedstartdate tothe specifiedenddate,inclusiveof those twodates. Syntax:CALENDAR(<start_date>,<end_date>) Examples The followingformulareturnsatable withdatesbetweenJanuary1st,2020 andDecember31st, 2020. =CALENDAR(DATE (2020, 1, 1), DATE (2020, 12, 31)) DATE Returnsthe specifieddate indatetime format. Syntax: DATE(<year>,<month>,<day>) Example: ReturningaSimple Date Code =DATE (2020,3,28) CALENDAR AUTO Returnsa table witha single columnnamed“Date”thatcontainsa contiguoussetof dates. The range of datesiscalculatedautomaticallybasedondatainthe model. Syntax:CALENDARAUTO() TODAY Returns the current date.
  • 33. Syntax: TODAY() UTCToday Returnsthe currentUTC Syntax:UTCTODAY() UTCNow Returnsthe currentUTC date and time Syntax:UTCNOW() NOW Returnsthe currentdate andtime indatetime format. Syntax:NOW() DAY Returnsthe day of the month,a numberfrom1 to 31. Syntax:DAY(DATE) WEEKDAY Returnsa number2. By defaultthe dayrangesfrom1 (Sunday) to7 (Saturday). Syntax:WEEKDAY(<date>,<return_type>) MONTH Returnsthe monthas a numberfrom1 (January) to12 (December). Syntax:MONTH(<datetime>) YEAR Returnsthe yearof a date as a fourdigitintegerinthe range 1900-9999. Syntax:YEAR(<date>) DATEDIFF Returnsthe count of interval boundariescrossedbetweentwodates. Syntax:DATEDIFF(<start_date>,<end_date>,<interval>) YEARFRAC Calculatesthe fractionof the yearrepresentedbythe numberof whole daysbetweentwodates. Syntax: YEARFRAC(<start_date>,<end_date>,<basis>).
  • 34. EOMONTH Returnsthe date in datetime formatof the lastdayof the month,before oraftera specified numberof months. Syntax : EOMONTH(<start_date>,<months>) WEEKNUM Returnsthe weeknumberforthe givendate andyearaccording to the return_type value.The week numberindicateswherethe weekfallsnumericallywithinayear. Syntax: WEEKNUM(<date>,<return_type>) EDATE Returnsthe date that is the indicatednumberof monthsbeforeorafterthe start date. Syntax:EDATE(<start_date>,<months>) DATEVALUE Convertsa date inthe formof textto a date indatetime format. Syntax:DATEVALUE(date_text) TIMEVALUE Convertsa time intextformatto a time indatetime format. Syntax:TIMEVALUE(time_text) HOUR Returnsthe hour as a numberfrom0 (12:00 A.M.) to 23 (11:00 P.M.) Syntax:HOUR(<datetime>) MINUTE Returnsthe minute asa numberfrom0 to 59, givena date and time value. Syntax:MINUTE(<datetime>) Filter Functions Filteringoperationstomanipulate the datacontext. Context
  • 35. Contextisone of the most importantDAXconceptsto understand.There are twotypesof contextin DAX:row contextandfiltercontext.We’llfirstlookatrow context. Row context Row contextismosteasilythoughtof asthe current row.It applieswheneveraformulahasa function that appliesfilterstoidentify asingle row inatable.The functionwill inherentlyapplya row contextfor each rowof the table overwhichitis filtering.Thistype of row contextmostoften appliestomeasures. Filtercontext Filtercontextisalittle more difficulttounderstandthanrow context.Youcan mosteasilythinkof filter contextas:One or more filtersappliedinacalculationthatdeterminesaresultorvalue. Filtercontextdoesn’texistinplace of row context;rather, itappliesinadditiontorow context.For example,tofurthernarrowdownthe valuestoinclude inacalculation, youcanapplya filtercontext, whichnotonlyspecifiesthe rowcontext,butalsospecifiesaparticularvalue (filter) inthatrow context. Why isfiltercontextsoimportanttoDAX?Because while filtercontextcanmosteasilybe appliedby addingfieldstoavisualization,filtercontextcanalsobe appliedinaDAX formulabydefiningafilter usingfunctionssuchas ALL, RELATED, FILTER, CALCULATE, by relationships,andbyothermeasuresand columns. Forexample,let’slookatthe followingformulainameasure namedStore Sales: Thisformulaincludesthe followingsyntax elements: A. The measure name, Store Sales. B. The equalssignoperator(=),whichindicatesthe beginningof the formula. C. The CALCULATE function,whichevaluatesanexpression, asanargument,ina contextthatis modifiedbythe specifiedfilters. D. Parenthesis (),whichsurroundanexpressioncontainingone ormore arguments.
  • 36. E. A measure [Total Sales] inthe same table as an expression.The Total Salesmeasure hasthe formula: =SUM(Sales[SalesAmount]). F. A comma (,),whichseparatesthe firstexpressionargumentfromthe filterargument. G. The fullyqualifiedreferencedcolumn, Channel[ChannelName].Thisisourrow context.Eachrow in thiscolumnspecifiesachannel,such asStore or Online. H. The particularvalue, Store,asa filter.Thisisourfiltercontext. Thisformulaensuresonlysalesvaluesdefinedbythe Total Salesmeasure are calculatedonlyforrowsin the Channel[ChannelName]column,withthe value Storeusedasa filter. Filter Returnsa table that representsasubsetof anothertable orexpression. Syntax:FILTER(<table>,<filter>) Returns-A table containingonlythe filteredrows.(Returnsatable thathas beenfiltered.) Scenario:GotoNewTable=Filter(Dimcourse,Dimcourse[Coursename]=”Azure FastTrack”) Filters Returnsthe valuesthatare directlyappliedasfilterstocolumnName. i.e.,Returns atable of the filter valuesapplieddirectlytothe specifiedcolumn. Syntax:FILTERS(<columnName>) Scenario:GotoNewTable=Filters(Dimcourse[Coursename]=’”Azure FastTrack”) All Returnsall the rowsin a table,or all the valuesina column,ignoringanyfiltersthatmighthave been applied.Thisfunctionisusefulforclearingfiltersandcreatingcalculationsonall the rowsina table. Syntax:ALL( {<table>| <column>[,<column>[,<column>[,…]]]} ) Scenario: Take an yearslicerandsee the result, whenyearchangesDiscounttotal 1 changes,where as Discount total 2 doesnot change. Take twocards and show the result. Discounttotal 2 = sumx(all(FactPayments),FactPayments[Discount_Fee])
  • 37. Total discountfees =SUMX(FactPayments,FactPayments[Discount_Fee]) All Except Removesall contextfiltersin the table exceptfiltersthathave beenappliedtothe specifiedcolumns. Syntax:ALLEXCEPT(<table>,<column>[,<column>[,…]]) Scenario:Take yearfilter,change year,itdoesnotchange the values.Where asMonthname if you change, it will affect. Discounttotal 2 = calculate(sum(FactPayments[Discount_Fee]),allexcept(DimDate,DimDate[Month]) Calculate Evaluatesanexpressioninacontextthatismodifiedbythe specifiedfilters. Syntax:CALCULATE(<expression>,<filter1>,<filter2>…) Scenario: Discounttotal 2 = calculate(sum(FactPayments[Discount_Fee]),allexcept(DimDate,DimDate[Month]) Calculate Table(we can create table of rows n columns) CALCULATE functionrequiresasitsfirstargumentanexpressionthatreturnsa single value,the CALCULATETABLE functiontakesatable of values.Evaluatesatable expressioninacontextmodifiedby the givenfilters. Syntax:CALCULATETABLE(<expression>,<filter1>,<filter2>,…) Scenario:Display2017 yeardata NewTable:Caltab2017 rows= CALCULATETABLE(FactPayments,DimDate[Year]=2017) Scenario:Total Discountfee in2017 usingcalculate table NewMeasure:Caltab_2017_TDF= sumx(CALCULATETABLE(FactPayments,DimDate[Year]=2017),FactPayments[Discount_Fee]) Count Rows and Distincts Distinctrowswithcountof rows. Syntax:DISTINCT(<table>)<column> COUNTROWS(<column>) Scenario:Countrowsof distinctDiscountfee infacttable.
  • 38. DISTINCTROWCOUNT= COUNTROWS(DISTINCT(FactPayments[Discount_Fee])) Related Returnsa relatedvalue fromanothertable. Syntax:RELATED (<COLUMN>) Scenario:Create newcolumnCoursedetailinFactpaymentsusingRelatedfunctionwhichjoinsfacttable withDimCourse table withnewcolumnretrievingwithvaluesagainsteachcourseid(joiningcolumn) withcourse name details. Goto FactpaymentsNewColumnCoursedetail =RELATED(DimCourse[Coursename]) Process:Each Courseidvalue fromFactpaymentspassedtothe model,joinwithDimcourse table and thenmatchedrow Coursename itgetsfromDimcourse table. Joinconcept:One value passand getone value againsteachmatchedcourseid(1:1)—Joinandreturna single value againsteachmatchedid. RelatedTable Evaluatesa table expressioninacontextmodifiedbythe givenfiltersandreturna table of values. Syntax:Syntax RELATEDTABLE(<tableName>) Scenario:FindoutinCoursetableforeachcourseidtotal discountfee generated. Goto CoursetableTotalDF=SUMX(RELATEDTABLE(FactPayments),FactPayments[Discount_Fee]) Process:Each CourseidfromDimCourse passedtoFactpayments,compare andgettable of rowsand thensumof all the retrievedrowstotal created. Joinconcept:One value passedandmanyvaluesretrieval (1:many)—joinandreturntable data. Values Returnsa one-columntable thatcontainsthe distinctvaluesfromthe specifiedtable orcolumn.Inother words,duplicate valuesare removedandonlyuniquevaluesare returned. Syntax:VALUES(<TableNameOrColumnName>) Scenario:Displayonlycoursenames.Syntax:Course_values=Values(Dimcourse[coursename]) Scenario:Displaycountof coursename. Syntax:gotonewcolumn=Countrows(Values(Dimcourse[coursename])) HasoneValue ReturnsTRUE whenthe contextforcolumnName hasbeenfiltereddowntoone distinctvalue only. Otherwise isFALSE.
  • 39. Syntax:HASONEVALUE(<columnName>) Scenario:If courseIDhas one value,thenitwill show youcount.Otherwise returnsBLANK. Goto New column Hasonevalue=IF(HASONEVALUE(FactPayments[CourseID]),FILTERS(FactPayments[CourseID]),BLANK()) HasoneFilter ReturnsTRUE whenthe numberof directlyfilteredvaluesoncolumnName isone;otherwise returns FALSE. Syntax:HASONEFILTER(<columnName>) Scenario:If courseIDhas one value,thenitwill show youcount.Otherwise returnsBLANK. Goto New column HasoneFilter=IF(HASONEFILTER(FactPayments[CourseID]),FILTERS(FactPayments[CourseID]),BLANK()) IsCrossFiltered ReturnsTRUE whencolumnName oranothercolumninthe same orrelatedtable isbeingfiltered. Syntax:ISCROSSFILTERED(<columnName>) Scenario:GotoNewcolumn Iscrossfilter=ISFILTERED(DimDate[Quarter]) IsFiltered ReturnsTRUE whencolumnName isbeingfiltereddirectly.If there isnofilteronthe columnorif the filteringhappensbecauseadifferentcolumninthe same table orina relatedtable isbeingfiltered then the functionreturnsFALSE. Syntax:ISFILTERED(<columnName>) Scenario:GotoNewcolumn Isfiltered=ISFILTERED(DimDate[Quarter]) Keepfilters Modifieshowfiltersare appliedwhileevaluatingaCALCULATE or CALCULATETABLE function. Syntax:KEEPFILTERS(<expression>) SelectedValue Returnsthe value whenthe contextforcolumnName hasbeenfiltereddowntoone distinctvalue only. Otherwise returnsalternateResult. Syntax:SELECTEDVALUE(<columnName>[,<alternateResult>]) Scenario:GotoNewMeasure= SELECTEDVALUE(DimCourse[Coursename],"XYZ"),use cardforthe measure valuesandcoursename inslicer,if novalue selectedinslicercarddisplaysalternate value XYZ. UseRelationship
  • 40. Specifiesthe relationshiptobe usedina specificcalculationasthe one thatexistsbetween columnName1andcolumnName2. Syntax:USERELATIONSHIP(<columnName1>,<columnName2>) Scenario: DiscountFee_Relationship=CALCULATE(sum(FactPayments[Discount_Fee]), USERELATIONSHIP(FactPayments[Date],DimDate[Date])) No value returned,butthe relationshipisutilized. Math & Statistical Functions The mathematical functionsinDataAnalysisExpressions(DAX) are verysimilartothe Excel mathematical and trigonometric functions. SUM Adds all the numbers in a column. Syntax: SUM(<COLUMN>) Example: The following example adds all the numbers that are contained in the column, Amt, from the table. Sales=SUM(Sales[Amt]) SUMX Returns the sum of an expression evaluated for each row in a table. Syntax: SUMX(<table>, <expression>) The following example first filters the table,Factpayments, on the expression and then returnsthe sum of all values in the column, Discount_Fee. Total discountfees =SUMX(FactPayments,FactPayments[Discount_Fee]) CEILING Roundsa numberup, to the nearestintegerorto the nearestmultipleof significance. Syntax:CEILING(<number>,<significance>) Example The followingformulareturns4.45.This mightbe useful if youwantto avoidusingsmallerunitsinyour pricing.If an existingproductispricedat$4.42, you can use CEILING toround pricesupto the nearest unitof five cents. =CEILING(4.42,0.05) CURRENCY Evaluates the argument and returns the result as currency data type. Syntax: CURRENCY(<value>)
  • 41. Example Convert number 1234.56 to currency data type. =CURRENCY(1234.56) Returns the value $1234.5600. DIVIDE Performs division and returns alternate result or BLANK() on division by 0. Syntax: DIVIDE(<numerator>, <denominator> [,<alternateresult>]) Example: The following example returns 2.5. =DIVIDE(5,2) Example: The following example returns BLANK. =DIVIDE(5,0) Example: The following example returns 1. =DIVIDE(5,0,1) Time Intelligence Functions These functionsworkonrunningdatesof currentand past. Sameperiodlast year Returnsa table that containsa columnof datesshiftedone yearbackintime fromthe datesinthe specifieddatescolumn,in the currentcontext. Syntax : SAMEPERIODLASTYEAR(<dates>) Parallelperiod Returnsa table that containsa columnof datesthat representsaperiodparalleltothe datesinthe specifieddatescolumn,inthe currentcontext,withthe datesshiftedanumber of intervalseither forwardintime or back in time. Syntax:PARALLELPERIOD(<dates>,<number_of_intervals>,<interval>) Previousyear Returnsa table that containsa columnof all datesfromthe previousyear,giventhe lastdate inthe datescolumn,inthe currentcontext. Syntax:PREVIOUSYEAR(<dates>[,<year_end_date>]) Previousquarter Returnsa table that containsa columnof all datesfromthe previousquarter,basedonthe firstdate in the datescolumn,inthe current context. Syntax:PREVIOUSQUARTER(<dates>) Previousmonth Returnsa table that containsa columnof all datesfromthe previousmonth,basedonthe firstdate in the datescolumn,inthe current context.
  • 42. Syntax:PREVIOUSMONTH(<dates>) Previousday Returnsa table that containsa columnof all datesrepresentingthe daythatis previoustothe firstdate inthe datescolumn,inthe currentcontext. Syntax : PREVIOUSDAY(<dates>) Datesbetween Returnsa table that containsa columnof datesthat begins withthe start_date andcontinuesuntil the end_date. Syntax: DATESBETWEEN(<dates>,<start_date>,<end_date>) Datesinperiod Returnsa table that containsa columnof datesthat beginswiththe start_date andcontinuesforthe specifiednumber_of_intervals. Syntax: DATESINPERIOD(<dates>,<start_date>,<number_of_intervals>,<interval>) Start of Month Returnsthe firstdate of the monthin the currentcontextforthe specifiedcolumnof dates. Syntax:STARTOFMONTH(<dates>) Start of Quarter Returnsthe firstdate of the quarterin the currentcontextforthe specifiedcolumnof dates. Syntax:STARTOFQUARTER(<dates>) Start of Year Returnsthe firstdate of the yearin the currentcontextfor the specifiedcolumnof dates. Syntax:STARTOFYEAR(<dates>) End of Month Returnsthe lastdate of the month inthe current contextforthe specifiedcolumnof dates. Syntax :ENDOFMONTH(<dates>) End of Quarter Returnsthe lastdate of the quarter inthe current contextforthe specifiedcolumnof dates Syntax:ENDOFQUARTER(<dates>)
  • 43. End of Year Returnsthe lastdate of the year inthe current contextforthe specifiedcolumnof dates. Syntax:ENDOFYEAR(<dates>[,<year_end_date>]) Dates YTD Returnsa table that containsa Columnof the datesfor the yearto date,inthe currentcontext. Syntax:DATESYTD(<dates>[,<year_end_date>]) Dates QTD Returnsa table that containsa columnof the datesfor the quarterto date,in the currentcontext. Syntax:DATESQTD(<dates>) Dates MTD Returnsa table that containsa columnof the datesfor the monthto date,in the currentcontext. Syntax:DATESMTD(<dates>) Total YTD Evaluatesthe year-to-datevalue of the expressioninthe currentcontext. Syntax:TOTALYTD(<expression>,<dates>[,<filter>][,<year_end_date>]) Total QTD Evaluatesthe value of the expressionforthe datesinthe quarterto date,inthe current context. Syntax:TOTALQTD(<expression>,<dates>[,<filter>]) Total MTD Evaluatesthe value of the expressionforthe monthtodate,inthe currentcontext. Syntax:TOTALMTD(<expression>,<dates>[,<filter>]) Firstdate Returnsthe firstdate in the currentcontextforthe specifiedcolumnof dates. Syntax:FIRSTDATE(<dates>) FirstNonBlank Returnsthe firstvalue inthe column,column,filteredbythe currentcontext,wherethe expressionis not blank. Syntax:FIRSTNONBLANK(<column>,<expression>) Lastdate
  • 44. Returnsthe lastdate inthe current contextforthe specifiedcolumnof dates. Syntax:LASTDATE(<dates>) LastNonblankdate Returnsthe lastvalue inthe column,column,filtered bythe currentcontext,where the expressionis not blank. Syntax:LASTNONBLANK(<column>,<expression>) Nextday Returnsa table that containsa columnof all datesfromthe nextday,basedonthe firstdate specifiedin the datescolumninthe currentcontext Syntax:NEXTDAY(<dates>) Nextmonth Returnsa table that containsa columnof all datesfromthe nextmonth,basedonthe firstdate specifiedinthe datescolumninthe currentcontext Syntax:NEXTMONTH(<dates>) NextQuarter Returnsa table that contains a columnof all datesfromthe nextquarter,basedonthe firstdate specifiedinthe datescolumninthe currentcontext Syntax:NEXTQUARTER(<dates>) Information functions DAXinformationfunctionslookatthe cell or row that is providedasanargument and tellsyouwhether the value matchesthe expectedtype.Forexample,the ISERRORfunctionreturnsTRUEif the value that youreference containsanerror. CONTAINS Returnstrue if valuesforall referredcolumnsexist,orare contained,inthose columns; otherwise,the functionreturnsfalse. Syntax:CONTAINS(<table>,<columnName>,<value>[,<columnName>,<value>]…) Scenario:Returntrue or false,if courseID=”MSBI-F”andModeID=”Online”available infacttable Course_Mode_Exists=CONTAINS(FactPayments,FactPayments[CourseID],"MSBI-F", FactPayments[ModeID],"Online")
  • 45. IN Operator / CONTAINSROW ReturnsTRUE if a row of valuesexistsorcontainedinatable,otherwise returnsFALSE.Exceptsyntax, the IN operatorandCONTAINSROWfunctionare functionallyequivalent. IN OperatorSyntax : <scalarExpr> IN <tableExpr> ( <scalarExpr1>, <scalarExpr2>,… ) IN <tableExpr> ContainsRow syntax: CONTAINSROW(<tableExpr>,<scalarExpr>[,<scalarExpr>,…]) Scenario:GotoNewTable ContainsRow =FILTER(ALL(DimCourseMode[ModeID]),CONTAINSROW({ "Online","Classroom"},[ModeID])) QueryExecution:Bring All modeidsirrespective of flter. Withinthe listfilterfunctionappliescondition{containsrow}. Note:Containsgivessingle valuesonlyastrue/false,againstsinglecolumn. Where as Containsrowgivesmultiple valuesagainstmultiple columnsinarow. IsError Checkswhetheravalue isan error,and returnsTRUE or FALSE. Syntax:ISERROR(<value>) Iserror_val = iserror([Columname]/0) Scenario:If there isan error substistuingwith99999 if(iserror(FactPayments[M1]/0),99999) IsBlank Checkswhetheravalue isblank,andreturnsTRUE or FALSE. Syntax:ISBLANK(<value>) Scenario:GotoNewcolumn=ISBLANK(DimCourse[CourseID]) Checksthe value againstcourseidcolumnandreturnstrue/false. IsEven& IsOdd If valuesisEvenresultas True and if value isOddresultas false. Isblank= ISBLANK(DimCourse[CourseID]) Syntax=ISEVEN(number)
  • 46. Scenario: = ISEVEN(DimCourse[Duration]) returnsresultasTrue,durationvaluesare all even. = ISOdd(DimCourse[Duration])returnsresultasFalse,durationvaluesare all even. IsNumber Checkswhetheravalue isa number,andreturnsTRUE or FALSE. Syntax:ISNUMBER(<value>) IsText Checksif a value istext,andreturnsTRUE OR FALSE Syntax:ISTEXT(<VALUE>) IsLogical Checkswhetheravalue isa logical value,(TRUEor FALSE/Booleanvalues) andreturnsTRUEor FALSE. Syntax:ISLOGICAL(<value>) IsNontext Checksif a value isnot text(blankcellsare nottext),andreturnsTRUE or FALSE. Syntax:ISNONTEXT(<value>) IsonOrafter A boolean functionthatemulatesthe behaviorof a‘Start At’clause and returnstrue for a row that meetsall of the conditionparameters. Thisfunctiontakesa variable numberof triples,the firsttwovaluesinatriple are the expressionstobe compared,andthe thirdparameterindicatesthe sortorder.The sortorder can be ascending(default) or descending. Basedon the sort order,the firstparameteriscomparedwiththe secondparameter. Ifthe sort order is ascending,the comparisonto be done isfirst parameter greater than or equal to second parameter.If the sort orderis descending,the comparisontobe done issecondparameterlessthanorequal to first parameter. Syntax:ISONORAFTER(<scalar_expression>,<scalar_expression>sort_order][,scalar_expression>, <scalar_expression>,[sort_order][,…]) Scenario: ison= ISONORAFTER(DimDate[Date],DimDate[Month],ASC)resultsasTrue ison= ISONORAFTER(DimDate[Date],DimDate[Month],DESC)resultsasFalse LookupValue Returnsthe value inresult_columnName forthe row thatmeetsall criteriaspecifiedby search_columnName andsearch_value.
  • 47. Syntax:LOOKUPVALUE( <result_columnName>,<search_columnName>,<search_value>[, <search_columnName>,<search_value>]…) Scenario:GotoNewMeasure= LOOKUPVALUE(DimCourse[Coursename],DimCourse[CourseID],"msbi-c") UserName Returnsthe domainname andusername fromthe credentialsgiventothe systematconnectiontime Syntax:USERNAME() Scenario:GotoMeasure=Username() Iterative Functions Parent and child functions These Data AnalysisExpressions(DAX) functionshelpusersmanage datathatispresentedasa parent/childhierarchyintheirdatamodels. Withthese functions:  A user can obtain the entire lineage of parents a row has,  How many levels has the lineage to the top parent,  Who is the parent n-levels above the current row,  Who is the n-descendant from the top of the current row hierarchy  And is certain parent a parent in the currsent row hierarchy? Parent-Child functions in DAX The following table contains a Parent-Child hierarchy on the columns: EmployeeKey and ParentEmployeeKey that is used in all the functions examples.
  • 48. In the above table youcansee thatemployee 112 hasno parentdefined,employee14has employee112 as manager(ParentEmployeeKey),employee 3 has employee 14as managerand employees11, 13, and 162 have employee 3 as manager. The above helps to understand that employee 112 has no manager above her/himandshe/he isthe topmanagerforall employees shownhere;also,employee 3reportsto employee 14 and employees 11, 13, 162 report to 3. The followingtable presentsthe availablefunctions,abrief descriptionof the functionandanexampleof the function over the same data shown above. PATH function(DAX) - Returnsa delimitedtextwiththe identifiersof all the parentsto the currentrow, starting with the oldest or top most until current.
  • 49. Remarks Returnsa delimitedtextstringwiththe identifiersof all the parentsof the current identifier,startingwith the oldest and continuing until current. A delimited text string containing the identifiers of all the parents to the current identifier. This function is used in tables that have some kind of internal hierarchy, to return the items that are related to the current row value. For example, in an Employees table that contains employees, the managers of employees, and the managers of the managers, you can return the path that connects an employeetohisorhermanager.The pathisnot constrainedtoasingle levelof parent-childrelationships; it can return related rows that are several levels up from the specified starting row.  The delimiter used to separate the ascendants is the vertical bar, '|'.  The values in ID_columnName and parent_columnName must have the same data type, textor integer.  Valuesinparent_columnName mustbe presentinID_columnName.Thatis, youcannot lookup a parent if there is no value at the child level.  If parent_columnName is BLANK then PATH() returns ID_columnName value. In other words, if you lookfor the manager of an employee butthe parent_columnName columnhasnodata, the PATH function returns just the employee ID.  If ID_columnName hasduplicatesandparent_columnName isthe same forthose duplicatesthen PATH() returnsthe commonparent_columnName value;however,if parent_columnName value is different for those duplicates then PATH() returns an error. In other words, if you have two listingsforthe same employee IDandtheyhave the same managerID,the PATHfunctionreturns the ID for that manager. However, if there are two identical employee IDs that have different manager IDs, the PATH function returns an error.
  • 50.  If ID_columnName is BLANK then PATH() returns BLANK.  If ID_columnName contains a vertical bar '|' then PATH() returns an error. PATHLENGTH function (DAX) - Returns the number of levels in a given PATH(), starting at current level until the oldest or top most parent level. In the following example column PathLength is defined as ‘ =PATHLENGTH([Path]) ’; the example includes all data from the Path() example to help understand how this function works. Remarks This DAX function is not supported for use in DirectQuery mode. PATHITEM function(DAX) - Returnsthe itemat the specifiedpositionfromaPATH() like result,counting from left to right. In the following example column PathItem - 4th from left is defined as ‘ =PATHITEM([Path], 4) ’; this example returns the EmployeKeyat fourth position in the Path string from the left, using the same sample data from the Path() example. Remarks  Thisfunctioncan be usedto returna specificlevel fromahierarchyreturnedbyaPATH function. For example, you could return just the skip-level managers for all employees.  If you specify a number for position that is less than one (1) or greater than the number of elements in path, the PATHITEMfunction returns BLANK  If type is not a valid enumeration element an error is returned.
  • 51. PATHITEMREVERSE function (DAX) - Returns the item at position from a PATH() like function result, countingbackwardsfromrightto left.Inthe followingexamplecolumnPathItemReverse - 3rdfromright is defined as ‘=PATHITEMREVERSE([Path],3) ’; thisexample returns the EmployeKey at third positionin the Path string from the right, using the same sample data from the Path() example. Remarks  This function can be used to get an individual item from a hierarchy resulting from a PATH function.
  • 52.  This function reverses the standard order of the hierarchy, so that closest items are listed first, For example,if the PATh function returns a list of managers above an employee in a hierarchy, the PATHITEMREVERSE function returns the employee’s immediate manager in position 2 because position 1 contains the employee’s id.  If the number specified for position islessthan one (1) or greater than the number of elements in path, the PATHITEMfunction returns BLANK.  If type is not a valid enumeration element an error is returned. PATHCONTAINS function (DAX) - Returns TRUE if the specified item exists within the specified path. In the followingexamplecolumnPathContains - employee162isdefinedas‘=PATHCONTAINS([Path],"162") ’; thisexample returnsTRUEif the givenpathcontainsemployee162. Thisexample usesthe resultsfrom the Path() example above. Remarks If itemis an integernumberit is convertedto textand then the functionis evaluated.If conversionfails then the function returns an error. Rank Functions and Variable Other functions Providesamechanismfordeclaringaninline setof datavalues.(SimilartoCreate Table- Helpstocreate a dynamictable withrows. Syntax:DATATABLE(ColumnName1,DataType1,ColumnName2,DataType2...,{{Value1,Value2...}, {ValueN,ValueN+1...}...})
  • 53. Scenario:NEWTABLE=STUDENT TABLE=DataTable("IDNO",STRING,"NAME",STRING,{ {"STU1","AKASH"},{"STU2","VISHU"},{"STU3","RAGHU"}, {"STU4","KIRAN"},{" STU5","KRISH"} } ) EXCEPT Returnsthe rowsof one table whichdonot appearin anothertable.Syntax EXCEPT(<table_expression1>,<table_expression2>) Scenario: NEW TABLE ST1 = DataTable("IDNO",STRING,"NAME",STRING,{ {"STU1","AKASH"},{" STU2","VISHU"}}) NEW TABLE ST2 = DataTable("IDNO",STRING,"NAME",STRING,{ {"STU1","AKASH"},{"STU3","KIRAN"}} ) NOW:EXSTU1STU2 = EXCEPT('NEWTABLE ST1','NEW TABLE ST2') UNION Createsa union(join) table fromapairof tables. Syntax:UNION(<table_expression1>,<table_expression2>[,<table_expression>]…) Scenario:USTU1_STU2= UNION('NEWTABLE ST1','NEW TABLE ST2') INTERSECT Returnsthe row intersectionof twotables,retainingduplicates. Syntax : INTERSECT(<table_expression1>,<table_expression2>) Scenario:INTSTU1_STU2= INTERSECT('NEWTABLE ST1','NEW TABLE ST2') GENERATESERIES Returnsa single columntable containingthe valuesof anarithmeticseries,thatis,asequence of values inwhicheach differsfromthe precedingbya constantquantity.The name of the columnreturnedis Value. Syntax:GENERATESERIES(<startValue>,<endValue>[,<incrementValue>]) Scenario:New Table=GENERATESERIES(1,10,2) Returnsa table witha single column,startingwith1andincrementby2. GROUPBY The GROUPBY functionissimilartothe SUMMARIZE function.However,GROUPBYdoesnotdo an implicitCALCULATEforany extensioncolumnsthatitadds.GROUPBY permitsanew function, CURRENTGROUP(),to be usedinside aggregationfunctionsinthe extensioncolumnsthatitadds. GROUPBY attemptsto reuse the data that hasbeengroupedmakingithighlyperformant. Syntax:GROUPBY (<table>,[<groupBy_columnName1>],[<name>,<expression>]…)
  • 54. Scenario:Inst_Mode_Total = GROUPBY(FactPayments,FactPayments[InstituteID],FactPayments[ModeID],"Total Fee",SUMx(currentgroup(),FactPayments[Discount_Fee])) SUMMARIZECOLUMNS Strict comparisonsemanticsare usedduringjoin.There isnotype coercion;forexample,1doesnot equal 1.0. Returnsa summarytable overa set of groups. Syntax:SUMMARIZECOLUMNS( <groupBy_columnName>[,< groupBy_columnName>]…, [<filterTable>]…[,<name>,<expression>]…) Scenario:Inst_Mode_Total = SUMMARIZECOLUMNS(FactPayments[InstituteID],FactPayments[ModeID],FactPayments,"Total",SUM(F actPayments[Discount_Fee])) TREATAS Appliesthe resultof a table expressionasfilterstocolumnsfromanunrelatedtable. Syntax:TREATAS(table_expression,<column>[,<column>[,<column>[,…]]]} ) Scenario:Findingthe total fromDimcourse andDimcourse_new basedonselectionfromDimcourse query. 1.create anothertable Dimcourse_newwithsimilarfew courseidvalues. 2. create connectionwithfacttable. 3. Take sliceranduse courseid 4. create measure like belowanduse incard. NewMeasure=Diff_Tablesum=calculate(sum(FactPayments[Discount_Fee]), treatas(values(DimCourse[CourseID]),DimCourse_New[CourseID])) There are 2 types of calculations in DAX.  Calculated Measures  Calculated column
  • 55. Calculated column Calculated Measures Calculated column are created during the data load (That means during refresh of the data). It is stored as part of the data table. Calculated column is always a row level. It calculates row by row. New measure is created is on the fly that means it is not stored as part of the data model, but it is created based on the context of visualization. Calculated columns are faster because the values are be stored Slower Do not prefer Calculated column for Ratio(coloumn1/coloumn2) activities. For Ratio, you need to create a calculated measure When you are creating make sure that click on the particular table which going to you are creating calculated column. When creating Calculated measures, no need to click on a table why because we can drag measure to a required table. implicit Measure Q) Why Explicit measures are better than Implicit measures There are 3 reasons  Control  Re-Use  Connected Reports Calculated Columns A calculated column is a new column that you can created by defining of a calculation that transforms or combines two or more elements of existing Data. Creating a calculate column is a simple way to enrich and enhance your data. For example, you can create a new column by combing two columns into one. One useful reason for creating calculated column is to a establish a relationship between two tables, when no unique field exist that can be used to establish a relationship. To create a measure in a report view Modeling TabNew Column
  • 56. Calculated Measure Is a calculation that exists in your Power BI data model. To create a measure in a report view Modeling TabNew Measure Drill Through Entering Data Here we can manually create a table also we can copy the data from excel to here. Calendar Table I can say that if there is a Date field in table, you better have to create a calendar table. If a sales table start date 2014 and end date is 2016, the calendar table range must cover 2014 to 2017.then only we can cover all the data. There are two benefits of creating a calendar table. 1)Time Saving—We can perform Date functions easily. 2)Look up table-We can take Date/Month as keys in this lookup table. There are many ways to create a calendar table.
  • 57.  1)Excel  2)SQL  3)Azure  4)DAX (Calendar Auto) But my favorite method is Using Power Bi Query Editor by using DAX function. Power BI Desktop>Modeling tab>New Table>Enterbelow DAX function D_Calendar = ADDCOLUMNS ( CALENDAR (DATE(2000,1,1), DATE(2049,12,31)), "Date_Int", FORMAT ( [Date], "YYYYMMDD" ), "Year", YEAR ( [Date] ), "Month", FORMAT ( [Date], "MM" ), "Year_Month", FORMAT ( [Date], "YYYY-MM" ), "Year_Month_Name", FORMAT ( [Date], "YYYY- mmm" ), "Month_Name", FORMAT ( [Date], "mmm" ), "Week", WEEKDAY ( [Date] ), "Week_Day", FORMAT ( [Date], "dddd" ), "Qtr", "Q" & FORMAT ( [Date], "Q" ), "Year_Qtr", FORMAT ( [Date], "YYYY" ) & "-Q" & FORMAT ( [Date], "Q" )) Creating and Managing Hierarchies To help your users navigate through your data, you can create hierarchies to help them understand the different levels in your data and how can they move up and down between them. Time Intelligence Do exercise for Date field by using Drill Up and Drill down options Manually typing Data in Data table Yes, we can able to add data manually for table that table we created in query editor by using Enter Data option in query editor. Include and Exclude Difference between Copy, Duplicate, Reference in Query Editor When to use: Copy Duplicate Reference After creating a Duplicate table, it will be shown all applied steps from source table. After creating a Reference table, it will not be shown all applied steps from source table. If we change anything in source table those changes never reflected in Duplicate table If we change anything in source table those changes also reflected in Reference table
  • 58. If we change anything in Duplicate table, it will not affect Source table If we change anything in Reference table, it will not affect Source table Diff b/w Added column (Conditional Column) and Calculated column Addcolumn- (Conditional column) Calculatedcolumn Conditional columnyoucanfindinQuery Editor. CalculatedColumnyoucanfindinPowerBi Desktop Hear Conditionsare used. DAXexpressionsare usedhear. Buttons, Selection, Bookmarks and Toggle Button. Buttons  There islistof buttonsavailableinPowerBIdesktop.  If you wantto create a ButtonwithSome text go to lastoption BLANK.Afterclickingthatbutton an emptybuttonwill be appearinyourDesktop.Youcan give textto that Buttonbyusing buttonproperties.
  • 59. Bookmarks and Selection For creatingBookmarksandSelectionyoujustnavigate toView tab. There youfindlistof optionsseen inbelow. Row Level Security Row-Level security allows you to secure your data at the row level with security filters based on roles you create. Using the Manage roles button in the Modeling Tab, you an create roles then use DAX expressions to control what each role sees. Then, once you publish it up to the web, you can assign users to each role. Power BI Visualizations Stacked bar chart Stacked ColumnChart
  • 60. Line Chart Area Chart Pie Chart Donut Chart
  • 61. Tree Map Map Card Gauge Multi Card KPI Table Matrix
  • 62. KPI Traffice Light Visulizations Display Tool Tip Visual Templates and Themes Ask a Question Functionality Whichis veryinteresting functionalitywhichhasgivenbyinPowerBi. If you ask anyquestionof topof anyvisual itwill create new visual(The visual isbasedonarequested question) Understanding the Mash Up language behind GUI Options.
  • 63. Publish a Report to the Web (Power BI cloud Service) 1. There are 2 ways to Publishareport,butbothare do same operations. Menu,SelectFile>PublishtoWeb  Use GUI option 2. Clickon Publish  Afterclickeditwill openthe dialogbox toEnter Credentials.
  • 64. (If youalreadyloginwithcredentialswhile workingonReportmeansit will notaskagain)  Give Office orany type of organizational accounts.Like @hcl.com. (@gmail,@outllok,@yahoowill notworkhere) AndIt will askyouto Selecta destination.(Listof workspaceswill be appeared). Afterselecteddestination,youreportwill be published.
  • 65. Afterpublishedyoucansee yourreportin https://app.powerbi.com/home Go to workspace where you published. I published in My Workspace so am clicking on My workspace, after you clicked you can be able to see your report.
  • 66. We can also Edit the Report  A dialogthatexplainsyouwillgetanembedcode thatletsyoushare the reporton a website or inmail  Whenyouselectcreate embedcode,PowerBIpresentsanotherdialog,tellingyouagainthat youare about to share yourdata witheveryone onthe internet.Make sure thatis okay! Dashboard We can a pic multiple visual fromdifferentreportstoa Dashboard. How to create a Dashboard Clickon highliatedpart to create a new dashboard.
  • 67. After clicked,Give the Name Am givingname as Sample Now you can add reports to this dashboard. First go to a report and pin a visual which you want to add to a dashboard.
  • 68. Clickon that pin symbol,it will opena windowthere you can map to existingdashoard or new one. here also you have a chance to create a new dashboard. Similarly,am adding two more visualsto tisdashboard. After adding3 visualsinto a SAMPLE dashboard. Now check belowscreen. (Ifyou click on any visual it will navigate to that actual report)
  • 69. We can performbelowhighliatedthingsin a dashboard for a any visual. Dataset Power bi gateway The systemthat lets you connect your on-premises data sources to the power BI service is called the Data Gateway It is small application that runs on your computer and uses a pre-arranged schedule to connect to your data, gather any updates, and push them up to the Power BI service.
  • 70. Gateways are categorized into 2 types.  Personal Gateway  Enterprise Gateway The Personal Gateway is a version of the Data Gateway that can be used without any administrator Configuration. Note: personal mode gateways will not appear there, only Enterprise mode gateways will be appeared. So, if you use enterprise gateway you will see it under Manage Gateways. Free license allows us to schedule 8 times per a day. Paid license which is more. Key Points  We are using that Sales(5000KB) excel file and developed a report and saved in local machine with name Sales. pbix. If you compare size of .pbix file is lesser than the original excels. pbix file size may be 2000KB. .pbix size is always lesser than the size of original source
  • 71.  If values are like 20.00,25.00,26.00 but you want like 20,25,26 so in this case change data type of column to Text. So automatically values will come like without .00  If you Want to hide a table in a Report view, you go to modeling part and do right click(…) on the table and click on Hide in Report View. Few Concepts in Power Bi 1) Ribbons in Power Bi What is meant by Ribbon-Graphical control element is a graphical control element in the form of a set of toolbars placed on several tabs. ... The usage of the term "ribbon" Below example is a Ribbon of power Bi desktop in a Report View. 2) Advance Editor and Query Dependence in Query Editor. 3) Filters in Power Query and their Purpose in Query Editor 4) Types of Filters in Power Query (Basic Filtering, Advanced Filtering) in Query Editor 5) Auto Filter / Basic Filtering in Query Editor and Filter Multiple Columns 6) Group Rows / Group by in built Row Transformations in Query Editor 7) Manage Parameters (Manage Parameters, Edit Parameters, New Parameter) in Query Editor 8) Suggested Values (Any Value, List of Values, Query), Convert to List 9) Query Parameters and Power BI Templates 10) .pbix(Power BI File) and .pbit(Power BI Template File) 11) Refresh Preview, Refresh All, Cancel Refresh 12) Sorting Data Questions and Answers 1) Difference between Dashboard and Report? 2) What is DAX Studio? 3) Explain about Power Bi service and Power Bi Report server? 4) Difference between Fact, Dimension, Attribute in PowerBI? 5) Difference between Measure and Calculated Column? 6) Difference between Copy, Duplicate and Reference? 7) What Is meant by Calculated table in Power BI, and how many ways to create calculate table? 8) Scheduling in Power BI? 9) Do you work on ALLEXCEPT function-DAX? 10) How to do filter to show the records by year wise or quarter wise or monthly wise?
  • 72. 11) What is Power Bi? Power Bi is a self-serviced cloud-based Business Intelligence software. 12) Why can’t we directly create report on OLTP systems? Why it was not recommended? 13) Current version of Power Bi desktop? 2.83 64 bit released in July 2020 Project Info:  Project Name?  Which sources are using in your project?  How you are using Gateways?  SSAS ETL tool is using or not in your project?  How will you share the Reports to Clients and With In your organization?  Which cloud service is using in project?  How to give access to your dashboard for a set of people?  Scheduling intervals?  How you are getting tasks-means how they are allocating work?  How will you send the reports to testing team?