SlideShare a Scribd company logo
1 of 14
Download to read offline
NCSS Statistical Software NCSS.com
155-1
© NCSS, LLC. All Rights Reserved.
Chapter 155
Error-Bar Charts
Introduction
Error-Bar Charts graphically display tables of means (or medians) and variability. Following are examples of the
types of charts produced by this procedure. The error bars may represent the standard deviation (SD) of the data,
the standard error of the mean (SE), a confidence interval, the data range, or percentiles.
NCSS Statistical Software NCSS.com
Error-Bar Charts
155-2
© NCSS, LLC. All Rights Reserved.
Data Structure
An error-bar chart is constructed from a numeric variable. A second variable may be used to divide the first
variable into groups (e.g., age group or gender). In the two-factor procedure, a third variable may be used to
divide the groups into subgroups.
Error-Bar Chart Window Options
This section describes the specific options available on the Error-Bar Chart window, which is displayed when the
Error-Bar Chart button is clicked. Common options, such as axes, labels, legends, and titles are documented in the
Graphics Components chapter.
Error-Bar Chart Tab
Estimation of Center Section
You can choose whether to plot means or medians.
Bars and Symbols Section
You can modify the color of bars, border, and/or symbols using the options in this section.
One Factor
NCSS Statistical Software NCSS.com
Error-Bar Charts
155-3
© NCSS, LLC. All Rights Reserved.
Two Factors
Variation (Error Bars) Section
You modify the variation line that extends from the mean using the options in this section.
NCSS Statistical Software NCSS.com
Error-Bar Charts
155-4
© NCSS, LLC. All Rights Reserved.
Layout Tab
Orientation Section
You can orient the bars horizontally or vertically.
Object Spacing and Size Section
You can change the size of the gap between individual bars.
Connecting Lines Tab
Connect Between Groups Section
You can add reference lines at group means and percentiles.
NCSS Statistical Software NCSS.com
Error-Bar Charts
155-5
© NCSS, LLC. All Rights Reserved.
Titles, Legend, Numeric Axis, Group Axis, Grid Lines, and Background
Tabs
Details on setting the options in these tabs are given in the Graphics Components chapter.
Example 1 – Creating an Error-Bar Chart
This section presents an example of how to generate an error-bar chart. The data used are from the Fisher dataset.
We will create error-bar charts of the SepalLength variable, grouping on the type of iris.
Setup
To run this example, complete the following steps:
1 Open the Fisher example dataset
• From the File menu of the NCSS Data window, select Open Example Data.
• Select Fisher and click OK.
2 Specify the Error-Bar Charts procedure options
• Find and open the Error-Bar Charts procedure using the menus or the Procedure Navigator.
• The settings for this example are listed below and are stored in the Example 1 settings template. To load
this template, click Open Example Template in the Help Center or File menu.
Option Value
Variables Tab
Data Variable(s)...................................... SepalLength
Horizontal (Group) Variable.................... Iris
Report Options (in the Toolbar)
Variable Labels....................................... Column Names
Data Labels............................................. Value Labels
3 Run the procedure
• Click the Run button to perform the calculations and generate the output.
NCSS Statistical Software NCSS.com
Error-Bar Charts
155-6
© NCSS, LLC. All Rights Reserved.
Error-Bar Chart Output
Error-Bar Charts ────────────────────────────────────────────────────────────
The second plot is the same data with the bar fill and bar border removed and symbols and connecting lines added
(see Example 1b settings template).
NCSS Statistical Software NCSS.com
Error-Bar Charts
155-7
© NCSS, LLC. All Rights Reserved.
Example 2 – Creating an Error-Bar Chart with Subgroups
This section presents an example of how to generate an error-bar chart with subgroups. The data used are from the
fictitious Tree dataset. We will create error-bar charts of the Diameter variable, grouping on Species, with
subgroups according to Sunlight.
Setup
To run this example, complete the following steps:
1 Open the Tree example dataset
• From the File menu of the NCSS Data window, select Open Example Data.
• Select Tree and click OK.
2 Specify the Error-Bar Charts (2 Factors) procedure options
• Find and open the Error-Bar Charts (2 Factors) procedure using the menus or the Procedure Navigator.
• The settings for this example are listed below and are stored in the Example 2 settings template. To load
this template, click Open Example Template in the Help Center or File menu.
Option Value
Variables Tab
Data Variable(s)...................................... Diameter
Horizontal (Group) Variable.................... Species
Legend (Subgroup) Variable .................. Sunlight
Report Options (in the Toolbar)
Data Labels............................................. Value Labels
3 Run the procedure
• Click the Run button to perform the calculations and generate the output.
NCSS Statistical Software NCSS.com
Error-Bar Charts
155-8
© NCSS, LLC. All Rights Reserved.
Error-Bar Chart Output
Error-Bar Charts ────────────────────────────────────────────────────────────
The second plot is the same data with the bar fill and bar border removed and symbols and connecting lines added
(see Example 2b settings template).
NCSS Statistical Software NCSS.com
Error-Bar Charts
155-9
© NCSS, LLC. All Rights Reserved.
You can also make the error-bar lines be the same color as the symbol color and include connecting lines between
groups as in the following plot (see Example 2c settings template).
Error-Bar Charts ────────────────────────────────────────────────────────────
NCSS Statistical Software NCSS.com
Error-Bar Charts
155-10
© NCSS, LLC. All Rights Reserved.
Example 3 – Creating an Error-Bar Chart with 95% Confidence
Interval Limits and Raw Data
This section presents an example of how to generate an error-bar chart with 95% confidence interval limits. The
data used are from the Fisher dataset. We will create error-bar charts of the SepalLength variable, grouping on the
type of iris.
Setup
To run this example, complete the following steps:
1 Open the Fisher example dataset
• From the File menu of the NCSS Data window, select Open Example Data.
• Select Fisher and click OK.
2 Specify the Error-Bar Charts procedure options
• Find and open the Error-Bar Charts procedure using the menus or the Procedure Navigator.
• The settings for this example are listed below and are stored in the Example 3 settings template. To load
this template, click Open Example Template in the Help Center or File menu.
Option Value
Variables Tab
Data Variable(s)...................................... SepalLength
Horizontal (Group) Variable.................... Iris
Error-Bar Chart Format (Click the Button)
Bar Fill ................................................. Unchecked
Bar Border ........................................... Unchecked
Symbol................................................. Checked
Raw Data............................................. Checked
Error-Bar Variation Line Type.............. Confidence Interval
Report Options (in the Toolbar)
Variable Labels....................................... Column Names
Data Labels............................................. Value Labels
3 Run the procedure
• Click the Run button to perform the calculations and generate the output.
NCSS Statistical Software NCSS.com
Error-Bar Charts
155-11
© NCSS, LLC. All Rights Reserved.
Error-Bar Chart Output
Error-Bar Charts ────────────────────────────────────────────────────────────
NCSS Statistical Software NCSS.com
Error-Bar Charts
155-12
© NCSS, LLC. All Rights Reserved.
Example 4 – Creating an Error-Bar Chart with Medians
This section presents an example of how to generate an error-bar chart with medians instead of means. The data
used are from the Fisher dataset. We will create error-bar charts of the SepalLength variable, grouping on the type
of iris.
Setup
To run this example, complete the following steps:
1 Open the Fisher example dataset
• From the File menu of the NCSS Data window, select Open Example Data.
• Select Fisher and click OK.
2 Specify the Error-Bar Charts procedure options
• Find and open the Error-Bar Charts procedure using the menus or the Procedure Navigator.
• The settings for this example are listed below and are stored in the Example 4 settings template. To load
this template, click Open Example Template in the Help Center or File menu.
Option Value
Variables Tab
Data Variable(s)...................................... SepalLength
Horizontal (Group) Variable.................... Iris
Error-Bar Chart Format (Click the Button)
Error-Bar Chart Tab
Bar Fill ................................................. Unchecked
Bar Border ........................................... Unchecked
Symbol................................................. Checked
Raw Data............................................. Unchecked
Connecting Lines Tab
Medians............................................... Checked
Painting Order Tab
Move Connecting Lines before Error-Bar Chart
Report Options (in the Toolbar)
Variable Labels....................................... Column Names
Data Labels............................................. Value Labels
3 Run the procedure
• Click the Run button to perform the calculations and generate the output.
NCSS Statistical Software NCSS.com
Error-Bar Charts
155-13
© NCSS, LLC. All Rights Reserved.
Error-Bar Chart Output
Error-Bar Charts ────────────────────────────────────────────────────────────
When medians are plotted, the error-bars are not necessarily symmetric about the median. In this example, the 25th
and 75th
percentiles are represented by the lower and upper error bars, respectively.
The other option when plotting medians is to draw error bars that cover the entire range of the data as displayed in
the following plot (see Example 4b settings template).
NCSS Statistical Software NCSS.com
Error-Bar Charts
155-14
© NCSS, LLC. All Rights Reserved.
Error-Bar Charts ────────────────────────────────────────────────────────────

More Related Content

Similar to Error-Bar_Charts.pdf

Topic 4 intro spss_stata 30032012 sy_srini
Topic 4 intro spss_stata 30032012 sy_sriniTopic 4 intro spss_stata 30032012 sy_srini
Topic 4 intro spss_stata 30032012 sy_sriniSM Lalon
 
High score plus guide (3)
High score plus guide (3)High score plus guide (3)
High score plus guide (3)SUTAPA DEB
 
Spss tutorial 1
Spss tutorial 1Spss tutorial 1
Spss tutorial 1debataraja
 
Machine Learning with WEKA
Machine Learning with WEKAMachine Learning with WEKA
Machine Learning with WEKAbutest
 
Collect 50 or more paired quantitative data items. You may use a met.pdf
Collect 50 or more paired quantitative data items. You may use a met.pdfCollect 50 or more paired quantitative data items. You may use a met.pdf
Collect 50 or more paired quantitative data items. You may use a met.pdfivylinvaydak64229
 
Management of database information system
Management of database information systemManagement of database information system
Management of database information systemKAZEMBETVOnline
 
Lesson 18 Creating Pivot Tables
Lesson 18 Creating Pivot TablesLesson 18 Creating Pivot Tables
Lesson 18 Creating Pivot Tablesguevarra_2000
 
Creating a histogram
Creating a histogramCreating a histogram
Creating a histogramKyle Greaves
 
Unit 42 Assignment 2
Unit 42 Assignment 2Unit 42 Assignment 2
Unit 42 Assignment 2Alex Dennis
 
InfoSphere_Information_Analyzer
InfoSphere_Information_AnalyzerInfoSphere_Information_Analyzer
InfoSphere_Information_AnalyzerSourav Maity
 

Similar to Error-Bar_Charts.pdf (20)

Dips.pdf
Dips.pdfDips.pdf
Dips.pdf
 
Topic 4 intro spss_stata 30032012 sy_srini
Topic 4 intro spss_stata 30032012 sy_sriniTopic 4 intro spss_stata 30032012 sy_srini
Topic 4 intro spss_stata 30032012 sy_srini
 
High score plus guide (3)
High score plus guide (3)High score plus guide (3)
High score plus guide (3)
 
Spss tutorial 1
Spss tutorial 1Spss tutorial 1
Spss tutorial 1
 
Spss tutorial 1
Spss tutorial 1Spss tutorial 1
Spss tutorial 1
 
SPSS GUIDE
SPSS GUIDESPSS GUIDE
SPSS GUIDE
 
Machine Learning with WEKA
Machine Learning with WEKAMachine Learning with WEKA
Machine Learning with WEKA
 
Ev72
Ev72Ev72
Ev72
 
Collect 50 or more paired quantitative data items. You may use a met.pdf
Collect 50 or more paired quantitative data items. You may use a met.pdfCollect 50 or more paired quantitative data items. You may use a met.pdf
Collect 50 or more paired quantitative data items. You may use a met.pdf
 
Management of database information system
Management of database information systemManagement of database information system
Management of database information system
 
DMAP Tutorial
DMAP TutorialDMAP Tutorial
DMAP Tutorial
 
Lesson 18 Creating Pivot Tables
Lesson 18 Creating Pivot TablesLesson 18 Creating Pivot Tables
Lesson 18 Creating Pivot Tables
 
V sphere perf_charts
V sphere perf_chartsV sphere perf_charts
V sphere perf_charts
 
Creating a histogram
Creating a histogramCreating a histogram
Creating a histogram
 
Creating a histogram
Creating a histogramCreating a histogram
Creating a histogram
 
Unit 42 Assignment 2
Unit 42 Assignment 2Unit 42 Assignment 2
Unit 42 Assignment 2
 
InfoSphere_Information_Analyzer
InfoSphere_Information_AnalyzerInfoSphere_Information_Analyzer
InfoSphere_Information_Analyzer
 
Libre Office Calc Lesson 5: Working with Data
Libre Office Calc Lesson 5: Working with DataLibre Office Calc Lesson 5: Working with Data
Libre Office Calc Lesson 5: Working with Data
 
Tqm old tools
Tqm old toolsTqm old tools
Tqm old tools
 
Tqm old tools
Tqm old toolsTqm old tools
Tqm old tools
 

Recently uploaded

Recombination DNA Technology (Nucleic Acid Hybridization )
Recombination DNA Technology (Nucleic Acid Hybridization )Recombination DNA Technology (Nucleic Acid Hybridization )
Recombination DNA Technology (Nucleic Acid Hybridization )aarthirajkumar25
 
Boyles law module in the grade 10 science
Boyles law module in the grade 10 scienceBoyles law module in the grade 10 science
Boyles law module in the grade 10 sciencefloriejanemacaya1
 
Natural Polymer Based Nanomaterials
Natural Polymer Based NanomaterialsNatural Polymer Based Nanomaterials
Natural Polymer Based NanomaterialsAArockiyaNisha
 
Labelling Requirements and Label Claims for Dietary Supplements and Recommend...
Labelling Requirements and Label Claims for Dietary Supplements and Recommend...Labelling Requirements and Label Claims for Dietary Supplements and Recommend...
Labelling Requirements and Label Claims for Dietary Supplements and Recommend...Lokesh Kothari
 
Animal Communication- Auditory and Visual.pptx
Animal Communication- Auditory and Visual.pptxAnimal Communication- Auditory and Visual.pptx
Animal Communication- Auditory and Visual.pptxUmerFayaz5
 
Bentham & Hooker's Classification. along with the merits and demerits of the ...
Bentham & Hooker's Classification. along with the merits and demerits of the ...Bentham & Hooker's Classification. along with the merits and demerits of the ...
Bentham & Hooker's Classification. along with the merits and demerits of the ...Nistarini College, Purulia (W.B) India
 
Traditional Agroforestry System in India- Shifting Cultivation, Taungya, Home...
Traditional Agroforestry System in India- Shifting Cultivation, Taungya, Home...Traditional Agroforestry System in India- Shifting Cultivation, Taungya, Home...
Traditional Agroforestry System in India- Shifting Cultivation, Taungya, Home...jana861314
 
Nanoparticles synthesis and characterization​ ​
Nanoparticles synthesis and characterization​  ​Nanoparticles synthesis and characterization​  ​
Nanoparticles synthesis and characterization​ ​kaibalyasahoo82800
 
PossibleEoarcheanRecordsoftheGeomagneticFieldPreservedintheIsuaSupracrustalBe...
PossibleEoarcheanRecordsoftheGeomagneticFieldPreservedintheIsuaSupracrustalBe...PossibleEoarcheanRecordsoftheGeomagneticFieldPreservedintheIsuaSupracrustalBe...
PossibleEoarcheanRecordsoftheGeomagneticFieldPreservedintheIsuaSupracrustalBe...Sérgio Sacani
 
Luciferase in rDNA technology (biotechnology).pptx
Luciferase in rDNA technology (biotechnology).pptxLuciferase in rDNA technology (biotechnology).pptx
Luciferase in rDNA technology (biotechnology).pptxAleenaTreesaSaji
 
Isotopic evidence of long-lived volcanism on Io
Isotopic evidence of long-lived volcanism on IoIsotopic evidence of long-lived volcanism on Io
Isotopic evidence of long-lived volcanism on IoSérgio Sacani
 
Lucknow 💋 Russian Call Girls Lucknow Finest Escorts Service 8923113531 Availa...
Lucknow 💋 Russian Call Girls Lucknow Finest Escorts Service 8923113531 Availa...Lucknow 💋 Russian Call Girls Lucknow Finest Escorts Service 8923113531 Availa...
Lucknow 💋 Russian Call Girls Lucknow Finest Escorts Service 8923113531 Availa...anilsa9823
 
Discovery of an Accretion Streamer and a Slow Wide-angle Outflow around FUOri...
Discovery of an Accretion Streamer and a Slow Wide-angle Outflow around FUOri...Discovery of an Accretion Streamer and a Slow Wide-angle Outflow around FUOri...
Discovery of an Accretion Streamer and a Slow Wide-angle Outflow around FUOri...Sérgio Sacani
 
Unlocking the Potential: Deep dive into ocean of Ceramic Magnets.pptx
Unlocking  the Potential: Deep dive into ocean of Ceramic Magnets.pptxUnlocking  the Potential: Deep dive into ocean of Ceramic Magnets.pptx
Unlocking the Potential: Deep dive into ocean of Ceramic Magnets.pptxanandsmhk
 
A relative description on Sonoporation.pdf
A relative description on Sonoporation.pdfA relative description on Sonoporation.pdf
A relative description on Sonoporation.pdfnehabiju2046
 
STERILITY TESTING OF PHARMACEUTICALS ppt by DR.C.P.PRINCE
STERILITY TESTING OF PHARMACEUTICALS ppt by DR.C.P.PRINCESTERILITY TESTING OF PHARMACEUTICALS ppt by DR.C.P.PRINCE
STERILITY TESTING OF PHARMACEUTICALS ppt by DR.C.P.PRINCEPRINCE C P
 
Grafana in space: Monitoring Japan's SLIM moon lander in real time
Grafana in space: Monitoring Japan's SLIM moon lander  in real timeGrafana in space: Monitoring Japan's SLIM moon lander  in real time
Grafana in space: Monitoring Japan's SLIM moon lander in real timeSatoshi NAKAHIRA
 
Hubble Asteroid Hunter III. Physical properties of newly found asteroids
Hubble Asteroid Hunter III. Physical properties of newly found asteroidsHubble Asteroid Hunter III. Physical properties of newly found asteroids
Hubble Asteroid Hunter III. Physical properties of newly found asteroidsSérgio Sacani
 
Biological Classification BioHack (3).pdf
Biological Classification BioHack (3).pdfBiological Classification BioHack (3).pdf
Biological Classification BioHack (3).pdfmuntazimhurra
 

Recently uploaded (20)

Recombination DNA Technology (Nucleic Acid Hybridization )
Recombination DNA Technology (Nucleic Acid Hybridization )Recombination DNA Technology (Nucleic Acid Hybridization )
Recombination DNA Technology (Nucleic Acid Hybridization )
 
Boyles law module in the grade 10 science
Boyles law module in the grade 10 scienceBoyles law module in the grade 10 science
Boyles law module in the grade 10 science
 
Natural Polymer Based Nanomaterials
Natural Polymer Based NanomaterialsNatural Polymer Based Nanomaterials
Natural Polymer Based Nanomaterials
 
Labelling Requirements and Label Claims for Dietary Supplements and Recommend...
Labelling Requirements and Label Claims for Dietary Supplements and Recommend...Labelling Requirements and Label Claims for Dietary Supplements and Recommend...
Labelling Requirements and Label Claims for Dietary Supplements and Recommend...
 
Animal Communication- Auditory and Visual.pptx
Animal Communication- Auditory and Visual.pptxAnimal Communication- Auditory and Visual.pptx
Animal Communication- Auditory and Visual.pptx
 
Bentham & Hooker's Classification. along with the merits and demerits of the ...
Bentham & Hooker's Classification. along with the merits and demerits of the ...Bentham & Hooker's Classification. along with the merits and demerits of the ...
Bentham & Hooker's Classification. along with the merits and demerits of the ...
 
Traditional Agroforestry System in India- Shifting Cultivation, Taungya, Home...
Traditional Agroforestry System in India- Shifting Cultivation, Taungya, Home...Traditional Agroforestry System in India- Shifting Cultivation, Taungya, Home...
Traditional Agroforestry System in India- Shifting Cultivation, Taungya, Home...
 
Nanoparticles synthesis and characterization​ ​
Nanoparticles synthesis and characterization​  ​Nanoparticles synthesis and characterization​  ​
Nanoparticles synthesis and characterization​ ​
 
PossibleEoarcheanRecordsoftheGeomagneticFieldPreservedintheIsuaSupracrustalBe...
PossibleEoarcheanRecordsoftheGeomagneticFieldPreservedintheIsuaSupracrustalBe...PossibleEoarcheanRecordsoftheGeomagneticFieldPreservedintheIsuaSupracrustalBe...
PossibleEoarcheanRecordsoftheGeomagneticFieldPreservedintheIsuaSupracrustalBe...
 
Luciferase in rDNA technology (biotechnology).pptx
Luciferase in rDNA technology (biotechnology).pptxLuciferase in rDNA technology (biotechnology).pptx
Luciferase in rDNA technology (biotechnology).pptx
 
Isotopic evidence of long-lived volcanism on Io
Isotopic evidence of long-lived volcanism on IoIsotopic evidence of long-lived volcanism on Io
Isotopic evidence of long-lived volcanism on Io
 
Lucknow 💋 Russian Call Girls Lucknow Finest Escorts Service 8923113531 Availa...
Lucknow 💋 Russian Call Girls Lucknow Finest Escorts Service 8923113531 Availa...Lucknow 💋 Russian Call Girls Lucknow Finest Escorts Service 8923113531 Availa...
Lucknow 💋 Russian Call Girls Lucknow Finest Escorts Service 8923113531 Availa...
 
Discovery of an Accretion Streamer and a Slow Wide-angle Outflow around FUOri...
Discovery of an Accretion Streamer and a Slow Wide-angle Outflow around FUOri...Discovery of an Accretion Streamer and a Slow Wide-angle Outflow around FUOri...
Discovery of an Accretion Streamer and a Slow Wide-angle Outflow around FUOri...
 
Unlocking the Potential: Deep dive into ocean of Ceramic Magnets.pptx
Unlocking  the Potential: Deep dive into ocean of Ceramic Magnets.pptxUnlocking  the Potential: Deep dive into ocean of Ceramic Magnets.pptx
Unlocking the Potential: Deep dive into ocean of Ceramic Magnets.pptx
 
A relative description on Sonoporation.pdf
A relative description on Sonoporation.pdfA relative description on Sonoporation.pdf
A relative description on Sonoporation.pdf
 
STERILITY TESTING OF PHARMACEUTICALS ppt by DR.C.P.PRINCE
STERILITY TESTING OF PHARMACEUTICALS ppt by DR.C.P.PRINCESTERILITY TESTING OF PHARMACEUTICALS ppt by DR.C.P.PRINCE
STERILITY TESTING OF PHARMACEUTICALS ppt by DR.C.P.PRINCE
 
Grafana in space: Monitoring Japan's SLIM moon lander in real time
Grafana in space: Monitoring Japan's SLIM moon lander  in real timeGrafana in space: Monitoring Japan's SLIM moon lander  in real time
Grafana in space: Monitoring Japan's SLIM moon lander in real time
 
9953056974 Young Call Girls In Mahavir enclave Indian Quality Escort service
9953056974 Young Call Girls In Mahavir enclave Indian Quality Escort service9953056974 Young Call Girls In Mahavir enclave Indian Quality Escort service
9953056974 Young Call Girls In Mahavir enclave Indian Quality Escort service
 
Hubble Asteroid Hunter III. Physical properties of newly found asteroids
Hubble Asteroid Hunter III. Physical properties of newly found asteroidsHubble Asteroid Hunter III. Physical properties of newly found asteroids
Hubble Asteroid Hunter III. Physical properties of newly found asteroids
 
Biological Classification BioHack (3).pdf
Biological Classification BioHack (3).pdfBiological Classification BioHack (3).pdf
Biological Classification BioHack (3).pdf
 

Error-Bar_Charts.pdf

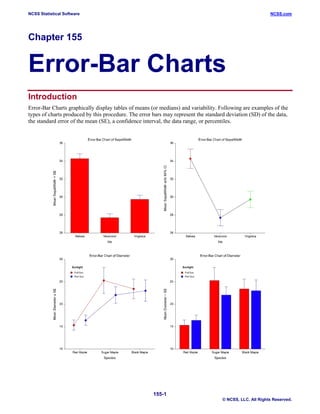
  • 1. NCSS Statistical Software NCSS.com 155-1 © NCSS, LLC. All Rights Reserved. Chapter 155 Error-Bar Charts Introduction Error-Bar Charts graphically display tables of means (or medians) and variability. Following are examples of the types of charts produced by this procedure. The error bars may represent the standard deviation (SD) of the data, the standard error of the mean (SE), a confidence interval, the data range, or percentiles.
  • 2. NCSS Statistical Software NCSS.com Error-Bar Charts 155-2 © NCSS, LLC. All Rights Reserved. Data Structure An error-bar chart is constructed from a numeric variable. A second variable may be used to divide the first variable into groups (e.g., age group or gender). In the two-factor procedure, a third variable may be used to divide the groups into subgroups. Error-Bar Chart Window Options This section describes the specific options available on the Error-Bar Chart window, which is displayed when the Error-Bar Chart button is clicked. Common options, such as axes, labels, legends, and titles are documented in the Graphics Components chapter. Error-Bar Chart Tab Estimation of Center Section You can choose whether to plot means or medians. Bars and Symbols Section You can modify the color of bars, border, and/or symbols using the options in this section. One Factor
  • 3. NCSS Statistical Software NCSS.com Error-Bar Charts 155-3 © NCSS, LLC. All Rights Reserved. Two Factors Variation (Error Bars) Section You modify the variation line that extends from the mean using the options in this section.
  • 4. NCSS Statistical Software NCSS.com Error-Bar Charts 155-4 © NCSS, LLC. All Rights Reserved. Layout Tab Orientation Section You can orient the bars horizontally or vertically. Object Spacing and Size Section You can change the size of the gap between individual bars. Connecting Lines Tab Connect Between Groups Section You can add reference lines at group means and percentiles.
  • 5. NCSS Statistical Software NCSS.com Error-Bar Charts 155-5 © NCSS, LLC. All Rights Reserved. Titles, Legend, Numeric Axis, Group Axis, Grid Lines, and Background Tabs Details on setting the options in these tabs are given in the Graphics Components chapter. Example 1 – Creating an Error-Bar Chart This section presents an example of how to generate an error-bar chart. The data used are from the Fisher dataset. We will create error-bar charts of the SepalLength variable, grouping on the type of iris. Setup To run this example, complete the following steps: 1 Open the Fisher example dataset • From the File menu of the NCSS Data window, select Open Example Data. • Select Fisher and click OK. 2 Specify the Error-Bar Charts procedure options • Find and open the Error-Bar Charts procedure using the menus or the Procedure Navigator. • The settings for this example are listed below and are stored in the Example 1 settings template. To load this template, click Open Example Template in the Help Center or File menu. Option Value Variables Tab Data Variable(s)...................................... SepalLength Horizontal (Group) Variable.................... Iris Report Options (in the Toolbar) Variable Labels....................................... Column Names Data Labels............................................. Value Labels 3 Run the procedure • Click the Run button to perform the calculations and generate the output.
  • 6. NCSS Statistical Software NCSS.com Error-Bar Charts 155-6 © NCSS, LLC. All Rights Reserved. Error-Bar Chart Output Error-Bar Charts ──────────────────────────────────────────────────────────── The second plot is the same data with the bar fill and bar border removed and symbols and connecting lines added (see Example 1b settings template).
  • 7. NCSS Statistical Software NCSS.com Error-Bar Charts 155-7 © NCSS, LLC. All Rights Reserved. Example 2 – Creating an Error-Bar Chart with Subgroups This section presents an example of how to generate an error-bar chart with subgroups. The data used are from the fictitious Tree dataset. We will create error-bar charts of the Diameter variable, grouping on Species, with subgroups according to Sunlight. Setup To run this example, complete the following steps: 1 Open the Tree example dataset • From the File menu of the NCSS Data window, select Open Example Data. • Select Tree and click OK. 2 Specify the Error-Bar Charts (2 Factors) procedure options • Find and open the Error-Bar Charts (2 Factors) procedure using the menus or the Procedure Navigator. • The settings for this example are listed below and are stored in the Example 2 settings template. To load this template, click Open Example Template in the Help Center or File menu. Option Value Variables Tab Data Variable(s)...................................... Diameter Horizontal (Group) Variable.................... Species Legend (Subgroup) Variable .................. Sunlight Report Options (in the Toolbar) Data Labels............................................. Value Labels 3 Run the procedure • Click the Run button to perform the calculations and generate the output.
  • 8. NCSS Statistical Software NCSS.com Error-Bar Charts 155-8 © NCSS, LLC. All Rights Reserved. Error-Bar Chart Output Error-Bar Charts ──────────────────────────────────────────────────────────── The second plot is the same data with the bar fill and bar border removed and symbols and connecting lines added (see Example 2b settings template).
  • 9. NCSS Statistical Software NCSS.com Error-Bar Charts 155-9 © NCSS, LLC. All Rights Reserved. You can also make the error-bar lines be the same color as the symbol color and include connecting lines between groups as in the following plot (see Example 2c settings template). Error-Bar Charts ────────────────────────────────────────────────────────────
  • 10. NCSS Statistical Software NCSS.com Error-Bar Charts 155-10 © NCSS, LLC. All Rights Reserved. Example 3 – Creating an Error-Bar Chart with 95% Confidence Interval Limits and Raw Data This section presents an example of how to generate an error-bar chart with 95% confidence interval limits. The data used are from the Fisher dataset. We will create error-bar charts of the SepalLength variable, grouping on the type of iris. Setup To run this example, complete the following steps: 1 Open the Fisher example dataset • From the File menu of the NCSS Data window, select Open Example Data. • Select Fisher and click OK. 2 Specify the Error-Bar Charts procedure options • Find and open the Error-Bar Charts procedure using the menus or the Procedure Navigator. • The settings for this example are listed below and are stored in the Example 3 settings template. To load this template, click Open Example Template in the Help Center or File menu. Option Value Variables Tab Data Variable(s)...................................... SepalLength Horizontal (Group) Variable.................... Iris Error-Bar Chart Format (Click the Button) Bar Fill ................................................. Unchecked Bar Border ........................................... Unchecked Symbol................................................. Checked Raw Data............................................. Checked Error-Bar Variation Line Type.............. Confidence Interval Report Options (in the Toolbar) Variable Labels....................................... Column Names Data Labels............................................. Value Labels 3 Run the procedure • Click the Run button to perform the calculations and generate the output.
  • 11. NCSS Statistical Software NCSS.com Error-Bar Charts 155-11 © NCSS, LLC. All Rights Reserved. Error-Bar Chart Output Error-Bar Charts ────────────────────────────────────────────────────────────
  • 12. NCSS Statistical Software NCSS.com Error-Bar Charts 155-12 © NCSS, LLC. All Rights Reserved. Example 4 – Creating an Error-Bar Chart with Medians This section presents an example of how to generate an error-bar chart with medians instead of means. The data used are from the Fisher dataset. We will create error-bar charts of the SepalLength variable, grouping on the type of iris. Setup To run this example, complete the following steps: 1 Open the Fisher example dataset • From the File menu of the NCSS Data window, select Open Example Data. • Select Fisher and click OK. 2 Specify the Error-Bar Charts procedure options • Find and open the Error-Bar Charts procedure using the menus or the Procedure Navigator. • The settings for this example are listed below and are stored in the Example 4 settings template. To load this template, click Open Example Template in the Help Center or File menu. Option Value Variables Tab Data Variable(s)...................................... SepalLength Horizontal (Group) Variable.................... Iris Error-Bar Chart Format (Click the Button) Error-Bar Chart Tab Bar Fill ................................................. Unchecked Bar Border ........................................... Unchecked Symbol................................................. Checked Raw Data............................................. Unchecked Connecting Lines Tab Medians............................................... Checked Painting Order Tab Move Connecting Lines before Error-Bar Chart Report Options (in the Toolbar) Variable Labels....................................... Column Names Data Labels............................................. Value Labels 3 Run the procedure • Click the Run button to perform the calculations and generate the output.
  • 13. NCSS Statistical Software NCSS.com Error-Bar Charts 155-13 © NCSS, LLC. All Rights Reserved. Error-Bar Chart Output Error-Bar Charts ──────────────────────────────────────────────────────────── When medians are plotted, the error-bars are not necessarily symmetric about the median. In this example, the 25th and 75th percentiles are represented by the lower and upper error bars, respectively. The other option when plotting medians is to draw error bars that cover the entire range of the data as displayed in the following plot (see Example 4b settings template).
  • 14. NCSS Statistical Software NCSS.com Error-Bar Charts 155-14 © NCSS, LLC. All Rights Reserved. Error-Bar Charts ────────────────────────────────────────────────────────────