Creating a histogram
•Download as PPTX, PDF•
1 like•101 views

This document provides information on histograms and how to create them in Excel. It defines a histogram as a graphical representation of data distribution using bins to count the number of data points within a given range. It explains that histograms can visualize data variation, central tendencies, and range. The document then provides step-by-step instructions for using Excel's built-in function to generate a histogram, including selecting the data range, determining the number and size of bins, and generating an output table and optional chart.

Recommended
More Related Content
What's hot
What's hot (16)
Viewers also liked
Viewers also liked (20)
Similar to Creating a histogram
Similar to Creating a histogram (20)
Recently uploaded
Recently uploaded (20)
Creating a histogram
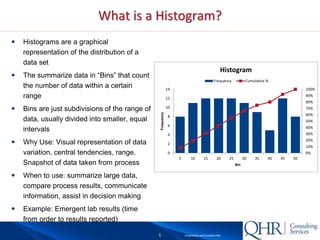
- 1. 1 Proprietary and Confidential What is a Histogram? Histograms are a graphical representation of the distribution of a data set The summarize data in “Bins” that count the number of data within a certain range Bins are just subdivisions of the range of data, usually divided into smaller, equal intervals Why Use: Visual representation of data variation, central tendencies, range. Snapshot of data taken from process When to use: summarize large data, compare process results, communicate information, assist in decision making Example: Emergent lab results (time from order to results reported) 0% 10% 20% 30% 40% 50% 60% 70% 80% 90% 100% 0 2 4 6 8 10 12 14 5 10 15 20 25 30 35 40 45 50 Frequency Bin Histogram Frequency Cumulative %
- 2. 2 Proprietary and Confidential Creating a Histogram with Excel’s Built In Function Before you begin, the first step is to find the range of data. I have data listed in column C Find the range by using Min/Max =Min(Data Range) =Max(Data Range) Determine how many bins you want and divide the max by that number to find the bin steps (round up to the nearest whole number. Start with the bin step as the first bin. Create a list of bins that you would like to use (for example: if you would like to have 5 bins between 25 and 125, the step would be 25 and the bins would be: 25, 50, 75, 100, 125) Navigate to the “Data Analysis” option under the data tab (this is for excel 2010, please see link before for other versions). A popup will appear where you can select “Histogram” For steps on enabling Analysis ToolPak, please see this MS Support Article: http://support.microsoft.com/kb/214269
- 3. 3 Proprietary and Confidential Creating a Histogram with Excel’s Built in Function Input Range will be the data range Bin Range will be the range where you defined your bins There are several other options: Pareto – sorts the data from largest bin to smallest bin Cumulative % - gives you the cumulative % of each bin, plus all previous bins Chart Output – creates a chart based on the data After making your selections, press “OK” Excel will process the information and provide you a data table and chart (if selected)