Presentation1, radiological application of diffusion weighted imges in neuroradiology.
•Download as PPTX, PDF•
15 likes•1,600 views

Health&Medicine.

Recommended
More Related Content
What's hot
What's hot (20)
Similar to Presentation1, radiological application of diffusion weighted imges in neuroradiology.
Similar to Presentation1, radiological application of diffusion weighted imges in neuroradiology. (20)
More from Abdellah Nazeer
More from Abdellah Nazeer (20)
Recently uploaded
Recently uploaded (20)
Presentation1, radiological application of diffusion weighted imges in neuroradiology.
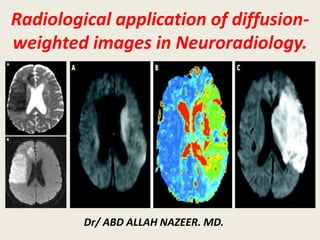
- 1. Radiological application of diffusion- weighted images in Neuroradiology. Dr/ ABD ALLAH NAZEER. MD.
- 2. A relatively large number of intracranial diseases can show restricted diffusion and may therefore appear bright on diffusion-weighted images. An incomplete listing by category of disease is shown below, with the most common examples highlighted in red: Restricted Diffusion. Which diseases are "bright" on DW imaging and why?
- 4. Diffusion weighted MRI in acute stroke. Diffusion weighted imaging (DWI) is a commonly performed MRI sequence for evaluation of acute ischemic stroke and is sensitive in the detection of small and early infarcts. Conventional MRI sequences (T1WI, T2WI) may not demonstrate an infarct for 6 hours, and small infarcts may be hard to appreciate on CT for days, especially without the benefit of prior imaging. Increased DWI signal in ischemic brain tissue is observed within a few minutes after arterial occlusion and progresses through a stereotypic sequence of apparent diffusion coefficient (ADC) reduction, followed by subsequent increase, pseudo-normalization and, finally, permanent elevation. Reported sensitivity ranges from 88-100% and specificity ranges from 86-100%.
- 5. Diffusion-weighted imaging (DWI) has become a pillar of current neuroimaging and has revolutionized stroke imaging since its introduction in the mid-1980s. DWI provides image contrast that is dependent on the molecular motion of water. Diffusion abnormalities represent alterations in the random movement of water molecules in tissues, revealing their micro architecture, and occur in many neurological conditions1. In a DWI sequence diffusion sensitization gradients are applied on either side of the 180° refocusing pulse. The parameter “b value” decides the diffusion weighting and is expressed in s/mm. It is proportional to the square of the amplitude and duration of the gradient applied. Diffusion is qualitatively evaluated on trace images and quantitatively by the parameter called apparent diffusion coefficient (ADC). Tissues with restricted diffusion are bright on the trace image and hypointense on the ADC map. In the brain, factors contributing to the measured ADC include true random diffusion, tortuosity of the diffusion space, cytosolic streaming, exchange times between compartments and restriction by cell membranes.
- 6. Radiographic features The appearance of DWI/ADC depends on the timing. Acute (0-7 days) ADC value decreases with maximal signal reduction at 1 to 4 days marked hyperintensity on DWI (a combination of T2 and diffusion weighting), less hyperintensity on exponential images, and hypointensity on ADC images subsequently, release of inflammatory mediators from ischemic brain tissue leads to vasogenic edema with extravasation of water molecules from blood vessels to expand the interstitial space, where water molecule diffusion is highly unrestricted early DWI reversal (aka diffusion lesion reversal) can occur, most frequently with reperfusion, but this rarely alters the size of the eventual infarct and is probably a 'pseudoreversal. Subacute (1-3 weeks) ADC pseudonormalization occurs in the second week (7-15 days) ADC values rise and return to near baseline irreversible tissue necrosis is present despite normal ADC values DWI remains hyperintense due to T2 shine through after 2 weeks ADC values continue to rise above normal parenchyma and the region appears hyperintense Chronic (>3 weeks) ADC signal high DWI signal low (as T2 hyperintensity and thus T2 shine through resolve)
- 7. 1.Increase in intracellular water. With cell death or insufficient intracellular energy metabolism, membrane pumps responsible for maintaining ionic gradients fail and swelling (cytotoxic edema) develops. 2.Reduction in extracellular space. This occurs as a consequence of cellular swelling, resulting in increased tortuosity of extracellular pathways. 3.Fragmentation of cellular components. With cell death or rupture, cellular components (membranes, mitochondria, endoplasmic reticulum, proteins, etc) dissociate, fragment, and unravel. Both intracellular and extracellular viscosity increases. Cerebral Infarction Restricted diffusion typically occurs within 30-120 minutes after a cerebral infarction, returning to normal by 10-14 days. The principal mechanisms are thought to be:
- 8. Acute stroke. a Increased signal intensity on DWI in the territory of the right middle cerebral artery (MCA), which corresponds to an area of low ADC value in b (asterisks), representing the extension of an acute ischaemic stroke. c A clot as the etiology, presenting as a linear hypointense abnormality in the MCA on T2*WI (arrow)
- 9. Images of a newborn with seizures at 6 h of age. MRI of the brain performed on day 3 of life. a Axial T2-W image shows large left middle cerebral artery territory infarction with loss of the cortical ribbon (arrows). b, c DW image (b) and ADC map (c) show decreased diffusion throughout the left middle cerebral artery territory as well as in the left thalamus (asterisk)
- 10. Acute left MCA territory infarct secondary to left ICA dissection. Axial DWI (A) & ADC (B) images of brain demonstrate acute infarct in left MCA territory (red & white arrows). On axial T2W image (C), hyperintense crescent (green arrow) with a medially located string like flow void in left ICA suggesting dissection with thrombosis of the false lumen. On MIP reconstruction of 3D TOF angiogram (D) loss of flow related signal in left MCA (yellow arrow) and ICA is visualized (blue arrow) suggesting thrombosis.
- 11. Basilar artery dissection with acute infarcts in bilateral cerebellar hemispheres. Axial DWI image of brain (A) and corresponding ADC map (B)demonstrate acute infarcts in bilateral cerebellar lobes and middle cerebellar peduncles (*). On 3D TOF MR angiogram (C) there is a hypointense flap (red arrow)at the basilar artery suggesting basilar artery dissection. On CT angiogram (D) and 3D VRT image (E) the dissecting flap in the basilar artery (red arrows) and luminal narrowing can be well appreciated.
- 12. Suspected vasculitis. Malignant right ICA territory infarct.
- 13. 15 years old with superior sagittal sinus thrombosis. Acute venous infarcts showing diffusion restriction in bilateral frontal lobes.
- 14. Diffuse axonal injury (DAI) and cortical contusions constitute the vast majority of primary intra-axial lesions in cases of traumatic brain injury and are associated with significant morbidity. DAI results from rotational acceleration and deceleration forces producing diffuse shear-strain deformations of brain tissue, usually at the gray- white junction, in the corpus callosum, and at the dorsolateral aspect of the upper brain stem. Cortical contusions are caused by direct contact between the skull and brain parenchyma, most often in the temporal and frontal lobes.
- 15. 52 year-old man with intracranial injuries sustained in a motor vehicle accident. Brain MR imaging was performed 18 days after the accident. A and B, Axial fast spin-echo T2- weighted (4000/98/1) (A) and FLAIR (11000/125/1) (B) images both show evidence of diffuse axonal injury, as evidenced by hyperintense signal in the splenium. C and D, Isotropic diffusion- weighted (10000/125/1) (C) and diffusion trace (D) images show hyperintense signal and decreased ADC values, respectively, consistent with cellular edema. Of particular interest in this case is that ADC values were decreased well into the subacute period after the injury.
- 16. 40 year-old man examined with brain MR imaging 7 days after injury. A and B, Axial fast spin- echo (4000/98/1) (A) and FLAIR (11000/125/1) (B) images at the level of the splenium confirm diffuse axonal injury, with hyperintense signal seen on both pulse sequences. Also note the small bilateral frontal subdural hematomas and a small contusion in the left anterior temporal lobe. C and D, Isotropic diffusion-weighted (10000/125/1) (C) and diffusion trace (D) images show hyperintense signal and decreased ADC values, respectively.
- 17. Bifrontal traumatic microbleeds (TMBs) are identified on head CT (A). Gradient-echo MRI (B) reveals additional TMBs involving the forceps minor fibers and the splenium of the corpus callosum. Diffusion- weighted MRI (C) and apparent diffusion coefficient map (D) demonstrate restricted diffusion in the genu of the corpus callosum extending into the bifrontal white matter.
- 26. Spinal cord ischemia. High T2 signal abnormality in the conus medullaris with diffusion restriction on DWI (arrows) compatible with an ischaemic lesion
- 27. Arterial dissection. DWI (a), ADC (b), non- contrast FAT SAT T1 (c) and coronal MIP reconstruction of the basilar artery (d) demonstrate a dissection with mural hematoma represented by the “crescent sign” (arrows), which shows restricted diffusion and hyperintensity on T1WI
- 28. Venous thrombosis. DWI (a), ADC map (b) and sagittal reconstruction of T1 3D with gadolinium (c) show thrombosis of the left jugular vein (arrows), presenting with restricted diffusion and a filling defect in the vessel after contrast administration.
- 31. Parechovirus encephalitis. Neonate with seizures DWI images demonstrates extensive and symmetric areas of diffusion restriction involving periventricular white matter, corpus callosum and thalamus.
- 32. Rota viral encephalitis. 5day old child with seizures. DWI images demonstrates extensive and symmetric areas of diffusion restriction involving periventricular white matter, corpus callosum and thalamus.
- 33. Dengue encephalitis. 4-year old child with fever since 4 days,1 episode of seizure, altered sensorium. MR imaging demonstrates bilateral symmetrical T2/FLAIR hyperintensity (A,B) and T1 hypointensity(C) in thalamus, posterior limb of internal capsules. The corresponding areas demonstrate restricted diffusion (D,E) with blooming(F)seen in bilateral thalamus suggestive of hemorrhage. Serology was positive for Dengue. Imaging differential for this appearance could be Acute necrotizing encephalitis of childhood.
- 34. 18 years old with Japanese encephalitis. T2/FLAIR hyperintensities seen in bilateral thalami and substantia nigra with areas of diffusion restriction. Associated right frontal neurocysticercosis(NCC) with perifocal edema can be noted. NCC and JE co-infection can be attributed to common epidemiologic and socio-demographic factors.
- 35. 17 years old with Influenza encephalitis, presenting as transient splenial lesion.
- 38. Early subacute hypoxic–ischemic encephalopathy (HIE) mimicking acute toxic leukoencephalopathy in 15-year-old unresponsive boy after suicide attempt. CT findings were negative (not shown). A and B, Severe extent of abnormality in periventricular white matter on diffusion-weighted image(A) and apparent diffusion coefficient map (B) 6 days later. C, Bright cortical and caudate signal on FLAIR (arrows) indicates HIE. Patient died 11 days after insult.
- 39. Renal Failure with Acute Toxic Leukoencephalopathy.
- 41. leukoencephalopathy due to due to drug toxicity.
- 42. Cerebellar Hippocamp al and Basal Nuclei Transient Edema with Restricted diffusion (CHANTER) Syndrome.
- 43. 15 years old with Status epilepticus. Axial diffusion weighted images in a patient with seizure disorder shows symmetrical diffusion restriction in bilateral hippocampus. Complete resolution seen on follow up imaging (not shown).
- 44. Status epilepticus in a 2-year-old girl. A, Coronal FLAIR image shows diffuse hyperintense lesions in the left hemisphere including the left thalamus, cingulate gyrus, and hippocampus. B and C, DW images show these lesions as hyperintense with decreased ADC. They represent cytotoxic edema due to excitotoxic injury mediated by neuronal seizure activity. These lesions were partially reversed on follow-up MR imaging (not shown).
- 45. Central pontine myelinolysis in a 14-year-old female adolescent. A, T2-weighted image shows a hyperintense lesion in the pons. B and C, DW images show this lesion a hyperintense with mildly decreased ADC. This finding represents cytotoxic edema seen in the early phase of central pontine myelinolysis
- 46. Phenylketonuria in a 36-year-old man A, T2-weighted image shows hyperintense lesions in the periventricular white matter. B and C, DW image shows these lesions as hyperintense with decreased ADC. Excitotoxicity may be related to impairment of glutamate receptor function by l-phenylalanine.
- 47. Glutaric aciduria in a 13-year-old male adolescent. A, T2-weighted image shows hyperintense lesions in the bilateral globus pallidus (arrows) and diffusely in the white matter. B and C, DW image shows these lesions as hyperintense with decreased ADC. Excitotoxic injury may be due to an accumulation of organic acids that share structural similarities with glutamate.
- 51. Maple syrup urine disease (a) Axial diffusion weighted images (DWI) image showing restricted diffusion in bilateral middle cerebellar peduncles, (b) Axial DWI image showing restricted diffusion in brainstem, (c) Axial DWI image showing restricted diffusion in corticospinal tracts.
- 52. Maple syrup urine disease Diffusion-weighted images with corresponding apparent diffusion coefficient maps demonstrate restricted diffusion in the central part of the centrum semiovale (A, D); posterior limbs of the internal capsules and thalami (B, E); and pons and cerebellar white matter (C, F)
- 53. Adrenoleukodystrophy and progressive vision loss in a 10- year-old boy. a Bilaterally symmetric parieto-occipital signal changes are present (arrowheads) on the T2-W image. b DW image shows low signal within the involved white matter (arrowheads). c ADC map shows increased diffusion values within the regions of signal abnormality (arrowheads)
- 54. Canavan's disease with Diffusion restriction at the acute stage.
- 55. Canavan's disease. a-h Axial MRIs. a DWI shows hyperintensity in the internal capsule and subcortical white matter; B) ADC demonstrates corresponding hypointensities; c T2 FLAIR image; d T1 image. e DWI with hyperintensities in the subcortical white matter; f Corresponding ADC hypointensities; g T2 image; d T1 image. Single voxel MRS demonstrates increased NAA (arrow, peak at 2.02 ppm; choline, asterisk, 3.2 ppm; creatine, arrowhead, 3 ppm); inset shows area of analysis in the posterior left hemisphere.
- 56. Canavan's disease in a 4-year child demonstrating typical diffusion restriction of involving subcortical white matter and classical NAA peak on spectroscopy.
- 57. Acute Carbon Monoxide Poisoning.
- 58. Hypoglycemia induced restricted diffusion along bilateral posterior limb of internal capsules and splenium of corpus callosum.
- 59. Early Diffusion MR Imaging Findings and Short-Term Outcome in Comatose Patients with Hypoglycemia.
- 60. Reversible hyperintensity lesion on diffusion- weighted MRI in hypoglycemic coma.
- 61. Diffusion- Weighted Imaging of Acute Corticospinal Tract Injury Preceding Wallerian Degeneration in the Maturing Human Brain.
- 62. A 16-year-old boy (patient 1) presented with acute altered mental status following inhalation of heroin vapor. Brain magnetic resonance imaging demonstrates diffuse symmetrical infratentorial (a–c) and supratentorial (d–f) white matter T2 hyperintensities. This T2 prolongation shows restricted diffusion with increasing signal on diffusion- weighted images (b) and (e) with corresponding decreased diffusion scalars on the matching ADC map (c) and (f). There is increased T2 signal of the posterior paraspinal muscles seen on axial (g) and sagittal (h) images of the cervical spine compatible with a clinical diagnosis of rhabdomyolysis affecting predominantly the posterior neck musculature
- 63. Complete hemiplegia. Following a positive urine analysis, she admitted having taken considerable amounts of cocaine.
- 64. Neonatal HIE in a 6-day-old boy with profound perinatal asphyxia. A, On the T2-weighted image, gray matter–white matter delineation is partially obliterated. The anterior and posterior aspects of the corpus callosum show high signal intensity. B and C, DW images show diffuse hyperintensity with decreased ADC in the corpus callosum (arrows), internal capsules, thalami, and white matter. This distribution may be related to excitatory circuits. The neonatal brain seems to be highly vulnerable to acute excitotoxic injury.
- 65. A 15 years old girl with HIE and resultant global diffusion restriction.
- 66. Neonatal HIE in a 10-day-old boy with profound perinatal asphyxia. A, DW image shows extensive hyperintense lesions involving the frontotemporoparietal white matter, internal capsules, and basal ganglia. B, DW image at the level of the midbrain shows hyperintense lesions with decreased ADC (not shown) in the bilateral cerebral peduncles. These findings represent the early phase of wallerian degeneration.
- 67. Shaken baby syndrome in a 2-year-old girl. A, T2-weighted image shows bilateral hyperintense lesions in the frontal and temporo- occipital lobes, basal ganglia, and corpus callosum. Subdural hematomas are seen as linear, hypointense lesions along the interhemispheric fissure (arrows). B, T1-weighted image shows subdural hematomas in the posterior fossa in addition to the interhemispheric fissure (arrows). C and D, DW images show the brain parenchymal injury as hyperintense with decreased ADC that represents cytotoxic edema presumably due to injuries with combined excitotoxic mechanisms.
- 68. 8 years old with RTA Cerebral fat embolism with starry sky appearance.
- 72. 25-year-old woman with demyelinating lesion. A, Demyelinating plaque is seen in left middle cerebellar peduncle (green circle) showing restricted diffusion with hypointense signal intensity on apparent diffusion coefficient (ADC) map (A) and hyperintense signal intensity on trace image (B). Notice no contrast enhancement is seen in that location on contrast- enhanced T1-weighted image (C), reflecting hyperacute demyelinating plaque. On same contrast-enhanced T1-weighted image, there is another focus of enhancement (blue circle, C), located in right cerebellar peduncle close to fourth ventricle wall, with hyperintense signal on trace image (blue circle, B) and isointense signal on ADC map (blue circle, A), representing most common demyelinating lesion behavior on diffusion-weighted imaging.
- 74. 37-year-old man with spinal cord demyelinating lesions.
- 76. 8-year child with ADEM demonstrating peripheral rim like diffusion restriction and incomplete ring enhancement.
- 80. Fourth ventricle medulloblastoma in 4year child demonstrating diffusion restriction.
- 86. GBM. Left parieto-occipital lesion with peripheral vasogenic edema. DWI and ADC (a and b, respectively) show a clear area of increased diffusion within the core, corresponding to a necrotic centre. On T1 3D post gadolinium the mass shows ring enhancement
- 89. Primary CNS lymphoma. Left frontal periventricular lesion showing prominent diffusion restriction, presenting with hyperintensity on DWI (a), low ADC value (b) and mild hyperintensity on T2WI (c), all typical features of this type of hypercellular tumour. T1WI post gadolinium (d) shows homogeneous and intense contrast enhancement.
- 92. Meningothelial meningioma in the left high frontal convexity. A, On a T2-weighted image, tumor is mildly high in intensity. B, Tumor enhances homogeneously on a T2- weighted image. C, The tumor is of high intensity on DWI. D, Regions of interest are shown on the ADC map. The ADC values are 0.76, 0.63, and 0.55, and the averaged ADC value is 0.65. Restricted diffusion in the tumor probably is caused by high tumor cellularity.
- 93. Fibrous meningioma in the left convexity. A, On a T2-weighted image, tumor intensity is mildly high and edema is present anterior to the tumor. B, The tumor enhances homogeneously. C, On DWI, the peripheral portion of the tumor is moderately hyperintense and the central portion is isointense. Peritumoral edema is mildly high in intensity. D, Regions of interest are shown on the ADC map. The ADC values are 0.83, 0.74, 0.71, 0.67, and 0.57, and the averaged ADC value is 0.70. Some areas of apparent restricted diffusion in the tumor probably reflect T2 shine-through effect, because ADC values in these areas are not low and the signals in those areas show high intensity on the T2-weighted image.
- 102. Abscess. Right occipital mass showing marked diffusion restriction within the core on DWI and ADC maps (a and b, respectively) and a peripheral enhancing pattern on T1 post gadolinium (c). DWI helps to differentiate ring-enhancing lesions because restricted diffusion in the centre of the mass is characteristic of pyogenic abscesses. In this case, diffusion-based sequences also helped to identify ventriculitis (arrows).
- 109. Subacute hematoma. Right parietal mass (arrowhead) showing diffusion restriction within the core on DWI and ADC maps (a and b, respectively) and a ring-enhancing pattern on T1 post gadolinium (c). This was a subacute hematoma. Clinical context is important to differentiate hemorrhage from abscess. There is also a subacute ischaemic lesion in the inferior right frontal lobe (arrows) that shows early pseudonormalisation of the ADC and gyriform enhancement post gadolinium
- 110. Optic neuritis. High DWI signal (a) and low ADC value (b) representing restricted diffusion in the right optic nerve in a patient with non-specific optic neuritis.
- 112. A 10 year boy with status post operative for glioblastoma and now demonstrates linear diffusion restriction along the ependymal surface of right lateral ventricle and also along the septum.
- 113. Post-surgical ischemia. Immediate follow-up MRI in a patient who underwent surgery for resection of a suspicious enhancing mass. In the medial aspect of the resection cavity (asterisk) there is an enhancing area on the T1 post-contrast sequence (c, arrow). This finding alone could represent residual tumour, but the presence of restricted diffusion with high signal on DWI (a) and a low ADC value (b) meant that a small area of peri- surgical ischemia was more likely. Three-month follow- up T1 post-gadolinium MRI (d) shows absence of enhancement in the same region (arrowhead), confirming this diagnosis.
- 114. Conclusion. Diffusion-weighted sequences currently play a central role in neuroimaging. The already widespread qualitative assessment allowed by these sequences improves sensitivity in the depiction of several central nervous system conditions, whereas new models of diffusion sequences provide quantitative parameters, allowing potential biomarkers for diagnosis, prognosis and follow-up. The future of DWI will undoubtedly include technical improvements to enhance data fidelity, to achieve high isotropic resolution (e.g., submillimeter) for 3D acquisitions and to reduce the image acquisition time. Furthermore, advances in ultrahigh field technology are already being applied to DWI.
- 115. Thank You.