1. The Relationship between binge alcohol consumption and
the sedative effects of Tetrahydrocannabinol (THC) in F2
progeny of a B6/D2 Mouse Cross
Zachary East1, Brandon Frtiz1 and Dr. Stephen Boehm1
1Department of Psychology, Purdue School of Science, IUPUI
Methods
• hlgll/
Introduction
Discussion and Future
Directions
There has been considerable interest lately in the combined use of THC
And alcohol. In the United States, a handful of states have passed laws
making Marijuana Legal for recreational and/or medical use. This
experiment will test if there are relationships between the consumption
of alcohol and the effects of THC on locomotor sedation. The mice used
in this experiment are from a F2 C57BL/6J (B6) x DBA/2J (D2) cross. All
of the mice have unique characteristics of B6 and D2 in their genomes.
It has been well documented that B6 mice consume more binge like
alcohol than D2 mice. One would expect mice with more B6
characteristics to drink more and those with more D2 characteristics to
drink less. Also, according to unpublished observations in our lab
(Kasten and Boehm, in preparation), it has B6 mice are more sensitive
to the locomotor sedative effects of THC than D2 mice. This should
mean that mice with more B6 characteristics would drink more and be
more sedated by the effects of THC. The experiment is trying to answer
these key questions: How do genetics influence binge drinking and THC
sedation effects? What is the degree in which the animals are sensitive
to both THC and ethanol consumption? Is there cross tolerance
between the ethanol and THC and can tolerance occur with repeated
ethanol exposure? Is there resistance to drinking and THC and are these
two variables related?
Figure 1: Binge drinking data for Group A over a four day period.
Figure 2: Binge drinking data for Group B over a four day period three days
after THC injection.
Figure 3: THC locomotor activity: first day was vehicle injection and the
second day was an injection of 10 mg/kg THC. Both groups had a similar
sedative response on the second day due to the THC injection.
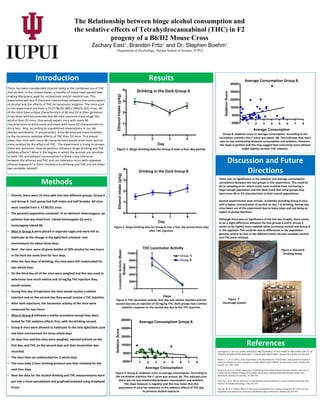
Figure 4: Group A: Sedation score vs average consumption. According to
the correlation statistics the r2 value was around .06. This indicates that
there was no real relationship between consumption and sedation.
The slope however is negative and this may mean that this
population of mice has tolerance to the sedative effects of THC due
to previous alcohol exposure.
Group B: Sedation score vs average consumption. According to the
correlation statistics the r2 value was about .08. This indicates that there
was no real relationship between consumption and sedation. However,
the slope is positive and this may suggest that consuming more ethanol
might slightly increase THC sedation.
• Overall, there were 76 mice split into two different groups, Group A
and Group B. Each group had half males and half females. All mice
were created from a F2 B6/D2 cross.
• The parental population consisted of an identical heterozygous po
pulation that was bred from inbred homozygote D2 and a
homozygote inbred B6.
• Mice in Group A were placed in separate cages and were left to
habituate to the change in the light/dark schedule and
environment for about three days.
• Next , the mice were all given bottles of 20% alcohol for two hours
in the dark the same time for four days.
• After the four days of drinking, the mice were left undisturbed for
two whole days.
• On the third day all of the mice were weighed and this was used to
determine how much vehicle and 10 mg/kg THC injection they
would receive.
• During first day of injections the mice would receive a vehicle
injection and on the second day they would receive a THC injection.
• After both injections, the locomotor activity of the mice were
measured for two hours.
• Mice in Group B followed a similar procedure except they were
tested for THC sedative effects first, with the drinking second.
• Group B mice were allowed to habituate to the new light/dark cycle
and their environment for three whole days
• On days four and five they were weighed, injected (vehicle on the
first day, and THC on the second day) and their locomotion was
recorded.
• The mice then sat undisturbed for 3 whole days
• The once daily 2 hour drinking protocol was then initiated for the
next four days
• Next the data for the alcohol drinking and THC measurements were
put into a Excel spreadsheet and graphed/analyzed using Graphpad
Prism.
Drinking in the Dark Group A
Drinking in the Dark Group B
THC Locomotor Activity
Average Consumption Group A
Average Consumption Group BResults
There was no significance in the sedation and average consumption
correlations between the two groups in this experiment. This could be
do to sampling error, which could have resulted from not having a
large enough population and the likely hood that some groups may
have more B6 or D2 characteristics in their overall populations.
Several experimental ones include, accidently providing Group B mice
with a higher concentration of alcohol on day 1 of drinking, having two
mice taken out of the experiment due to leaky tubes and not being an
expert at giving injections.
Although there was no significance in the last two Graphs, there seems
to be a slight difference between the two groups A and B. Group A
seems to be slightly more sedated when increasing alcohol and Group B
is the opposite. This could be due to differences in the population
genome and/or be due to the different times the two variables alcohol
and THC were initiated.
References
Figure 7:
Homecage System
Figure 6: Standard
Drinking Setup