2. 62 C.B. Jenney et al. / Brain Research Bulletin 123 (2016) 61–70
result in differences in several other measures of addiction-like
behavior including an increase in responding for drug during peri-
ods of signaled non-availability, an increase in the willingness to
work for drug, and an increase in responding for drug in the face of
adverse consequences (e.g., foot shock).
Difficulties may arise when choosing between these models
when looking for differences in protein or epigenetic markers
of vulnerability. In the extended access model, changes in gene
and protein expression could be the result of differences in drug
exposure and/or differences in motivation for drug. With the
intermittent access model there is more confidence that molec-
ular differences are not the result of differential drug exposure,
but rather more directly linked to observed addictive behavior.
That said, even with this model, several weeks of drug expo-
sure are required before individual differences become evident in
addiction-like behavior. Ideally, it would be advantageous to have
an early indicator of future addiction-like behavior for drug, prior
to a great deal of drug access.
Our laboratory has been using drug-induced avoidance of a
natural reward (i.e., a saccharin solution) as an early indicator of
vulnerability to addiction. As demonstrated by Huhn et al. (this
issue), humans recovering from opioid addiction are less respon-
sive to natural rewards and this is thought to predict increased
vulnerability to relapse. A similar pattern is evidenced in a preclin-
ical rodent model. Specifically, rats suppress intake of an otherwise
palatable saccharin cue when paired with a drug of abuse. There
are, however, robust individual differences whereby some rats,
referred to as large suppressors, exhibit greater avoidance of the
drug-paired cue than do others, referred to as small suppres-
sors. This is true when the taste cue predicts access to cocaine or
heroin (Grigson and Twining, 2002; Imperio and Grigson, 2015;
Wise et al., 1976). Interestingly, in the saccharin-heroin extended
access paradigm, this split occurs early (after only a few taste-
drug pairings), before differences in drug-taking become evident.
Further, with repeated taste-drug pairings, the large suppressors
ultimately exhibited greater load up for drug, greater drug-taking,
escalated intake over trials, marked willingness to work for drug,
and greater seeking during extinction and during drug-induced
reinstatement (see (Imperio and Grigson, 2015) and Imperio et al.
(this issue). This finding suggests that vulnerability for addiction, as
evidenced by greater devaluation of a natural reward cue, links to
many other measures of addiction, including escalated drug intake
(Edwards and Koob, 2013). Here, we aimed to test whether con-
ditioned avoidance of a heroin-paired saccharin cue following just
three taste-drug pairings would predict addiction-like behavior in
a variation of the intermittent access model employed by Deroche-
Gamonet et al. (2004).
Another aim of this study was to determine whether changes
in the expression of several protein mediators of synapse func-
tion could act as molecular markers of addiction vulnerability. We
have previously performed protein interaction screens to identify
novel modulators of mu-opioid receptor and D2 dopamine recep-
tor (D2R) function that may contribute to the addiction phenotype.
We demonstrated that opioids alter Wnt secretion, presumably
through an interaction between the mu opioid receptor (the pri-
mary mediator of opioid reward) and WNTless (WLS), a regulator
of Wnt release (Jin et al., 2010). Wnts are secreted molecules that
act through cell surface receptors to stabilize -catenin which, in
turn, activates transcription of genes involved in embryonic devel-
opment, synapse stability, and cancer. Also, we identified neuronal
calcium sensor-1 (NCS-1) as a D2R interactor that serves to inhibit
internalization and desensitization of the D2 receptor (Kabbani
et al., 2002). If these proteins are altered as a function of vulner-
ability for addiction-like behavior, then they may serve as novel
therapeutic targets for the prevention and/or treatment of addic-
tion.
2. Materials and methods
2.1. Animals
The subjects were 48 naïve, male Sprague-Dawley rats (Charles
River, Wilmington, MA). Data from rats with catheters that did not
remain patent for the entire study were eliminated. This study was
conducted in 2 replications with final ns = 23 and 19, respectively.
The rats were housed singly in suspended, wire mesh cages in a
humidity-controlled environment under a 12/12 h light/dark cycle.
Food (Teklad 2018, Harlan Industries, US) and water were avail-
able ad libitum, except where otherwise noted. Experiments were
approved by the Penn State College of Medicine, Institutional Ani-
mal Care and Use Committee and were performed in accordance
with National Institutes of Health specifications as outlined in the
Guide for the Care and Use of Laboratory Animals.
2.2. Catheters
In-dwelling intra-jugular catheters were custom made in our
laboratory and implanted into rats as described previously (Grigson
and Twining, 2002). After three days’ recovery, patency was main-
tained by daily flushing of catheters with heparinized saline (0.2 ml
of 30 IU/ml heparin) and verified, when necessary, by using 0.2 ml
of 1% propofol (Diprivan, APP Pharmaceuticals, Schaumburg, IL)
administered through the catheter. After surgeries, rats were given
one week to recover before the start of testing.
2.3. Apparatus
2.3.1. Self-administration chambers
Each rat was trained in one of 12 identical operant chambers
(Med Associates, St. Albans, VT) measuring 30.5 × 24.0 × 29.0 cm
and housed in light and sound attenuating cubicles as previously
described (Puhl et al., 2012). All chambers have clear Plexiglas tops,
fronts, and backs. Sidewalls are aluminum. The floors consist of 19
stainless steel rods (4.8 mm) spaced 1.6 cm apart center to center.
Each chamber is equipped with three retractable operant sipper
tubes (spouts) that enter the left side of the chamber through 1.3 cm
diameter holes spaced at 8.0 cm center to center. A stimulus light
is located 6 cm above each spout. A lickometer circuit is used to
record spout licks (and contacts such as nose pokes). Each chamber
is equipped with a house light (25 W), a tone generator (Sonalert
Time Generator, 2900 Hz), and a white noise speaker (75 dB). Self-
administration is controlled by an electronic circuit operating a
syringe pump (Med Associates). Collection of the data and control
of chamber events are performed on-line using a Windows-based
computer running programs written in Medstate notation language
(Med Associates). The lickometer circuit was used to monitor lick-
ing on the leftmost spout (saccharin), the middle spout (“inactive”,
i.e. the spout upon which responding was measured but elicited
no consequence), and the rightmost spout (“active”, i.e. the spout
upon which responding typically elicited an iv infusion of heroin).
2.3.2. Coupling assembly
Before the start of each self-administration trial, a coupling
assembly is attached to the cannula exiting through the rat’s back.
The coupling assembly consists of a metal spring attached to a metal
spacer with Tygon tubing inserted down the center to protect the
tubing from interference by the rat. The tubing is attached to a
counterbalanced swivel (Instech, Plymouth Meeting, PA) that in
turn is attached to the syringe pump outside of the experimental
chambers.
3. C.B. Jenney et al. / Brain Research Bulletin 123 (2016) 61–70 63
2.4. Drug preparation
Heroin HCl (generously provided by the National Institute on
Drug Abuse, Research Triangle Park, NC) was dissolved in sterile,
physiological (0.9%) saline at a concentration of 0.3 mg/ml. Each
intravenous injection was a 0.06 mg/0.2 ml infusion delivered over
6 s (Kuntz et al., 2008).
2.5. Habituation and training
Rats were put on a water restriction regimen wherein they
received 5 min access to water in the morning and one hour in the
afternoon from a graduated cylinder with a stainless steel spout
placed on each rat’s home cage. This occurred each day until morn-
ing intake of water stabilized (7 days). Rats were then habituated to
the self-administration chambers for 5 min per day for 3 days prior
to the start of drug access. During habituation, rats continued on
the water restriction regimen but were then given 5 min morning
access to water through one of the three chamber spouts each day
for three days. Thereafter, water was returned to the rats ad libitum
via lixits located at the back of each home cage. Rats were divided
into heroin and saline groups counterbalanced based on their 5 min
water intake averaged across the last two days of home cage water
access.
2.5.1. Phase I: saccharin–heroin self-administration
After habituation, during Phase I of the experiment, rats were
given 5 min access to a 0.15% saccharin solution from the left
spout in the self-administration chamber, as described previously
(Imperio and Grigson, 2015; Puhl et al., 2012). After 5 min, the left
spout retracted, the center and right spouts advanced and the rats
were given the opportunity to self-administer heroin or saline on
a fixed ratio 10 schedule of reinforcement where 10 licks on the
rightmost empty active spout resulted in a 6 s i.v. infusion of either
saline (n = 11) or a 0.06 mg/0.2 ml of heroin (n = 31) as previously
described by Kuntz et al. (2008). Drug or saline delivery was sig-
naled by offset of the stimulus light and onset of the tone and house
light, which remained on for 20 s (including the 6 s drug infusion).
Further responding during this 20 s time out period was not rein-
forced. The access period for heroin was 6 h. There was one such
taste-drug pairing per day for 3 days in succession.
2.5.2. Phase II: intermittent access heroin self-administration
Phase II of the experiment consisted of one trial per day, 5 days
per week, for a total of 24 trials. Each daily trial included three
40 min periods of drug availability alternated with two 15 min
periods of signaled drug non-availability (SNA) as described by
Deroche-Gamonet et al. (2004). Rats remained on the FR 10 sched-
ule of reinforcement. During periods of SNA, the active and inactive
spouts were presented without the typical stimulus light, but a
stimulus light on the opposite wall was illuminated.
2.5.3. Progressive ratio
After 24 trials of intermittent access, rats were given a sin-
gle progressive ratio (PR) test wherein the first infusion of drug
required 10 operant responses, and each subsequent infusion
required an increasing number of responses (10, 12, 14, 16, 20, 24,
30, 36, 44, 52, 62, and continuing to increase by 10 thereafter) until
no responses were emitted for 30 min or until six hours had elapsed.
The breakpoint was defined as the number of spout responses com-
pleted for the last infusion received. This schedule was a slight
modification of that used by (Deroche-Gamonet et al., 2004).
2.5.4. Extinction/reinstatement
The progressive ratio challenge was followed the next day by
a single extinction/reinstatement challenge. This consisted of a 7 h
period during which the first 6 h of operant activity was identical
to that of Section 2.5.2 but responses were not rewarded with a
heroin or saline infusion. At the end of 6 h, after drug seeking had
extinguished, there was a single non-contingent, computer con-
trolled i.v. infusion of heroin (0.06 mg/0.2 ml). Continued active
spout responding (non-reinforced) was then measured in the h
following this drug prime.
2.6. Addiction-like behavior score
To attain a score of each rat’s addiction-like behavior, we ranked
rats by their performance based on behavioral correlates of three
separate DSM-IV criteria for human substance abuse disorder
(American Psychiatric Association, 2000). The first DSM criterion
was difficulty stopping or limiting use. A measure of each rats’
persistence in drug seeking was calculated by the total number
of responses on the active spout operant across the two periods
of SNA on the terminal drug trial. The second DSM criterion used
was motivation to take drug. A measure of each rats’ motivation
to take drug, or willingness to work for drug, was calculated by
the breakpoint spout responses achieved during the PR trial. The
third behavior of the original scoring protocol used by Piazza and
colleagues (Deroche-Gamonet et al., 2004), continued use despite
harm, was not utilized in this study as the analgesic properties
of opioids may confound the results of this measure. Instead, we
chose to investigate another defining aspect of addiction: relapse.
Thus, for the third criterion we used reinstatement of heroin seek-
ing behavior based on the number of infusion attempts made during
the 1 h reinstatement test. Deroche-Gamonet et al. (2004) showed
that reinstatement behavior was highly correlated with SNA, PR,
and punished responding (mild foot-shock), thus, reinstatement is
a good replacement measure for foot-shock. Then, for each of the
three criteria, data from all heroin rats were ranked from lowest to
highest and each rat scoring in the highest third of rats in that crite-
rion received a point. Consequently, rats received an addiction-like
behavior score of 0, 1, 2, or 3.
2.7. Western blot
Within 24 h following behavioral testing, rats were sacrificed
by rapid decapitation, brains were harvested immediately, and
dissected on ice including the medial prefrontal cortex, nucleus
accumbens, ventral tegmental area, and hippocampus. The rat atlas
of coordinates (Paxinos and Watson, 2007) was used as a guide.
Specimens were frozen on dry ice and stored at −80 ◦C until pro-
cessing. Tissue was suspended in lysis buffer (50 mM Tris–HCl,
1 mM EDTA, 150 mM NaCl, 1% NP40, 0.25% deoxycholate, 5 mM
NaF, 2 mM Na3VO4) containing protease inhibitors (cOmplete MINI
EDTA free, Roche), homogenized using a microcentrifuge pestle
for 2 min, sonicated using a probe sonicator, then centrifuged at
13,000 RPM to remove cellular debris. Bradford assay (BioRad) was
used to determine protein concentration of supernatants. Samples
were diluted to 2 g/ul with lysis buffer and 4× loading dye (40%
Glycerol, 240 mM Tris/HCl pH 6.8, 8% SDS, 0.04% bromophenol blue,
5% beta-mercaptoethanol). Finally, 10 l (20 g) of sample were
separated on 4–20% TGX polyacrylamide gels (BioRad), transferred
to PVDF membranes, ponceau stained to check for even loading,
and subjected to western blotting. For each of the two behavioral
replications, two blots per brain region (in order to analyze all
rats’ samples) were run in triplicate. Saline controls were included
on all gels to normalize expression across blots. Membranes were
probed with the following antibodies: chicken anti-WLS (Jin et al.,
2010, 1:5000), chicken anti-NCS-1 (Rockland 1:10,000), and rabbit
anti--catenin (Cell Signaling 1:7500). Blots were scanned using a
back-lit scanner and quantification was performed using IMAGEJ
software. Expression was normalized to total protein (as measured
4. 64 C.B. Jenney et al. / Brain Research Bulletin 123 (2016) 61–70
by Ponceau stain), then to averaged saline controls (for comparison
between blots), and then averaged between replicates. Expres-
sion levels were statistically analyzed for differences in expression
related to drug taking, addiction score, and saccharin cue suppres-
sion.
2.8. Statistical analysis
All data were analyzed using mixed factorial ANOVAs with Sta-
tistica 7 (StatSoft Inc., Tulsa, OK). Newman–Keuls post hoc tests
were conducted on significant ANOVAs with ˛ = 0.05.
3. Results
3.1. Phase I: saccharin-heroin self-administration
3.1.1. Taste cue intake
Compared to the saccharin-saline controls, intake of the sac-
charin cue was suppressed following saccharin-heroin pairings.
However, some rats exhibited greater avoidance of the heroin-
paired cue than did others. In an effort to address these individual
differences, rats in the heroin group were separated by a 200 lick
cutoff (which, in this case, is also a median split) into large suppres-
sors (rats suppressing intake of the saccharin CS to a larger extent
relative to controls), and small suppressors (rats suppressing intake
of the CS to a smaller extent relative to controls), as described pre-
viously (Grigson and Twining, 2002; Imperio and Grigson, 2015),
see Fig. 1A .
This observation was supported by a significant 3 × 3 mixed fac-
torial ANOVA varying group (saline, small and large suppressors)
and trials (1–3), F(4,78) = 31.23, p < 0.001. Post hoc tests revealed
that small suppressors decreased consumption of the CS solution
compared to saline controls by the second and third taste-drug
pairings (ps < 0.001). Large suppressors also made fewer licks of
the saccharin cue than did the saline controls during trials 2 and 3
(ps < 0.001). Notably, large suppressors made fewer licks on the sac-
charin cue than did the small suppressors during both the second
and third trials (ps < 0.001).
3.1.2. Drug intake
When examining drug intake (Fig. 1B), there was a significant
main effect of group, with heroin-administering rats taking sig-
nificantly more heroin infusions than saline rats took of saline,
F(2,39) = 5.81, p < 0.01, overall, and a significant group × trials inter-
action, F(4,78) = 12.07, p < 0.001. Post hoc analysis of the two-way
interaction confirmed that rats took more heroin than saline infu-
sions on trials 2 and 3, ps < 0.001, with no differences found
between small and large suppressors, p > 0.05.
3.2. Phase II: intermittent access heroin self-administration
3.2.1. Drug intake
During intermittent access, the number of heroin infusions/2 h
trial was analyzed using a 2 × 24 mixed factorial ANOVA varying
group (small, large) and trials (1–24)(Fig. 2). Not unexpectedly,
there was no significant main effect of group or trials, Fs < 1, con-
firming that small and large suppressor rats self-administered
the same amount of heroin overall. The group x trials interac-
tion also did not attain statistical significance, F < 1, indicating that
there were no differences in heroin self-administration across trials
between the small and the large suppressors.
3.2.2. SNA responding
Continued responding during signaled non-availability (SNA)
was analyzed with a 2 × 24 mixed factorial ANOVA varying group
1 2 3
0
200
400
600
800
1000
1200
1400
###
###
******
***
nim5/skciLSC
Trials
Saline
Small
Large
***
A
1 2 3
2
4
6
8
10
12
14
16
***
***
***srh6/snoisufnI
Trials
Saline
Small
Large
***
B
Fig. 1. (A) Mean (±) SEM number of licks of the 0.15% saccharin CS as a function
of acquisition trials 1–3 for saline controls (closed triangles), small suppressors
(open circles, n = 13) and large suppressors (closed circles, n = 18). (B) Mean (±SEM)
number of infusions/6 h across trials 1–3 for saline controls (closed triangles), large
suppressor (closed circles, n-18), and small suppressor (open circles, n-13). (*differ-
ence from saline, #difference between large and small; *p < .05, ***p < .001).
0 4 8 12 16 20 24
0
2
4
6
8
10
12
snoisufnI
Trials
Small
Large
Fig. 2. Mean (±SEM) number of infusions/2 h across trials 1–24 for small (open
circles; n = 13) and large (closed circles; n = 18) suppressors.
5. C.B. Jenney et al. / Brain Research Bulletin 123 (2016) 61–70 65
Table 1
Mean and standard error of the mean (SEM) responses generated in each criterion and contributing to the Addiction-like Behavior Score (ALB) for: all rats; small suppressors;
large suppressors; smallest 5 suppressors; and largest 5 suppressors. Once ranked from lowest to highest, rats ranking in the highest third in each criterion received one
point towards their ALB score.
Range Mean (SEM)
Criterion Lowest 2/3 Highest 1/3 All rats Small suppressors Large suppressors Smallest 5 Largest 5
SNA 0–51 65–263 49.6 (11.7) 52.8 (14.0) 47.3 (17.8) 31.8 (18.9) 109.2 (40.8)
PR breakpoint 0–16 20–172 22.9 (5.4) 14.8 (1.5) 28.8 (9.2) 8.8 (2.2) 15.6 (4.9)
Reinstatement 0–6 7–18 5.1 (0.9) 5.5 (1.2) 4.9 (1.3) 2.2 (1.2) 6.6 (3.2)
(large and small suppressors) by trial (1–24). There was no signif-
icant main effect of group, F < 1, showing that overall there were
no significant differences in SNA responding between the large
and small suppressors. The group × trial interaction also was not
significant, F < 1 (see Table 1).
3.2.3. Progressive ratio challenge
While there was a trend for large suppressor rats to work harder
for drug during the progressive ratio challenge (Table 1), a one-way
ANOVA revealed that the main effect of group was not significant,
F(1,29) = 1.64, p > 0.20.
3.2.4. Reinstatement challenge
During the extinction phase, to confirm that seeking behavior
had been extinguished before the non-contingent prime, Student’s
t-tests demonstrated that, by the 5th and 6th hours of extinction
testing, responding by large and small suppressors on the previ-
ously active spout was not significantly different from zero nor
from each other (ps > 0.05). During the 7th hour, after the single
delivery of a computer controlled, non-contingent priming dose of
heroin, small and large suppressors increased seeking behavior, and
a one way ANOVA confirmed that the levels were not significantly
different from each other F < 1 (Table 1).
3.3. Addiction-like behavior score
Although differences were not evident for SNA, PR, or rein-
statement between small and large suppressors, overall, an
addiction-like behavior score was determined for each individual
rat. Thus, as described above, rats testing in the top third of each
addiction-like criterion scored one point, for a total addiction-like
behavior score of either zero (n = 11), one (n = 11), two (n = 8), or
three (n = 1). As in the original model (Deroche-Gamonet et al.,
2004), and even with only 1 subject having scored an ALB score
of 3, there was a trend for the intensity of each of the addiction-
like behaviors to be proportional to the number of criteria met
(Fig. 3A–C).
3.3.1. Signaled non-availability
Responding during SNA was analyzed using a univariate test as
a function of ALB score (0, 1, 2, 3) (trial 24). The results showed that
SNA responding increased as a function of increasing ALB scores,
F(3,27) = 3.77, p < 0.05 (Fig. 3A).
3.3.2. Breakpoint
Similarly, breakpoint during the PR challenge was analyzed
using a univariate test varying the ALB score. The ALB score (0, 1, 2,
or 3) did not significantly predict breakpoint, F(3,27) = 2.88, p > 0.05
(Fig. 3B).
3.3.3. Reinstatement
Relapse to seeking behavior in the 1 h reinstatement test
was analyzed using a univariate test varying ALB score. Infusion
attempts during the reinstatement test significantly increased with
a greater ALB score, F(3,27) = 3.57, p < 0.05 (Fig. 3C).
0 1 2 3
0
1
2
3
4
5
6
7
8
9
10
11
InfusionsAttempts
0 1 2 3
0
20
40
60
80
100
120
140
CB
skciLANS
A
0 1 2 3
0
10
20
30
40
50
60
70
80
tniopkaerBRP
Small Large
0
20
40
60
80
100
latoTfotnecreP
0Criteria
1Criterion
2Criteria
3Criteria
D
Fig. 3. (A–C) Rats testing in the top third of an addiction-like criterion scored a
point, for a total addiction-like behavior score of either zero (n = 11), one (n = 11), two
(n = 8), or three (n = 1). (A) Mean (±SEM) number of SNA responses on terminal trail
24 as a function of ALB score 0, 1, 2, or 3. (B) Mean (±SEM) PR breakpoint responding
as a function of ALB score 0, 1, 2, or 3. (C) Mean (±SEM) infusion attempts/1 h as a
function of ALB score 0, 1, 2, or 3. (D) Percent of small and large suppressor rats
scoring an ALB of 0, 1, 2, or 3. The one rat scoring a 3 was a large suppressor.
3.3.4. Suppressor group and ALB
The percentage of small and large suppressors scoring in each
addiction-like behavior range is shown in Fig. 3D. The one rat scor-
ing a three was a large suppressor. In the small suppressor group,
rats with a score of 2 (n = 2) or 3 (n = 0) made up only 15% of small
suppressors, while 40% of the large suppressors had a score of 2 or
3 (n = 6 and n = 1).
3.4. Western analysis
We have chosen three proteins to analyze for potential expres-
sion changes that may be related to drug-induced suppression of
6. 66 C.B. Jenney et al. / Brain Research Bulletin 123 (2016) 61–70
Smallest Largest
0
20
40
60
80
100
latoTfotnecreP
0Critera
1Criterion
2Criteria
3Criteria
Fig. 4. The percent of rats scoring a 0, 1, 2, or 3 on the ALB score for the 5 Smallest
and 5 Largest suppressors.
intake of a natural reward and ALBs in rats: WLS (Fig. 5), -catenin
(Fig. 6), and NCS-1 (Fig. 7). Western blots were performed on lysates
from PFC, NAc, hippocampus, and VTA. Proteins were then ana-
lyzed for differences based on the animal’s heroin exposure (saline
vs. heroin), saccharin cue suppression of intake (saline vs. small
suppressors vs. large suppressors), and ALBs (saline vs. ALB score
of 0, 1, 2, or 3). When examining the protein data for all rats, no
significant differences were found in any of the proteins in any of
the brain regions between large and small suppressors overall. To
obtain a better assessment of possible differences between small
and large suppressing rats, protein expression data were then ana-
lyzed across all saline rats (n = 11), the 5 largest suppressors (i.e.
those rats that drank the least saccharin on the third taste-drug
pairing), and the five smallest suppressors (i.e. those rats that drank
the most saccharin on the third taste-drug pairing). The five small-
est suppressors (Fig. 4) had addiction-like behavior scores of 0, 0, 0,
1, and 2, and the five largest suppressors had addiction-like behav-
ior scores of 1, 1, 2, 2, and 3. Mean (±SEM) responses on each of
the three measures is shown for the 5 smallest and the 5 largest
suppressors in Table 1.
3.4.1. WLS expression
Previous studies by our laboratory and others have suggested
that WLS expression decreases with opioid use in the brains of rats,
mice, and zebrafish (Herrero-Turrion et al., 2014; Petko et al., 2013;
Tacelosky et al., in press). Recently, using a similar intermittent
access model as that used in this study (albeit without saccharin
suppression training), Tacelosky et al. (in press) found a significant
correlation such that lower levels of WLS expression in the PFC
were associated with increasing addiction-like behavior scores for
heroin in rats. In the current study, when looking at all of the exper-
imental subjects tested, we did not observe a similar decrease in
WLS expression with increasing addiction score (Fig. 5B). However,
because only one animal received an addiction score of 3, no sta-
tistical inferences can be made for this category. It is worth noting
Fig. 5. WLS protein expression in heroin self-administering rats in the prefrontal cortex (PFC), hippocampus (HC), ventral tegmental area (VTA), and nucleus accumbens
(NAc). Bar graphs represent normalized band intensities across three Western blots for individual rats averaged within each behavioral category. (A). Normalized WLS
expression (±SEM) for saline animals (n = 7), the largest saccharin suppressors (n = 5), and the smallest saccharin suppressors (n = 5.) (B). Normalized WLS expression (±SEM)
for the saline animals (n = 7) and subjects with an ALB score of 0 (n = 11), 1 (n = 9), 2 (n = 10), and 3 (n = 1) *p < 0.05 and **p < 0.01.
7. C.B. Jenney et al. / Brain Research Bulletin 123 (2016) 61–70 67
Fig. 6. -catenin protein expression in heroin self-administering rats in the medial prefrontal cortex (PFC), hippocampus (HC), ventral tegmental area (VTA), and nucleus
accumbens (NAc). Bar graphs represent normalized band intensities across three Western blots for individual rats averaged within behavioral categories. (A) Normalized
-catenin expression (±SEM) for saline animals (n = 7) and heroin self-administering animals (n = 31). (B) Normalized -catenin expression (±SEM) for saline animals (n = 7),
the largest saccharin suppressors (n = 5), and the smallest saccharin suppressors (n = 5) (C). Normalized -catenin expression (+/− SEM) for saline animals (n=7) and ALB
scores of 0 (n = 11), 1 (n = 9), 2 (n = 10), and 3 (n = 1). *p < 0.05.
that this individual rat actually displayed higher WLS expression in
the PFC, Hippocampus, NAc, and VTA compared to saline animals
and those scoring 0, 1, or 2.
In terms of saccharin suppression, there was a trend in the PFC
and hippocampus for a decrease in WLS expression in the smallest
saccharin suppressor group and an increase for rats in the largest
saccharin suppressor group as compared to the saline controls
(Fig. 5A). Significant changes in WLS expression, however, were
only reached in the PFC for a decrease in the smallest suppressors
vs. saline animals (p = 0.03) and, in the hippocampus, an increase
in the largest suppressors vs. saline (p = 0.007) and vs. the smallest
suppressors (p = 0.007). Finally, as in our previous study (Tacelosky
et al., in press), no differences in WLS expression were observed
between saline animals and those receiving heroin, overall (graphs
not shown), indicating that heroin exposure, alone, did not alter
WLS expression. Because WLS is essential for Wnt secretion, we
next chose to look at a downstream component of the Wnt path-
way to determine whether Wnt signaling was altered in the brains
of rats displaying ALB for heroin.
3.4.2. ˇ-catenin expression
-catenin is a downstream effector of the Wnt signaling path-
way. Upon Wnt activation of Frizzled receptors on Wnt receiving
cells, the -catenin protein becomes stabilized and is able to enter
8. 68 C.B. Jenney et al. / Brain Research Bulletin 123 (2016) 61–70
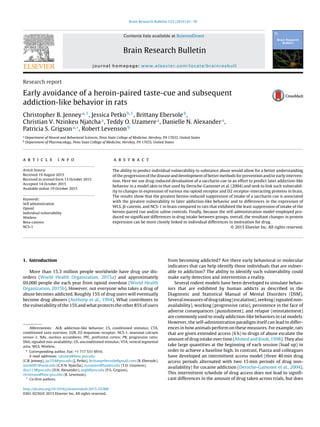
Fig. 7. NCS-1 protein expression in heroin self-administering rats in the prefrontal cortex (PFC), hippocampus (HC), ventral tegmental area (VTA) and nucleus accumbens
(NAc). Bar graphs represent normalized band intensities across three Western blots for each individual rat averaged within behavioral categories. (A) Normalized NCS-1
(±SEM) expression for saline animals (n = 7), largest saccharin suppressors (n = 5), and smallest saccharin suppressors (n = 5) (B). Normalized NCS-1 expression (±SEM) for
into saline animals (n = 7) and ALB scores of 0 (n = 11), 1 (n = 9), 2 (n = 10), and 3 (n = 1). *p < 0.05 and **p < 0.01.
the nucleus where it exerts its effects on the TCF/LEF transcription
factor. Changes in -catenin expression that correlate with ALBs
could indicate a change in Wnt signaling, which may or may not
be dependent on altered WLS function or expression. Interestingly,
-catenin is the only protein in this study that showed a significant
change in expression between drug and no drug groups (Fig. 6A).
In the hippocampus, -catenin levels were significantly increased
in self-administering rats compared to saline controls (p = 0.049).
Upon further division of the heroin self-administering animals into
different behavioral categories, no significant differences in hip-
pocampal -catenin expression were found between largest and
smallest suppressors (Fig. 6B) and limited differences were found in
the hippocampus and VTA as a function of the ALB scores (Fig. 6C).
This pattern of data provides further indication that this effect is
due to heroin exposure rather than to individual vulnerability for
ALB. Significant changes in -catenin expression were seen in the
PFC between the smallest and largest suppressors and in the hip-
pocampus between the saline group and the smallest suppressors
(Fig. 6B).
3.4.3. NCS-1 expression
We analyzed the expression of NCS-1, a D2 dopamine receptor
(D2R) interacting protein that prevents GRK2 induced internaliza-
tion and desensitization of the D2R (Kabbani et al., 2002). Changes
in NCS-1 expression might indicate altered stability of D2R local-
ization and signaling at the plasma membrane. Expression of NCS-1
was highly variable between individuals in comparison to the other
proteins analyzed (Fig. 7). No significant changes in expression
were detected when analyzing effects of drug administration (i.e.,
saline vs. heroin animals). However, in terms of saccharin suppres-
sion, a similar pattern of alterations in NCS-1 expression levels
was observed in the PFC as was seen for WLS and -catenin. In
the PFC, NCS-1 was decreased in the smallest saccharin suppres-
sors (p = 0.02) and increased in the largest saccharin suppressors
(p = 0.008) when compared to the saline controls. There also was a
significant difference between the smallest and the largest suppres-
sors (p = 0.003). Altogether, the expression data for these proteins
suggest that the PFC and hippocampus are areas where altered Wnt
signaling or D2R desensitization may affect addiction vulnerability
but perhaps not severity.
4. Discussion
4.1. Early suppression of intake of the taste cue and
addiction-like behavior
Rats avoided intake of a saccharin cue when paired with the
opportunity to self-administer heroin in the 6 h extended access
paradigm of Phase I. Individual differences were immediately evi-
dent whereby some rats greatly avoided the saccharin cue (the
large suppressors), while others (the small suppressors) did not.
Even so, conditioned avoidance of the drug-paired cue occurred
immediately for all rats following a single saccharin-heroin pairing,
although the effect was greater in the large suppressors.
At this point, early in training, drug intake was identical between
the small and the large suppressors. Drug-taking continued to be
9. C.B. Jenney et al. / Brain Research Bulletin 123 (2016) 61–70 69
equal for the small and the large suppressor rats when switched in
Phase II to the intermittent access paradigm. There was a tendency
for the number of infusions per 2 h to increase slightly across tri-
als 1–24, overall, but this trend was not significant. Thus, unlike
the extended access model where escalation is the norm (Imperio
and Grigson, 2015; Koob and Kreek, 2007), rats failed to evidence
escalation of drug self-administration across trials here, as is typ-
ical for this paradigm (Deroche-Gamonet et al., 2004; Puhl et al.,
2011; Tacelosky et al., in press).
Despite having taken about the same amount of drug, rats were
differentially positive for 0, 1, 2, or 3 addiction-like behaviors. Sur-
prisingly, out of 31 rats, only 1 rat (3.2%) scored a 3 and 8 rats
(25.8%) scored a 2. This is less than Deroche-Gamonet et al., 2004
reported with cocaine, less than we reported with cocaine (Puhl
et al., 2011), and less than we found using a similar regimen with
heroin (Tacelosky et al., in press). When examined as a function
of the small and large suppressors, the large suppressor group
accounted for the only subject to score a 3 and for 6/8 (75%) of the
subjects that scored a 2. That said, clear differences were not evi-
dent in the behaviors that served as the component parts of the ALB
score—i.e., as a group, small and large suppressor rats did not sig-
nificantly differ from one another in their SNA, PR, or reinstatement
behavior.
4.2. Protein expression and Aaddiction-like behavior
Brain changes also differed from earlier findings. Tacelosky et al.
(in press) found WLS levels to be reduced in the PFC and lower
levels of WLS were significantly correlated with greater addiction-
like behavior for heroin, in particular with a greater willingness
to work for drug on the PR schedule of reinforcement. Here, small
differences were found in WLS protein expression in brain, with
levels being lower in the PFC of the smallest suppressors, and higher
in the PFC of the largest suppressors vs. saline controls, respectively.
Differences also were found in -catenin levels in the HC and in the
PFC. Higher levels in the HC were associated with heroin vs. saline
self-administration; while higher levels in the PFC were associated
with being among the largest vs. the smallest suppressors. NCS-1
also was elevated in the PFC in the largest suppressors relative to
both the smallest suppressors and the saline controls.
There is no evidence from this study to suggest that WLS, -
catenin, or NCS-1 differ with severity of ALBs including SNA, PR,
and reinstatement measures (i.e., with scoring a 0, 1, 2, or a 3).
This is in contrast to other studies by our laboratory that demon-
strated decreased WLS levels with increasing ALB scores in the PFC
(Tacelosky et al., in press) in heroin self-administering rats and
decreased WLS expression in the midbrain and striatum of ani-
mals exposed to non-contingent morphine (Petko et al., 2013). The
paradigm used in the study by Tacelosky et al. (in press) utilized
both SNA and PR when calculating the addiction score, but instead
of using reinstatement (as done here), the third measure looked
at activity during time out periods (periods after heroin infusions
during which heroin cannot be delivered) as a measure of disinhi-
bition. However, one could argue that time out activity is a similar
measure to SNA that models drug seeking. Therefore, we chose to
incorporate a different measure of addictive behavior, reinstate-
ment, which models the human condition of drug relapse and was
found by Deroche-Gamonet et al. (2004) to correlate with each of
their measures of ALB.
Another difference between the present study and the Tacelosky
et al. (in press) study is the antibody used to detect WLS. The current
study utilized a non-commercial antibody that specifically detects
the mature (glycosylated) form of WLS that can be detected as a
cluster of bands at 50 kDA (Jin et al., 2010). In contrast, Tacelosky
et al. (in press) utilized a commercially available antibody that
detects a band of about 37 kDA, the size of the core WLS protein.
The mature form of WLS is stable and can be recycled to the Golgi
to perform multiple rounds of Wnt trafficking (Yang et al., 2008). It
would not be surprising if levels of immature WLS change in order
to maintain a constant amount of mature WLS in the cell. In addi-
tion, we have shown in cell culture that morphine can affect WLS
function through a direct interaction with the mu-opioid recep-
tor, the primary mediator of opioid reward. This effect is due to a
sequestering of WLS at the plasma membrane rather than a change
in WLS protein levels. Therefore, opioids can likely alter Wnt signal-
ing through mechanisms that do not require changes in WLS gene
expression. It was for this reason that we also examined -catenin,
a downstream effecter of Wnt signaling.
Changes in Wnt signaling within the brain should consequently
alter -catenin levels. Interestingly, as summarized, we observed
a significant increase in -catenin levels in the hippocampus of
those rats self-administering heroin compared to those who self-
administered saline, hinting at an increase in Wnt signaling in this
brain region. It would be interesting to determine whether tran-
script levels of -catenin are changed in the hippocampus of heroin
self-administering rats to assess whether this increase is due to a
change in gene expression or protein stability. It is of note that
the changes in WLS and -catenin protein levels in the PFC of the
largest and smallest saccharin suppressors were very similar to one
another. One could argue, therefore, that changes in Wnt signaling,
caused by alterations in functional levels of WLS, similarly affect -
catenin levels in Wnt receiving cells. That said, unlike WLS, levels of
-catenin in the PFC were higher in the largest suppressors vs. the
smallest suppressors. Again, assessing mRNA levels for -catenin
could potentially support or refute this hypothesis.
Also, as described, in this study NCS-1 expression (like WLS and
-catenin) in the PFC was significantly decreased in the small-
est saccharin suppressors and increased in the largest saccharin
suppressors compared to the saline controls. It is known that,
NCS-1 blocks D2R phosphorylation and internalization (Kabbani
et al., 2002). The D2R is considered the major mediator of reward-
associated behaviors not only in the NAc but also in the PFC
(Shumay et al., 2012; Volkow et al., 2013). Tacelosky et al. (in press)
have observed decreases in D2R expression in the PFC of heroin self-
administering rats. It is tempting to speculate that an increase in
NCS-1 in the largest suppressing animals boosts signaling through
the reduced number of D2Rs in the PFC of these animals leading to
their vulnerability to ALB.
4.3. Protective effects of sweet cue
Another possible explanation for the apparent reduction in ALB
in this study relates to the potential protective effects of having had
prior experience with the sweet cue. Sweets can be a highly pro-
tective form of enrichment. Of course, environmental enrichment is
very protective in both cocaine (Puhl et al., 2012) and heroin (Impe-
rio et al., in preparation) self-administering rats. Regarding a sweet,
in a microdialysis study, we found that presentation of the saccha-
rin cue before a morphine injection fully blunted the dopamine
response to morphine (Grigson and Hajnal, 2007). The availability
of a sweet cue also reverses the trend whereby female rats gen-
erally take more drug than male rats (Cason and Grigson, 2013).
Indeed, with the taste cue, female rats actually take less cocaine
than male rats. Ahmed finds that the concurrent availability of a
sweet can completely prevent cocaine (Lenoir et al., 2007) and
heroin (Madsen and Ahmed, 2015) self-administration in a large
portion of rats. Additionally, Ahmed finds that the protective effect
of a sweet over heroin increases with shorter access periods such
as that used in the present study (Lenoir et al., 2013). So, the avail-
ability of the sweet cue, along with the limited time of daily access,
may have contributed to the lack of animals exhibiting an addic-
tion score of 3 (the percent of 3s in Tacelosky et al. (in press) was
10. 70 C.B. Jenney et al. / Brain Research Bulletin 123 (2016) 61–70
nearly 12% vs. 3% here). While there are alternative explanations,
prior exposure to the sweet cue also may have contributed to the
failure to find reduced WLS expression in the PFC with increasing
addiction-like behavior. Future studies must test the merits of this
hypothesis.
5. Conclusions
It would be highly advantageous to be able to predict indi-
vidual vulnerability to substance use disorder. This is a primary
goal of addiction research. Rats quickly avoid intake of an other-
wise palatable saccharin cue when paired with a drug of abuse
and greater avoidance is associated with greater drug-taking. As
such, early avoidance of the cue potentially can be used to predict
later vulnerability to drug. In accordance, here we tested whether
early avoidance of a heroin-paired saccharin cue would predict later
addiction-like behavior using a variation of the intermittent access
model (Deroche-Gamonet et al., 2004). The results found somewhat
less robust addiction-like behavior than expected and, while there
was a relationship between avoidance of the drug-paired saccharin
cue and addiction-like behavior, the relationship was evident only
when looking at the extreme small and large suppressors. Avoid-
ance of the heroin-paired saccharin cue also was not associated
with a reduction in WLS, as previously found (Tacelosky et al., in
press), but it was associated with an elevation in both -catenin
and NCS-1 in the PFC. The reduction in ALB and the failure to find
reduced levels of WLS in the PFC in high ALB rats are not likely due
to small differences in the behavioral methodology used here vs.
other papers (e.g., Deroche-Gamonet et al., 2004; Tacelosky et al.,
in press), but it may relate to the use of a different antibody for
WLS or to the fact that the rats in this study had prior exposure to
a sweet, which can be highly protective (Cason and Grigson, 2013;
Freet et al., 2009; Grigson and Hajnal, 2007; Lenoir et al., 2013).
Future studies will test whether these proteins differ early in train-
ing, prior to differences in drug exposure, and whether ALB can be
reduced by relatively brief prior exposure to a sweet. Such plas-
ticity, albeit in the opposite direction, has been evidenced before
when ALB was greatly augmented in rats with a history of having
binged on fat (Puhl et al., 2011).
Acknowledgements
Support for this research was provided by NIH grant DA009815
(PSG), NIH grant DA035608 (RL), and by a grant from the Pennsyl-
vania Department of Health, Commonwealth Universal Research
Enhancements SAP#4100055576 (PSG and RL). The Department
specifically disclaims responsibility for any analyses, interpreta-
tions or conclusions.
References
Ahmed, S.H., Koob, G.F., 1998. Transition from moderate to excessive drug intake:
change in hedonic set point. Science 282, 298–300.
American Psychiatric Association, A.P.A.T.F.o.D.-IV, 2000. Diagnostic and Statistical
Manual of Mental Disorders: DSM-IV-TR. American Psychiatric Association,
Washington, DC, ISBN 9780125476126.
Anthony, J.C., Warner, L.A., Kessler, R.C., 1994. Comparative epidemiology of
dependence on tobacco, alcohol, controlled substances, and inhalants: basic
findings from the National Comorbidity Survey. Exp. Clin. Psychopharmacol. 2,
25.
Cason, A.M., Grigson, P.S., 2013. Prior access to a sweet is more protective against
cocaine self-administration in female rats than in male rats. Physiol. Behav.
112–113, 96–103.
Deroche-Gamonet, V., Belin, D., Piazza, P.V., 2004. Evidence for addiction-like
behavior in the rat. Science 305, 1014–1017.
Edwards, S., Koob, G.F., 2013. Escalation of drug self-administration as a hallmark
of persistent addiction liability. Behav. Pharmacol. 24, 356–362.
Freet, C.S., et al., 2009. Overexpression of DeltaFosB is associated with attenuated
cocaine-induced suppression of saccharin intake in mice. Behav. Neurosci. 123,
397–407.
Grigson, P.S., Twining, R.C., 2002. Cocaine-induced suppression of saccharin intake:
a model of drug-induced devaluation of natural rewards. Behav. Neurosci. 116,
321–333.
Grigson, P.S., Hajnal, A., 2007. Once is too much: conditioned changes in
accumbens dopamine following a single saccharin–morphine pairing. Behav.
Neurosci. 121, 1234–1242.
Herrero-Turrion, M.J., et al., 2014. Whole-genome expression profile in zebrafish
embryos after chronic exposure to morphine: identification of new genes
associated with neuronal function and mu opioid receptor expression. BMC
Genomics 15, 874.
Imperio, C.G., Grigson, P.S., 2015. Greater avoidance of a heroin-paired taste cue is
associated with greater escalation of heroin self-administration in rats. Behav.
Neurosci. 129, 380–388.
Jin, J., et al., 2010. Interaction of the mu-opioid receptor with GPR177 (Wntless)
inhibits Wnt secretion: potential implications for opioid dependence. BMC
Neurosci. 11, 33.
Kabbani, N., et al., 2002. Interaction with neuronal calcium sensor NCS-1 mediates
desensitization of the D2 dopamine receptor. J. Neurosci. 22, 8476–8486.
Koob, G., Kreek, M.J., 2007. Stress, dysregulation of drug reward pathways, and the
transition to drug dependence. Am. J. Psychiatry 164, 1149–1159.
Kuntz, K.L., et al., 2008. Heroin self-administration: II. CNS gene expression
following withdrawal and cue-induced drug-seeking behavior. Pharmacol.
Biochem. Behav. 90, 349–356.
Lenoir, M., et al., 2007. Intense sweetness surpasses cocaine reward. PLoS One 2,
e698.
Lenoir, M., et al., 2013. Extended heroin access increases heroin choices over a
potent nondrug alternative. Neuropsychopharmacology 38, 1209–1220.
Madsen, H.B., Ahmed, S.H., 2015. Drug versus sweet reward: greater attraction to
and preference for sweet versus drug cues. Addict. Biol. 20, 433–444.
Paxinos, G., Watson, C., 2007. The Rat Brain in Stereotaxic Coordinates. Academic
Press/Elsevier, Amsterdam, Boston.
Petko, J., et al., 2013. MOR is not enough: identification of novel mu-opioid
receptor interacting proteins using traditional and modified membrane yeast
two-hybrid screens. PLoS One 8, e67608.
Puhl, M.D., et al., 2011. A history of bingeing on fat enhances cocaine seeking and
taking. Behav. Neurosci. 125, 930–942.
Puhl, M.D., et al., 2012. Environmental enrichment protects against the acquisition
of cocaine self-administration in adult male rats, but does not eliminate
avoidance of a drug-associated saccharin cue. Behav. Pharmacol. 23, 43–53.
Shumay, E., et al., 2012. Repeat variation in the human PER2 gene as a new genetic
marker associated with cocaine addiction and brain dopamine D2 receptor
availability. Transl. Psychiatry 2, e86.
Tacelosky, D.M., et al., in press. Low expression of D2R and Wntless correlates with
high motivation for heroin. Behav. Neurosci.
Volkow, N.D., et al., 2013. Predominance of D2 receptors in mediating dopamine’s
effects in brain metabolism: effects of alcoholism. J. Neurosci. 33, 4527–4535.
Wise, R.A., Yokel, R.A., Dewit, H., 1976. Both Positive reinforcement and
conditioned aversion from amphetamine and from apomorphine in rats.
Science 191, 1273–1275.
World Health Organization, 2015. Facts and figures. Retrieved October 23, 2015
from www.who.int/substance abuse/facts/en/.
World Health Organization, 2015. Information sheet on opioid overdose. Retrieved
October 23, 2015 from www.who.int/substance abuse/information-sheet/en/.
Yang, P.T., et al., 2008. Wnt signaling requires retromer-dependent recycling of
MIG-14/Wntless in Wnt-producing cells. Dev. Cell 14, 140–147.