1. In 2009, the City of Chicago led the nation in homicides, beating out New York with only
one third of the population. Desperate to improve, the Chicago Police Department (CPD)
turned to funds available through the National Institute of Justice and secured two million
dollars to pursue experimental methods for integrating technology. In the years since, CPD
has fully embraced algorithmic analysis as a means of informing policing decisions. Chief
among these are predictive capabilities that suggest likely crime hot spots or potential
criminals. The nature of this problem is nontrivial because there exist significant
differences in crime rates among neighborhoods of the city, and the distribution of the
crime rate also depends on the crime types.
Our team is interested in predicting crime rates in various locations in Chicago, as well as
optimizing the distribution of the police force for future crime prevention.
Crime data from Chicago police department’s reporting system from 2001 to 2015
Fit Parameters
Optimize Allocation of Police
Select subset: narcotics data
Motivation
Methods and Framework
Data Exploration
Crime Geometry Prediction and Police Force Optimization in Chicago
Tian Lan, Arjun Sanghvi, Yaxiong (Jason) Cai
tianlan@g.harvard.edu, asanghvi@g.harvard.edu, yaxiongcai@g.harvard.edu
AM 207: Stochastic Optimization Ÿ Spring 2015
Optimal Allocation of Police Force
Bayesian Model Analysis
Conclusions
Define Bayesian Model
Parameter Fitting
MCMC Nelder-Mead
Expectation Maximization
for Gaussian Mixture Model
K-Means
• Crime type, time, and location are publicly available for 5.5 million crimes in
the City of Chicago from 2001 to last week (continuously updated)
• Out of 33 different crime types, narcotics crimes exhibited particularly
interesting clustering characteristics
• Note that the shape of the distributions looks approximately like a mixture of
Gaussians
• We refer to the locations of the modes as northwest (NW) and southeast (SE)
• Given limited computational resources, we randomly selected 5000 samples of
narcotics crimes in 2013 for this analysis
We propose a Bayesian model for formalizing the probability distribution of narcotics crimes.
• We tried two methods to fit the model parameters:
1. Markov Chain Monte Carlo (MCMC)
2. Nelder-Mead Optimization
1. Markov Chain Monte Carlo (MCMC)
• Metropolis algorithm to sample 11 parameters from the posterior
distribution
• Proposal function: normal distribution with tuned step sizes
• Component-wise update
• Burn-in of 200 samples and a thinning factor of 15
• Assessment of convergence
• Calculated each parameter as the mean of its trace
• Parameters were then used to draw 5000 samples from the posterior distribution
• Comparison of the distribution of true longitude and latitude, the distributions from the
posterior using the initial parameter values, and the distributions from the posterior
using the parameters found by MCMC
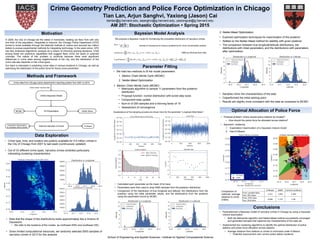
2. Nelder-Mead Optimization
• Explored optimization techniques for maximization of the posterior
• Settled on the Nelder-Mead method for stability with given posterior
• The comparison between true longitude/latitude distributions, the
distributions with initial parameters, and the distributions with parameters
after optimization:
• Samples mimic the characteristics of the data
• Outperformed the initial starting point
• Results are slightly more consistent with the data as compared to MCMC
Prior =
1
∑NW ∑SE
Likelihood = wN xi | µNW ,∑NW( )+ (1− w)N xi | µSE ,∑SE( )
i=1
N
∏
Inverse of covariance to induce a preference for more concentrated clusters
GMM as informed from data
Visualizations of the sampling process are shown here for the parameter “Longitude West Mean”:
• Parameterized a Bayesian model of narcotics crimes in Chicago by using a Gaussian
mixture assumption
• Both the Metropolis algorithm and Nelder-Mead method successfully converged
and generated samples that captured key characteristics of the data set
• Implemented two clustering algorithms to identify the optimal distribution of police
stations and police force allocation across stations
• Average distance from stations to crimes is minimized under K-Means
• Potential improvement over current police station locations
• Practical problem: where should police stations be located?
• How should the police force be allocated across stations?
• Approach: clustering
1. Expectation maximization of a Gaussian mixture model
2. Hard K-Means
Log Posterior ∝ ln wN xi | µNW ,∑NW( )+ (1− w)N xi | µSE ,∑SE( )( )
i=1
N
∑ − ln ∑NW( )− ln ∑SE( )
K-‐Means
GMM
Current
Loca1ons
Train:
sampled
data
Test:
2013
data
1.311
1.656
1.449
Train:
2013
data
Test:
2014
data
0.966
1.173
1.38
Comparison of
methods: average
distance to crime
(miles)
K-Means Optimized Decision Boundary
School of Engineering and Applied Sciences • Institute for Applied Computational Science"