
Recommended
More Related Content
What's hot
What's hot (20)
Similar to Soc 2113 ch 14 2017
Similar to Soc 2113 ch 14 2017 (20)
More from WendyScott34
Recently uploaded
Recently uploaded (20)
Soc 2113 ch 14 2017
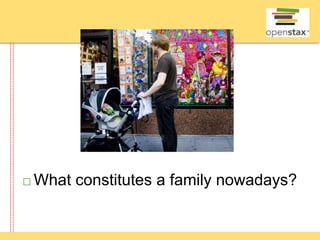
- 1. What constitutes a family nowadays?
- 2. Introduction to Marriage and Family Between 2006 and 2010, nearly half of heterosexual women (48%) ages 15-44 said they were not married to their spouse or partner when they first lived with them. That is up from 43% in 2002, and 34% in 1995. The number of unmarried couples has grown from fewer than 1 million in the 1970s to 8.1 million in 2011. Cohabitating, but unwed, couples account for 10% of all opposite sex couples in the US. The traditional US family structure is becoming less common.
- 3. WHAT IS MARRIAGE? WHAT IS FAMILY? Marriage is a legally recognized social contract between 2 people, traditionally based on a sexual relationship and implying permanence of the union. Sociologists are interested in the relationship between the institution of marriage and the institution of family because, historically, marriages are what create a family, and families are the most basic social unit upon which society is built. Both marriage and family create status roles that are sanctioned by society.
- 4. Family – is a socially recognized group (usually joined by blood, marriage, cohabitation, or adoption) that forms an emotional connection and serves as an economic unit of society. Traditionally, a family was a husband, wife, and 2 children. What constitutes a family is a prime area of debate in family sociology today.
- 5. Different types of families: A family of orientation refers to the family into which a person is born. A family of procreation describes one that is formed through marriage. Families are groups in which people come together to form a strong primary group connection and maintain emotional ties to one another over a long period of time.
- 6. The functionalist perspective views families as groups that perform vital roles for society Both internally (for the family itself) And externally (for society as a whole) Symbolic interactionism helps us to understand the subjective experience of belonging to a “family.”
- 7. Challenges Families Face One study stated that 99.8% of participants agreed that a husband, wife, and children constitute a family. 92% stated that a husband and a wife without children are a family. 83% stated that unmarried couples with children 39.6% stated that unmarried couples without children 64% stated that gay male couples with children 33% stated that gay male couples without children
- 8. 60% of responders in this study agreed that if you consider yourself a family, then you are one. The US Census Bureau (the national government) defines a family as a group of 2 people or more (one of whom is the householder) related by birth, marriage, or adoption residing together.
- 9. In a 2010 survey, 76% adults stated that family is “the most important” element of their life. Only 1% said it was “not important.” 45% stated that their family is at least as close or closer (40%) than the family with which they grew up.
- 10. Many religions believe that marriage can only exist between a man and a woman. Social liberals and progressives believe that marriage can exist between 2 consenting adults—be they man or woman, or a woman and a woman—and that it would be discriminatory to deny such a couple the civil, social, and economic benefits of marriage.
- 11. Marriage Patterns Cohabitation is when a couple shares a residence but not a marriage. Single parenting and cohabitation are becoming more acceptable, and people may be less motivated to get married. 39% answered “yes” when asked if marriages is becoming obsolete.
- 12. Monogamy: when someone is married to only 1 person at a time. Polygamy: being married to more than 1 person at a time. Accepted in 78% of cultures around the world North Africa and East Asia have the most Polygyny: a man being married to more than one woman at the same time. Polyandry: when a woman is marrid to more than 1 man at the same time. Only occurs in about 1% of the world’s cultures.
- 13. While the majority of societies accept polygyny, fewer than 10% (and no more than 25-35%) of men in polygamous cultures have more than one wife. These husbands are often older, wealthy, high- status men. The average plural marriage involves no more than 3 wives.
- 14. In the US, polygamy is considered by most to be socially unacceptable and it is illegal. The act of entering into marriage while still married to another person is referred to as bigamy and is considered a felony in most states. It is estimated that there are about 37,5000 fundamentalist Mormons involved in polygamy in the US, Canada, and Mexico, and the number is decreasing.
- 15. US Muslims are an emerging group with an estimated 20,000 practicing polygamy. It only occurs in approximately 1% of the population though.
- 16. Joseph Smith, Jr., the founder of Mormonism, is said to have practiced polygamy.
- 17. Residency and Lines of Descent When considering one’s lineage, most people in the United States look to both their father’s and mother’s sides. Kinship is defined as one’s traceable ancestry and can be based on blood or marriage or adoption. The pattern of tracing kinship is called bilateral descent. Practiced through 60% of societies. Unilateral descent is the tracing of kinship through one parent only. It is practiced in 40% of the world’s societies.
- 18. 3 types of unilateral descent: Patrilineal – follows the father’s line only In rural China and India only males carry on the family surname. In the US, most children take their father’s last name Matrilineal –follows the mother’s side only Common in Native American societies (especially Crow and Cherokee) Ambilineal- follows either the father’s only or the mother’s side only, depending on the situation. Common in Southeast Asian countries
- 19. In many cultures, newly married couples move in with, or near to, family members. Patrilocal residence – the wife lives with or near her husband’s family of orientation. Thought to be disadvantageous to women because it makes them outsiders in the home and community & keeps them disconnected from their own families. Matrilocal residence – the husband lives with his wife’s blood relatives. The husband can feel disconnected and be labeled as an outsider. West Sumtra in Indonesia gives men little power in issues regarding the home or family.
- 20. STAGES OF FAMILY LIFE The set of predictable steps and patterns families experience over time is referred to as the family life cycle. Paul Glick asserted that most people will grow up, establish families, rear and launch their children, experience an “empty nest” period, and come to the end of their lives. Evelyn Duvall elaborated on the family life cycle by developing these classis stages of family.
- 21. STAGE THEORY STAG E FAMILY TYPE CHILDREN 1 MARRIAGE FAMILY CHILDRLESS 2 PROCREATION FAMILY CHILDREN AGES 0-2.5 3 PRESCHOOLER FAMILY CHILDREN AGES 2.5-6 4 SCHOOL-AGE FAMILY CHILDREN AGES 6-13 5 TEENAGE FAMILY CHILDREN AGES 13-20 6 LAUNCHING FAMILY CHILDREN BEGIN TO LEAVE HOME EMPTY NEST FAMILY EMPTY NEST; ADULT
- 22. Sociologists view each stage as having its own structure with different challenges, achievements, and accomplishments that transition the family from one stage to the next. As early stage theories have been criticized for generalizing family life and not accounting for differences in gender, ethnicity, culture, and lifestyle, less rigid models of the family life cycle have been developed.
- 23. One example is the family life course, which recognizes the events that occur in the lives of families but views them as parting terms of a fluid course rather than in consecutive stages. This type of model accounts for changes in family development and sheds lights on other shifts in the way family life is practiced.
- 24. VARIATIONS IN FAMILY LIFE A nuclear family refers to married parents and children as the nucleus, or core, of the group. In 2010 Census, only 66% of children under 17 years old live in a household with two married parents. This is a decrease from 77% in the 1980 Census. 3% of children live with 2 cohabitating parents (not married).
- 25. More than one quarter of U.S. children live in a single-parent household.
- 26. Single Parents Single parent households are on the rise. In 2010, 27% of children lived with a single parent only, up from 25% in 2008. Of that 27%, 23% live with their mother, and 3% live with their father. 10% of children living with their single mother and 20% of children living with their single father also live with the cohabitating partner of their parent.
- 27. Step-parents are an additional family element in two-parent homes. Among children living in 2-parent households, 9% live with a biological or adoptive parent and a stepparent. 70% of those children live with their biological mother and a stepfather. Older children (15-17) are less likely to live with 2 parents than adolescent children (6-14) or young children (0-5).
- 28. In 2010, 3 million children (4%) of all children lived with a guardian who was neither their biological or adoptive parent and a stepparent. Of these, 54% live with grandparents. 21% live with other relatives. 24% live with nonrelatives.
- 29. This family structure is referred to as the extended family, and may include aunts, uncles, and cousins living in the same home. Foster parents account for about ¼ of nonrelatives. 9% of all children live with a grandparent, and the grandparent maintains primary responsibility for the child. Usually due to parental drug use, incarceration, or abandonment.
- 30. Children living in homes with both parents grow up with more financial and educational advantages than those raised in single- parent homes. Parental marital status seems to be a significant indicator in the advancement in a child’s life. Children living with a divorced parent typically have more advantages than children living with a parent who never married.
- 31. This is particularly true of children who live with divorced fathers. 6 in 10 children living with only their mother live near or below the poverty level. Of those being raised by single mothers, 69% live in or near poverty compared to 45% for divorced mothers. Never-married parents are: Typically younger Have fewer years of schooling Have lower incomes
- 32. Percentage of Children in Single-Parent Families by Race and Hispanic Origin: 2008
- 33. Same-Sex couples The number of same-sex couples has grown significantly in the past decade. There are an estimated 594,000 same-sex couple households in the US, a 50% increase from 2000. The increase is due to: More coupling The growing acceptance of homosexuality Subsequent increase in willingness to report it
- 34. Same sex couples have an average age of 52, and an average household income of $91,558. Opposite sex couple households have an average age of 59, and an average household income of $95,075. 31% of same-sex couples are raising children. 73% of these children are biological children of only 1 of the parents. 21% are adopted only. 6% are a combination of biological and adoption. 43% of opposite couples are raising children.
- 35. Research reports that same-sex parents are as effective as opposite-sex parents. In one study, sociologists found no data to support the notion that opposite-sex parenting is any better than same-sex parenting. Children of lesbian couples, however, were shown to have slightly lower rates of behavioral problems and higher rates of self- esteem.
- 36. Staying Single A new option in the US is simply to stay single. In 2010, there were 99.6 million unmarried individuals over age 18 in the US, accounting for 44% of the total adult population. In 2010, never-married individuals in the 25-29 age bracket accounted for 62% of women and 48% of men, up from 11% and 19% in 1970. Larger cities like New York have the highest population of never-married individuals.
- 37. Women are under greater social pressure to marry than men. Single women are portrayed as unhappy “spinsters” or “old maids” who cannot find a man to marry them. Single men are portrayed as life-time bachelors who “haven’t found the right girl.” Women over 35 report feeling happy and secure and feel more independent and more prepared to live a large portion of their adult lives without a spouse or domestic partner than they did in the 1960s.
- 38. Asian individuals are the most likely to marry. African Americans are the least likely to marry. Religious people are more likely to marry than non-religious people. By the age of 40, being single is not a rejection of marriage. It is a lifestyle that does not include marriage. 20% of women and 14% of men will have never married by that age.
- 39. A study from Radford University indicated that bartenders are among the professions with the highest divorce rates (38.4 percent). Other traditionally low- wage industries (like restaurant service, custodial employment, and factory work) are also associated with higher divorce rates.
- 40. THEORETICAL PERSPECTIVES ON MARRIAGE AND FAMILY Functionalists uphold the notion that families are an important social institution and they play a key role in stabilizing society. Family members take on status roles in a marriage or family. The family and its members perform certain functions that facilitate the prosperity and development of society.
- 41. George Murdock determined that there are 4 universal residual functions of the family: Sexual The family offers a socially legitimate sexual outlet for adults. Reproductive A necessary part of ensuring the survival of society Educational The family trains the children for adult life by teaching them how to think and behave and follow social and cultural norms, values, beliefs, and attitudes.
- 42. Economic Gender roles and a division of labor leads to expressive and instrumental roles. Men tend to assume the instrumental roles in the family (work and financial support). Women tend to assume the expressive roles (physical care and emotional support of children). According to functionalists, the differentiation of the roles on the basis of sex ensures that families are well balanced and coordinated. When family members move outside of these roles, the family is thrown out of balance and must recalibrate in order to function properly.
- 43. Conflict theorists point out that US families have been defined as private entities, the consequence of which has been to leave family matters to only those within the family. They highlight the role of power in family life and contends that the family is often not a haven but rather an arena where power struggles can occur.
- 44. Researchers found that the person with most access to value resources held the most power. As money is the most valuable resource, men who worked in paid labor outside of the home held more power than women who worked inside the home. Conflict theorists find disputes over the division of household labor to be a common source of marital discord.
- 45. Household labor offers no wages, therefore, no power. Studies indicate that when men do more housework, women experience more satisfaction in their marriages, reducing the incidence of conflict. Conflict theorists tend to study areas of marriage and life that involve inequalities or discrepancies in power and authority, as they are reflective of the larger social structure.
- 46. Symbolic interactionists view the world in terms of symbols and the meanings assigned to them. The family itself is a symbol. SI believe that the family is a social construct that is subject to the ebb and flow of social norms and ever-changing meanings. They also recognize how the family status roles of each member are socially constructed, playing an important part in how people perceive and interpret social behavior.
- 47. They also view the family as a group of role players or “actors” that come together to act out their parts in an effort to construct a family. These roles are up for interpretation. In the late 19th and early 20th centuries, a “good father” was one who worked hard to provide financial security for his children. Today, a “good father” is one who takes the time outside of work to promote his children’s emotional well-being, social skills, and intellectual growth.
- 48. CHALLENGES FAMILIES FACE DIVORCE AND REMARRIAGE In 1960, only 9.1 out of every 1,000 persons was divorced. In 1975, that number was 20.3. The number of divorced person peaked in 1980 at 22.6 out of 1,000. Currently, the number is similar to the 1975 number.
- 49. The decrease in divorce rates can be attributed to 2 probable factors: An increase in the age at which people get married An increased level of education among those who marry Both of which have been found to promote greater marital stability
- 50. Divorce and Marriage Rates: 1940- 2009
- 51. Some segments of the US population are more likely to divorce than others. Men and women in the Northeast have the lowest divorce rates at 7.2 and 7.5 per 1,000 people. The marriage rate is lower and first marriages tend to be delayed. The South has the highest rate of divorce at 10.2 for men and 11.1 for women. Because marriage rates are higher and marriage occurs at younger-than-average ages in this region.
- 52. Median Age at First Marriage
- 53. Divorce also varies by race. American Indian and Alaskan Natives report the highest percentages of currently divorced individuals (12.6%). Blacks have an average of 11.5% Whites average 10.8% Pacific Islanders average 8% Latinos average 7.8% Asians average is 4.9% In general, those who marry at a later age, have a college education have lower rates of divorce.
- 54. What causes divorce? Stress—especially financial stress Couples who enter marriage without a strong asset base (home, savings, retirement plan) are 70% more likely to be divorced after 3 years than are couples with at least $10,000 in assets. The addition of children Marriages enter their most stressful phase upon the birth of the first child. Married couples with twins or triplets are 17% more likely to divorce than single births.
- 55. There is a general decline in marital satisfaction over time. As people get older, they find that their values and life goals no longer match up with those of their spouse. Children of divorced parents are 40% more likely to divorce than children of married parents.
- 56. When these divorced parents remarry, the likelihood of their own divorce rises to 91%. This might result from being socialized to a mindset that broken marriage can be replaced rather than repaired. That sentiment is also reflected in the finding that when both partners of a married couple have been previously divorced, their marriage is 90% more likely to end in divorce.
- 57. People in a second marriage account for 19.3% of all married persons. Those who have been married three or more times account for 5.2% . 91% of remarriages occur after divorce; only 9% occur after death of a spouse.
- 58. Most men and women remarry within 5 years of a divorce. The median length for men is 3 years and 4.4 years for women. The majority of those who remarry are between the ages of 25-44. Whites are more likely to remarry than black Americans.
- 59. In a survey households formed by remarriage, 8% included only biological children of the remarried couple. Of the 49% of homes that include children 24% included only the woman’s biological children. 3% included only the man’s biological children. 9% included a combination of both spouse’s children.
- 60. Children of divorce and remarriage Research suggests that while marital conflict does not provide an ideal childrearing environment, going through a divorce can be damaging. Children are often confused and frightened by the threat to their family security. They often feel responsible for the divorce and attempt to bring their parents back together.
- 61. Only in high-conflict homes to children benefit from divorce. Studies also suggest that stress levels for children are not improved when a child acquired a stepfamily through marriage. Stepfamilies typically have a high level of interpersonal conflict.
- 62. Children’s ability to deal with a divorce may depend on their age. Most difficult for school-aged children Older teenagers are more likely to recognize the conflict that led to the divorce but may still feel fear, loneliness, guilt, and pressure to choose sides. Infants and preschool-age children may suffer the heaviest impact from the loss of routine that the marriage offered.
- 63. Boys who live or have joint arrangements with their fathers show less aggression than those who are raised by their mothers only. Girls who live with or have joint arrangements with their mothers tend to be more responsible and mature than those who are raised by their fathers only. Nearly ¾ of the children of parents who are divorced live in a household headed by their mother, leaving many boys without a father figure residing in the home.
- 64. VIOLENCE AND ABUSE Domestic violence is a significant problem in the US. It is often characterized as violence between household or family members, specifically spouses. Intimate partner violence is violence that occurs between individuals who maintain a romantic or sexual relationship.
- 65. Women are the primary victims of intimate partner violence. It is estimated that 1 in 4 women have experienced some form of IPV in her lifetime, compared to 1 in 7 men. IPV can include physical violence such as: Punching Kicking Threats Sexual abuse Emotional abuse
- 66. 57% of physical actions against women involve physical violence. 9% involve rate and physical violence. 14% involved physical violence and stalking 12% involved rape, physical violence, and staking 4% involved rape only.
- 67. 92% of physical acts against men are in the form of physical violence. Less than 1% involves rape alone or in combination. The rates of IPV for black women are higher than that for white women. Black women 4.6 per 1,000 persons White women 3.1 per 1,000 persons Native Americans and Alaskan Native are up to 11.1 per 1,000 persons.
- 68. IPV doubles for women in low-income disadvantaged areas. Women ages 20-24 are at the greatest risk of nonfatal abuse. Those who are separated report higher rates of abuse. Cohabiters are more likely than those who are married.
- 69. Even when confronted by police about abuse, 29% of victims denied that abuse occurred. 19% of their assailants were likely to admit to abuse. Victims cite varied reasons why they are reluctant to report abuse.
- 70. Reason Abuse is Unreported % Females % Males Considered a Private Matter 22 39 Fear of Retaliation 12 5 To Protect the Abuser 14 16 Belief that Police Won’t Do Anything 8 8
- 71. Nearly ½ (42%) involves alcohol or drug use—mainly because they lower inhibitions. Nearly all women who report serious domestic problems exhibit symptoms of major depression. Female victims of IPV: Are more likely to abuse alcohol or drugs Suffer from eating disorders Attempt suicide
- 72. In 2010, there were more than 3 million reports of child abuse involving an estimated 5.9 million children. Child abuse comes in several forms: Neglect (78.3%) Physical abuse (10.8%) Sexual abuse (7.6%) Psychological maltreatment (7.6%) Medical neglect (2.4%)
- 73. 81.1% of perpetrators are parents. 6.2% are other relatives. Infants (under one year old) were the most victimized population—20.6 per 1,000 infants. They are especially vulnerable to neglect because they are entirely dependent on parents for care.
- 74. Physical abuse of infants often takes the form of shaken-baby syndrome. A group of medical symptoms such as brain swelling and retinal hemorrhage resulting from forcefully shaking or impacting an infant’s head. Estimated at 1,400 babies die or suffer serious injury from being shaken each year. Caused by: Stress Poor economy Unemployment Dissatisfaction with parental life
- 75. Young parents are typically less capable of coping with stresses. Teenage mothers are more likely to abuse their children than older mothers. Children born to mothers who are 15 years old or younger are twice as likely to be abused or neglected by age 5 than children born to mothers ages 20-21.
- 76. Drug and alcohol abuse is a known contributor to child abuse. Children of substance abusers have a high risk of physical abuse 3 times greater than other kids, and neglect is 4 times as prevalent in these families. Other risk factors include: Social isolation Depression Low parental education A history of being mistreated as a child
- 77. The long-term effects of child abuse impact the physical, mental, and emotional well- being of a child. Injury, poor health, and mental instability occur at a high rate. 80% of abused children meet the criteria of one or more psychiatric disorders before the age of 21: Depression Anxiety Suicide behavior
- 78. Behavioral consequences will affect almost all of child abuse victims. They are 25% more likely, as adolescents, to suffer from difficulties like poor academic performance and teen pregnancy, or to engage in behaviors like drug abuse and general delinquency. They are also more likely to participate in risky sexual acts (increasing chances of getting an STD). Other risky behaviors include drug and alcohol abuse