
Recommended

Recommended
More Related Content
Similar to Top 10 Tech Brand from 2015 to 2020
Similar to Top 10 Tech Brand from 2015 to 2020 (20)
Recently uploaded
Recently uploaded (20)
Top 10 Tech Brand from 2015 to 2020
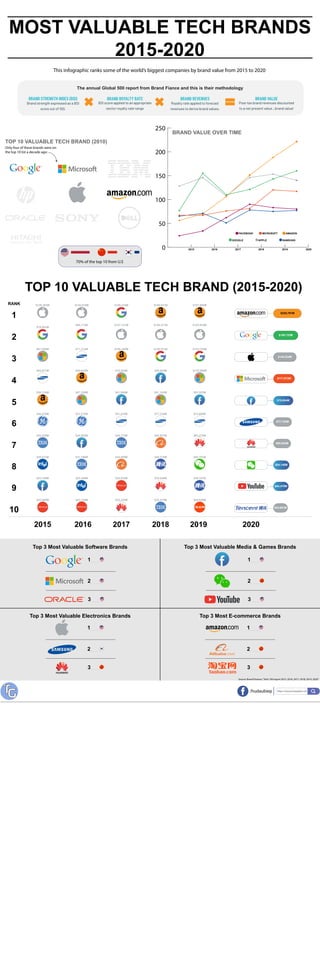
- 1. MOST VALUABLE TECH BRANDS 2015-2020 The annual Global 500 report from Brand Fiance and this is their methodology 0 50 100 150 200 250 TOP 10 VALUABLE TECH BRAND (2010) Only four of these brands were on the top 10 list a decade ago: BRAND VALUE OVER TIME TOP 10 VALUABLE TECH BRAND (2015-2020) 1 2 3 4 5 6 7 8 9 10 $128,303M $76,683M $67,060M $65,671M $56,124M $48,019M $35,428M $25,011M $24,180M $22,888M 2015 2016 2017 2018 2019 2020 $220,791M $159,722M $140,524M $117,072M $79,804M $77,793M $65,084M $54,146M $44,476M $44,091M $145,918M $88,173M $71,214M $69,642M $67,258M $37,216M $34,002M $31,786M $22,485M $22,136M $109,470M $107,141M $106,369M $76,265M $61,998M $51,416M $36,112M $34,859M $25,878M $25,230M $150,811M $146,311M $120,911M $89,684M $81,163M $77,744M $54,921M $40,774M $38,046M $32,478M $187,905M $153,634M $142,755M $119,595M $83,202M $74,909M $62,278M $50,707M $49,701M $46,628M RANK Top 3 Most Valuable Software Brands 3 1 2 Top 3 Most Valuable Electronics Brands 1 2 3 1 2 3 Top 3 Most Valuable Media & Games Brands 3 1 2 Top 3 Most E-commerce Brands FACEBOOK MICROSOFT AMAZON GOOGLE SAMSUNGAPPLE 2015 2016 2017 2018 2019 2020 70% of the top 10 from U.S This infographic ranks some of the world’s biggest companies by brand value from 2015 to 2020 Source: Brand Finance,“Tech 100 report 2015, 2016, 2017, 2018, 2019, 2020” /hudaubiep https://www.techgraphic.me TG