More Related Content
More from Anand Chokshi (20)
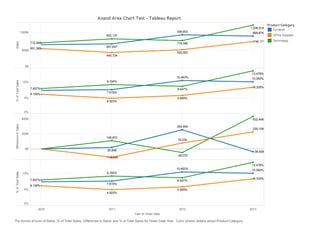
Anand Tableau Test Report 6
- 1. 2010 2011 2012 2013
YearofOrderDate
0K
500K
1000K
Sales
0%
5%
10%
%ofTotalSales
0K
200K
400K
DifferenceinSales
0%
5%
10%
%ofTotalSales
822,137
774,066
551,369
1,206,514
520,062
712,265 746,171
899,675
681,647
440,724
936,603
9.184%
8.647%
6.159%
13.478%
5.809%
7.957% 8.335%
10.050%
7.615%
4.923%
10.463%
109,872
79,339
20,948
432,448
254,955
-48,070
226,109
-36,928
-110,645
9.184%
8.647%
6.159%
13.478%
5.809%
7.957% 8.335%
10.050%
7.615%
4.923%
10.463%
AnandAreaChartTest-TableauReport
ProductCategory
Furniture
OfficeSupplies
Technology
Thetrendsofsum ofSales,% ofTotalSales,DifferenceinSalesand% ofTotalSalesforOrderDateYear.ColorshowsdetailsaboutProductCategory.