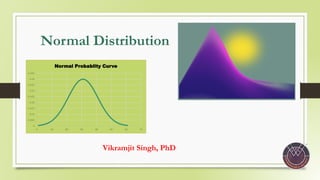
1.Normal Distribution@Dr. V. Singh.pdf
•
0 likes•45 views

This presentation talks about Normal Probability Curve. It also talks about its uses in solving problems. It explains its main properties. Lastly it also talks about skewness and kurtosis of the curve in reference to NPC.

Recommended
Recommended
More Related Content
More from Vikramjit Singh
More from Vikramjit Singh (20)
Recently uploaded
Recently uploaded (20)
1.Normal Distribution@Dr. V. Singh.pdf
- 1. Normal Distribution Vikramjit Singh, PhD 0 0.005 0.01 0.015 0.02 0.025 0.03 0.035 0.04 0.045 0 10 20 30 40 50 60 70 Normal Probablity Curve
- 2. © V. Singh
- 3. © V. Singh 0 0.005 0.01 0.015 0.02 0.025 0.03 0.035 0.04 0.045 0 10 20 30 40 50 60 70 Normal Probablity Curve -3σ -2σ -1σ 0 1σ 2σ 3σ 50% MEAN B 50% 68.26% A
- 4. © V. Singh 𝒚 = 𝑵 𝝈 𝟐𝝅 ⅇ − 𝒙𝟐 𝟐𝝈𝟐 The equation of Normal Probability Curve Here x - scores(expressed as deviations from the mean) laid off along the base line or X- axis. y – the height of the curve above X-axis or base line or the frequency of a given x value. N - Number of Participants/ Observations σ – standard deviation of the entire distribution Π – 3.1416 (ratio of circumference of a circle to its diameter) e – 2.7183 (base of the Napierian System of logarithms)
- 5. © V. Singh PROPERTIES /CHARACTERSTICS OF NORMAL PROBABLITY CURVE 1. Normal distribution curve was separately worked upon by Gauss and Laplace. They also named it as ‘curve of error’ where ‘error’ is used to denote the deviations from the mean or normal.
- 6. © V. Singh 0 0.005 0.01 0.015 0.02 0.025 0.03 0.035 0.04 0.045 0 10 20 30 40 50 60 70 Normal Probablity Curve 2. The height of the curve declines symmetrically in both the direction . PROPERTIES /CHARACTERSTICS OF NORMAL PROBABLITY CURVE
- 7. © V. Singh PROPERTIES /CHARACTERSTICS OF NORMAL PROBABLITY CURVE 3. The shape of this curve is bell shaped. The curve as it is visible here is symmetrical and bilateral from the centre as referenced from the line segment AB. Each of the 50 % of the cases of total 100% are towards the left and right of the line segment AB. 50 % 50 %
- 8. © V. Singh PROPERTIES /CHARACTERSTICS OF NORMAL PROBABLITY CURVE 4. The Mean, Mode and Median of the normal distribution curve coincides or falls at the same point. This point is represented by 0. This makes it clear that it has. Mean = 0 Median = 0 Mode = 0 (Unimodal) Mean =Median =Mode =0
- 9. © V. Singh 0 0.005 0.01 0.015 0.02 0.025 0.03 0.035 0.04 0.045 0 10 20 30 40 50 60 70 Normal Probablity Curve PROPERTIES /CHARACTERSTICS OF NORMAL PROBABLITY CURVE 5. The Points of Influx occur at point±1 Standard Déviation (± 1 σ). The height of the ordinates are same at both the influx points. -1σ 1σ
- 10. © V. Singh 0 0.005 0.01 0.015 0.02 0.025 0.03 0.035 0.04 0.045 0 10 20 30 40 50 60 70 Normal Probablity Curve + ∞ - ∞ PROPERTIES /CHARACTERSTICS OF NORMAL PROBABLITY CURVE 6 . The normal curve is Asymptotic to the X- Axis. The curve height continues to decrease on both the side but never touches the X- axis.
- 11. © V. Singh 0.3989 PROPERTIES /CHARACTERSTICS OF NORMAL PROBABLITY CURVE 7. The maximum ordinate occurs at the centre and height of this ordinate is 0.3989 unit. Ordinate at point ‘0’ from the formaula 𝒚𝟎 = 𝑵 𝝈 𝟐𝝅 ⅇ − 𝒙𝟐 𝟐𝝈𝟐 is 0.3989
- 12. © V. Singh PROPERTIES /CHARACTERSTICS OF NORMAL PROBABLITY CURVE 0 0.005 0.01 0.015 0.02 0.025 0.03 0.035 0.04 0.045 0 10 20 30 40 50 60 70 Normal Probablity Curve 8. As the curve never touches base line hence we start with the mean as starting point of the curve. Further SD are used as unit of measurement or deviation from the mean. The curve extends on both side -3 σ distance on the left to +3 σ on the right. -3σ -2σ -1σ 0 1σ 2σ 3σ
- 13. © V. Singh PROPERTIES /CHARACTERSTICS OF NORMAL PROBABLITY CURVE 9. The percentage of cases falling in Successive Standard Deviation in both the side of the Mean is fixed and are equal.
- 14. © V. Singh PROPERTIES /CHARACTERSTICS OF NORMAL PROBABLITY CURVE
- 15. © V. Singh PROPERTIES /CHARACTERSTICS OF NORMAL PROBABLITY CURVE 10. The scale of X- axis in normal curve is generalised by Z deviates. Z = 𝑋−𝑀 σ or when M = 0 , Z = 𝑿 σ
- 16. © V. Singh PROPERTIES /CHARACTERSTICS OF NORMAL PROBABLITY CURVE 0 0.005 0.01 0.015 0.02 0.025 0.03 0.035 0.04 0.045 0 10 20 30 40 50 60 70 Normal Probablity Curve 11. The curve is perfectly symmetrical in both the direction. In other way the Skewness of the curve is Zero.
- 17. © V. Singh 12. The normal curve is a smooth curve, not a histogram . It is moderately peaked. The kurtosis of the normal curve is 0.263. 0 0.005 0.01 0.015 0.02 0.025 0.03 0.035 0.04 0.045 0 10 20 30 40 50 60 70 Normal Probablity Curve PROPERTIES /CHARACTERSTICS OF NORMAL PROBABLITY CURVE
- 18. © V. Singh Skewness in Short Skewness refers to a distortion or asymmetry that deviates from the symmetrical bell curve, or normal distribution, in a set of data. If the curve is shifted to the left or to the right, it is said to be skewed. - Investopedia
- 19. © V. Singh Positive Skew Positive Skewed is that when the curve is tailed in the right side of the curve. Here Median and Mean is more than the Mode. Ex- When we have a hard test. Income Distribution.
- 20. © V. Singh Negative Skew Negative Skewed is that when the curve is tailed in the left side of the curve. Here Median and Mean is less than the Mode. Ex- Very Easy Test, Distribution of Age of Death
- 21. © V. Singh Kurtosis The Kurtosis of a distribution refers to its 'curvedness' or ' peakedness ' . The distributions may have the same mean and the same variance and may be equally skewed, but one of them may be more peaked than the other. A normal curve have a kurtosis value equal to 0.263
- 22. © V. Singh Leptokurtic, Platykurtic , Mesokurtic Normal Probablity Curve is called as Mesokurtic (Ku=0.263) , when the Kurtosis is greater than 0.263 then the curve is more peaked and is called as Leptokurtic. When the Kurtosis is lesser than 0.263 then the curve is less peaked or plateaued and is called as Platykurtic.
- 23. © V. Singh