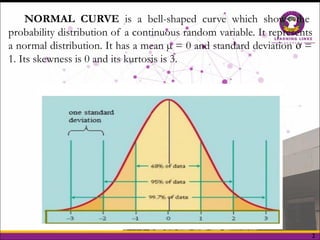
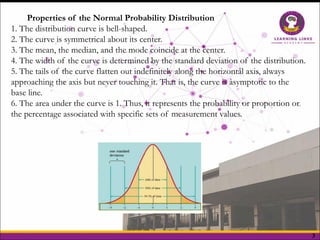
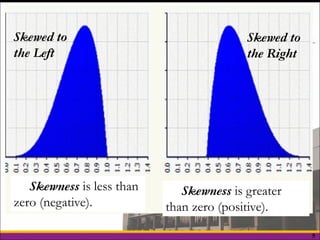
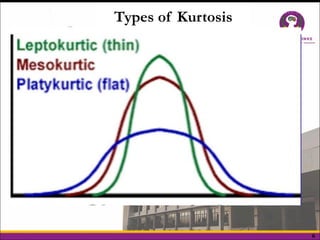
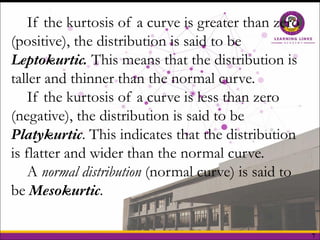
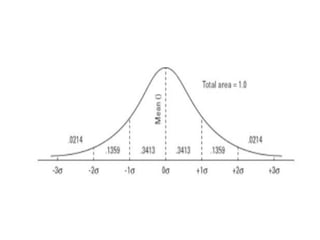
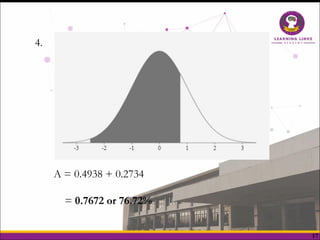
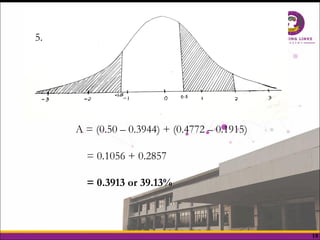
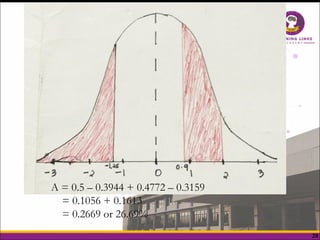
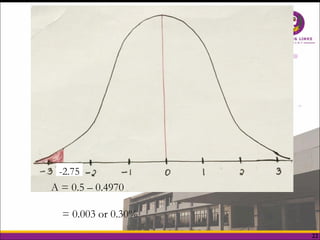
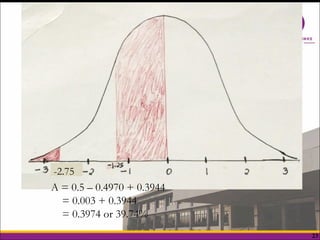
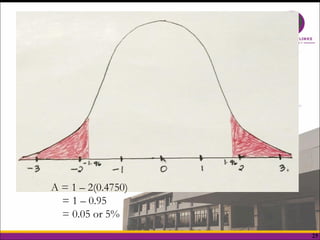
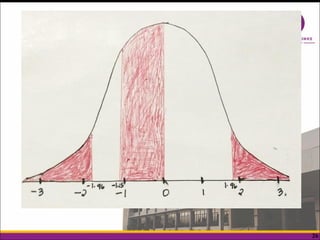
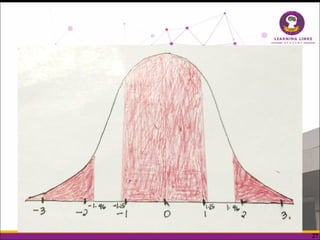
1
NORMAL
DISTRIBUTION
2
NORMAL CURVE is a bell-shaped curve which shows the
probability distribution of a continuous random variable. It represents
a normal distribution. It has a mean µ = 0 and standard deviation ơ =
1. Its skewness is 0 and its kurtosis is 3.
3
Properties of the Normal Probability Distribution
1. The distribution curve is bell-shaped.
2. The curve is symmetrical about its center.
3. The mean, the median, and the mode coincide at the center.
4. The width of the curve is determined by the standard deviation of the distribution.
5. The tails of the curve flatten out indefinitely along the horizontal axis, always
approaching the axis but never touching it. That is, the curve is asymptotic to the
base line.
6. The area under the curve is 1. Thus, it represents the probability or proportion or
the percentage associated with specific sets of measurement values.
4
Skewness talks about the degree of
symmetry of a curve. It is asymmetry in a
statistical distribution, in which the curve
appears distorted or skewed either to the left
or to the right. It can be quantified to define
the extent to which a distribution differs from
a normal distribution.
Kurtosis, on the other hand, talks about the
degree of peakedness of a curve. It refers to
the pointedness or flatness of a peak in the
distribution curve.
5
Skewed to
the Left
Skewed to
the Right
Skewness is less than
zero (negative).
Skewness is greater
than zero (positive).
6
Types of Kurtosis
7
If the kurtosis of a curve is greater than zero
(positive), the distribution is said to be
Leptokurtic. This means that the distribution is
taller and thinner than the normal curve.
If the kurtosis of a curve is less than zero
(negative), the distribution is said to be
Platykurtic. This indicates that the distribution
is flatter and wider than the normal curve.
A normal distribution (normal curve) is said to
be Mesokurtic.
8
The skewness of a
normal curve is 0
and its kurtosis is 3.
9
10
A. Determine the area BELOW the following.
1. z = 2
2. z = 2.9
3. z = -1.5
4. z = 2.14
5. z = -2.8
6. z = -2.15
7. z = -0.12
8. z = 1.67
9. z = -0.76
10. z = 0.1
11
B. Determine the area ABOVE the following.
1. z = 2.5
2. z = -2.5
3. z = 1.25
4. z = -0.15
5. z = 2.13
6. z = -2.15
7. z = -0.03
8. z = -1.64
9. z = 1.96
10. z = 2.33
12
C. Determine the area of the region indicated by
the following. Draw a normal curve for each.
1. -1 < z < 1
2. -2 < z < 2
3. -1.5 < z < 2.5
4. 0.18 < z < 3.2
5. -3 < z < 1.65
6. -0.1 < z < 1.47
7. -2.33 < z < 1.64
8. -2.88 < z < 3
9. -1.96 < z < 1.96
10. -2.96 < z < -0.01
13
A. Determine the area of the region indicated by the
following.
1. -1 < z < 1
2. -2 < z < 2
3. -1.5 < z < 2.5
4. 0.18 < z < 3
5. -3 < z < 1.65
B. Determine the area of the region indicated by the
following.
1. Below z = -2.76
2. Above z = -1.27
3. Below z = 1.09
4. Above z = 1.55
5. Below z = 2.13
14
Find the area of the shaded region of the normal curve.
1.
A = 0.3413 or 34.13%
15
2.
A = 2(0.4938)
= 0.9876 or 98.76%
16
3.
2.
A = 0.5 – 0.3944
= 0.1056 or 10.56%
-1.25
17
A = 0.4938 + 0.2734
= 0.7672 or 76.72%
4.
18
5.
A = (0.50 – 0.3944) + (0.4772 – 0.1915)
= 0.1056 + 0.2857
= 0.3913 or 39.13%
19
A = 0.5 – 0.3944
= 0.1056 or 10.56%
20
A = 0.5 – 0.3944 + 0.4772 – 0.3159
= 0.1056 + 0.1613
= 0.2669 or 26.69%
21
A = 0.5 – 0.3944 + 0.3413 + 0.5 – 0.3159
= 0.1056 + 0.3413 + 0.1841
= 0.6310 or 63.10%
22
A = 0.5 – 0.4970
= 0.003 or 0.30%
-2.75
23
A = 0.5 – 0.4970 + 0.3944
= 0.003 + 0.3944
= 0.3974 or 39.74%
-2.75
24
A = 0.5 – 0.4970 + 0.3944 + 0.5 – 0.4394
= 0.003 + 0.3944 + 0.0606
= 0.458 or 45.80%
-2.75
25
A = 1 – 2(0.4750)
= 1 – 0.95
= 0.05 or 5%
26
27

Normal Distribution including some examples

  • 1.
  • 2.
    2 NORMAL CURVE isa bell-shaped curve which shows the probability distribution of a continuous random variable. It represents a normal distribution. It has a mean µ = 0 and standard deviation ơ = 1. Its skewness is 0 and its kurtosis is 3.
  • 3.
    3 Properties of theNormal Probability Distribution 1. The distribution curve is bell-shaped. 2. The curve is symmetrical about its center. 3. The mean, the median, and the mode coincide at the center. 4. The width of the curve is determined by the standard deviation of the distribution. 5. The tails of the curve flatten out indefinitely along the horizontal axis, always approaching the axis but never touching it. That is, the curve is asymptotic to the base line. 6. The area under the curve is 1. Thus, it represents the probability or proportion or the percentage associated with specific sets of measurement values.
  • 4.
    4 Skewness talks aboutthe degree of symmetry of a curve. It is asymmetry in a statistical distribution, in which the curve appears distorted or skewed either to the left or to the right. It can be quantified to define the extent to which a distribution differs from a normal distribution. Kurtosis, on the other hand, talks about the degree of peakedness of a curve. It refers to the pointedness or flatness of a peak in the distribution curve.
  • 5.
    5 Skewed to the Left Skewedto the Right Skewness is less than zero (negative). Skewness is greater than zero (positive).
  • 6.
  • 7.
    7 If the kurtosisof a curve is greater than zero (positive), the distribution is said to be Leptokurtic. This means that the distribution is taller and thinner than the normal curve. If the kurtosis of a curve is less than zero (negative), the distribution is said to be Platykurtic. This indicates that the distribution is flatter and wider than the normal curve. A normal distribution (normal curve) is said to be Mesokurtic.
  • 8.
    8 The skewness ofa normal curve is 0 and its kurtosis is 3.
  • 9.
  • 10.
    10 A. Determine thearea BELOW the following. 1. z = 2 2. z = 2.9 3. z = -1.5 4. z = 2.14 5. z = -2.8 6. z = -2.15 7. z = -0.12 8. z = 1.67 9. z = -0.76 10. z = 0.1
  • 11.
    11 B. Determine thearea ABOVE the following. 1. z = 2.5 2. z = -2.5 3. z = 1.25 4. z = -0.15 5. z = 2.13 6. z = -2.15 7. z = -0.03 8. z = -1.64 9. z = 1.96 10. z = 2.33
  • 12.
    12 C. Determine thearea of the region indicated by the following. Draw a normal curve for each. 1. -1 < z < 1 2. -2 < z < 2 3. -1.5 < z < 2.5 4. 0.18 < z < 3.2 5. -3 < z < 1.65 6. -0.1 < z < 1.47 7. -2.33 < z < 1.64 8. -2.88 < z < 3 9. -1.96 < z < 1.96 10. -2.96 < z < -0.01
  • 13.
    13 A. Determine thearea of the region indicated by the following. 1. -1 < z < 1 2. -2 < z < 2 3. -1.5 < z < 2.5 4. 0.18 < z < 3 5. -3 < z < 1.65 B. Determine the area of the region indicated by the following. 1. Below z = -2.76 2. Above z = -1.27 3. Below z = 1.09 4. Above z = 1.55 5. Below z = 2.13
  • 14.
    14 Find the areaof the shaded region of the normal curve. 1. A = 0.3413 or 34.13%
  • 15.
    15 2. A = 2(0.4938) =0.9876 or 98.76%
  • 16.
    16 3. 2. A = 0.5– 0.3944 = 0.1056 or 10.56% -1.25
  • 17.
    17 A = 0.4938+ 0.2734 = 0.7672 or 76.72% 4.
  • 18.
    18 5. A = (0.50– 0.3944) + (0.4772 – 0.1915) = 0.1056 + 0.2857 = 0.3913 or 39.13%
  • 19.
    19 A = 0.5– 0.3944 = 0.1056 or 10.56%
  • 20.
    20 A = 0.5– 0.3944 + 0.4772 – 0.3159 = 0.1056 + 0.1613 = 0.2669 or 26.69%
  • 21.
    21 A = 0.5– 0.3944 + 0.3413 + 0.5 – 0.3159 = 0.1056 + 0.3413 + 0.1841 = 0.6310 or 63.10%
  • 22.
    22 A = 0.5– 0.4970 = 0.003 or 0.30% -2.75
  • 23.
    23 A = 0.5– 0.4970 + 0.3944 = 0.003 + 0.3944 = 0.3974 or 39.74% -2.75
  • 24.
    24 A = 0.5– 0.4970 + 0.3944 + 0.5 – 0.4394 = 0.003 + 0.3944 + 0.0606 = 0.458 or 45.80% -2.75
  • 25.
    25 A = 1– 2(0.4750) = 1 – 0.95 = 0.05 or 5%
  • 26.
  • 27.