SlideShare a Scribd company logo
1 of 19
Download to read offline
Performance characteristics of counter flow wet cooling towers
Jameel-Ur-Rehman Khan, M. Yaqub, Syed M. Zubair *
Department of Mechanical Engineering, King Fahd University of Petroleum and Minerals, Mail Box 1474,
Dhahran 31261, Saudi Arabia
Received 16 June 2002; accepted 23 September 2002
Abstract
Cooling towers are one of the biggest heat and mass transfer devices that are in widespread use. In this
paper, we use a detailed model of counter flow wet cooling towers in investigating the performance
characteristics. The validity of the model is checked by experimental data reported in the literature. The
thermal performance of the cooling towers is clearly explained in terms of varying air and water tempera-
tures, as well as the driving potential for convection and evaporation heat transfer, along the height of the
tower. The relative contribution of each mode of heat transfer rate to the total heat transfer rate in the
cooling tower is established. It is demonstrated with an example problem that the predominant mode of
heat transfer is evaporation. For example, evaporation contributes about 62.5% of the total rate of heat
transfer at the bottom of the tower and almost 90% at the top of the tower. The variation of air and water
temperatures along the height of the tower (process line) is explained on psychometric charts.
Ó 2002 Elsevier Science Ltd. All rights reserved.
Keywords: Cooling towers; Model; Performance evaluation
1. Introduction
Cooling towers, as shown schematically in Fig. 1, consist of large chambers loosely filled with
trays or decks of wooden boards as slats or of PVC material. The water to be cooled is pumped to
the top of the tower, where it is distributed over the top deck by sprays or distributor troughs
made of wood or PVC material. It then falls and splashes from deck-to-deck down through the
tower. Air is permitted to pass through the tower horizontally due to wind currents (cross flow) or
vertically upward (counter current) to the falling water droplets. In the case of counter current
Energy Conversion and Management 44 (2003) 2073–2091
www.elsevier.com/locate/enconman
*
Corresponding author. Tel.: +966-3-860-3135; fax: +966-3-860-2949.
E-mail address: smzubair@kfupm.edu.sa (S.M. Zubair).
0196-8904/02/$ - see front matter Ó 2002 Elsevier Science Ltd. All rights reserved.
doi:10.1016/S0196-8904(02)00231-5
Nomenclature
AV surface area of water droplets per unit volume of tower, m2
/m3
cpa specific heat at constant pressure of moist air, kJ/kga K
cw specific heat of water, kJ/kgw K
E slope of the ‘‘tie’’ line, kJ/kgw K
h enthalpy of moist air, kJ/kga
hc convective heat transfer coefficient of air, kW/m2
K
hc;w convective heat transfer coefficient of water, kW/m2
K
hD convective mass transfer coefficient, kgw/m2
s
hf specific enthalpy of saturated liquid water, kJ/kgw
hf;w specific enthalpy of water evaluated at tw, kJ/kgw
hg specific enthalpy of saturated water vapor, kJ/kgw
h0
g specific enthalpy of saturated water vapor evaluated at 0 °C, kJ/kgw
hfg;w change of phase enthalpy ðhfg;w ¼ hg;w À hf;wÞ, kJ/kgw
hs;w enthalpy of saturated moist air evaluated at tw, kJ/kga
hs;int enthalpy of saturated moist air evaluated at tint, kJ/kga
Le Lewis number ðLe ¼ hc=hDcp;aÞ
_mma mass flow rate of dry air, kga/s
_mmw mass flow rate of water, kgw/s
NTU number of transfer units
PQ percentage heat rate(Q=Qtot)
Pr Prandtl number
Sc Schmidt number
t dry bulb temperature of moist air, °C
tint air–water interface temperature, °C
tw water temperature, °C
V volume of tower, m3
W humidity ratio of moist air, kgw/kga
Ws;w humidity ratio of saturated moist air evaluated at tw, kgw/kga
e effectiveness
Subscripts
a moist air
db dry bulb
em empirical
g,w vapor at water temperature
i inlet
int air–water interface
max maximum
o outlet
s,w saturated moist air at water temperature
w water
2074 J.-U.-R. Khan et al. / Energy Conversion and Management 44 (2003) 2073–2091
towers, the air motion is due to the natural chimney effect of the warm moist air in the tower or
may be caused by fans at the bottom (forced draft) or at the top (induced draft) of the tower.
Walker et al. [1] was the first to propose a basic theory of cooling tower operation. The
practical use of basic differential equations, however, was first presented by Merkel [2], in which
he combined the equations for heat and water vapor transfer. He showed the utility of total heat
or enthalpy difference as a driving force to allow for both sensible and latent heats. The basic
postulations and approximations that are inherent in MerkelÕs theory are:
• the resistance for heat transfer in the liquid film is negligible;
• the mass flow rate of water per unit cross sectional area of the tower is constant, i.e. there is no
loss of water due to evaporation;
w,i water inlet
w,o water outlet
wb,i wet bulb inlet
wb,o wet bulb outlet
Superscripts
cal calculated
exp experimental
Fig. 1. Schematic of a wet counter flow cooling tower.
J.-U.-R. Khan et al. / Energy Conversion and Management 44 (2003) 2073–2091 2075
• the specific heat of the air–steam mixture at constant pressure is the same as that of dry air;
• the Lewis number for humid air is unity.
It should be noted that the formulation and implementation of MerkelÕs theory in cooling
tower design and performance evaluation is presented and discussed in most unit operations and
process heat transfer textbooks.
2. Literature review
Webb [3] performed a unified theoretical treatment for thermal analysis of cooling towers,
evaporative condensers and evaporative fluid coolers. In this paper, specific calculation proce-
dures are explained for sizing and rating each type of evaporative exchanger. In another paper,
Webb and Villacres [4] described three computer algorithms that have been developed to perform
rating calculations of three evaporatively cooled heat exchangers. The algorithms are particularly
useful for rating commercially available heat exchangers at part load conditions. The heat and
mass transfer ‘‘characteristic equation’’ of one of the heat exchangers is derived from the manu-
facturerÕs rating data at the design point.
Jaber and Webb [5] presented an analysis that shows how the theory of heat exchanger design
may be applied to cooling towers. They demonstrated that the effectiveness ðeÞ and NTUs defi-
nitions are in very good agreement with those used for heat exchanger design and are applicable to
all cooling tower operating conditions. It is important to note that they did not consider heat
transfer resistance in the air–water interface and the effect of water evaporation on the air process
states along the vertical length of the tower. The results are only applicable for Lewis number
equal to one. Furthermore, they used MerkelÕs approximation of replacing the sum of the single
phase heat transfer from the water–air interface to the air and the mass transfer (evaporation of
water) at the interface with the enthalpy as a driving potential.
Braun et al. [6] presented effectiveness models for cooling towers and cooling coils. The models
utilize existing thermal effectiveness relationships developed for sensible heat exchangers with
modified definitions for the number of transfer units and the fluid capacitance rate ratio. The
results of the models were compared with those of more detailed numerical solutions to the basic
heat and mass transfer equations and experimental data. They also did not consider the effect of
air–water interface temperature, however, they did consider the effect of water evaporation on the
air process states along the vertical length of the tower. The results are only presented for a Lewis
number equal to unity.
Dessouky et al. [7] presented a solution for the steady state counter flow wet cooling tower with
new definitions of tower effectiveness and number of transfer units. Their model is essentially a
modified version of Jaber and WebbÕs model with the inclusion of Lewis number, which appears
as a multiplication factor to the enthalpy driving potential. They did consider the effect of in-
terface temperature and Lewis number, however, the effect of water evaporation on the air process
states along the vertical length is not considered. Furthermore, they used an approximate equa-
tion for calculating the moist air enthalpy, which was obtained by curve fitting the tabu-
lated thermodynamic properties of saturated air–water vapor mixtures. It is important to note
that the calculation of moist air properties should be accurate to obtain reliable results. Jorge and
2076 J.-U.-R. Khan et al. / Energy Conversion and Management 44 (2003) 2073–2091
Armando [8] tested a new closed wet cooling tower for use in chilled ceilings in buildings. They
also obtained experimental correlations for the heat and mass transfer coefficients and concluded
that existing thermal models were found to predict reliably the thermal performance of cooling
towers. Bernier [9,10] explained the performance of a cooling tower by examining the heat and
mass transfer mechanism from a single water droplet to the ambient air. He did not consider the
effect of air temperature as it moved from the bottom to the top of the tower. Nimr [11] presented
a mathematical model to describe the thermal behavior of cooling towers that contain packing
materials. The model takes into account both sensible and latent effects on the tower performance.
A closed form solution was obtained for both the transient and steady temperature distribution in
a cooling tower. Jose [12] defined a new parameter ‘‘thermo fluid dynamic efficiency’’, to quantify
the performances of cooling tower fills and concluded that it is independent of the cooling tower
height.
The objective of this paper is to investigate the heat and mass transfer mechanisms from a water
droplet in a cooling tower as the air moves in the vertical direction. In this regard, for the sake of
completeness, we first discuss briefly the model of the tower, in which we have used reliable air–
water thermodynamic property equations that are formulated by Hyland and Wexler [13,14]. It is
then followed by results and discussions related to the heat and mass transfer mechanisms of a
water droplet as it travels from the top to the bottom of the tower.
3. Analysis of a cooling tower
A schematic of a counter flow cooling tower, showing the important states, is presented in
Fig. 2. The major assumptions that are used to derive the basic modeling equations may be
summarized as [15,16]:
• heat and mass transfer is in a direction normal to the flows only;
• negligible heat and mass transfer through the tower walls to the environment;
• negligible heat transfer from the tower fans to the air or water streams;
• constant water and dry air specific heats;
• constant heat and mass transfer coefficients throughout the tower;
• constant value of Lewis number throughout the tower;
• water lost by drift is negligible;
• uniform temperature throughout the water stream at each cross section; and
• uniform cross sectional area of the tower.
From the steady state energy and mass balances on an incremental volume (refer to Fig. 2), the
following equation may be written [16]
_mma dh ¼ _mmw dhf;w þ _mma dW hf;w ð1Þ
We may also write the water energy balance in terms of the heat and mass transfer coefficients, hc
and hD, respectively, as
_mmw dhf;w ¼ hcAV dV ðtw À tÞ þ hDAV dV ðWs;w À W Þhfg;w ð2Þ
J.-U.-R. Khan et al. / Energy Conversion and Management 44 (2003) 2073–2091 2077
and the air side water vapor mass balance as
_mma dW ¼ hDAV dV ðWs;w À W Þ ð3Þ
By substitution of the Lewis number as Le ¼ hc=hDcpa in Eq. (2), we get, after simplification,
_mmw dhf;w ¼ hDAV dV ½Lecpaðtw À tÞ þ ðWs;w À W Þhfg;wŠ ð4Þ
Notice that we have defined Lewis number in Eq. (4) similar to the definition that is used by
Braun et al. [6] and Kuehn et al. [15], however, Jaber and Webb [5] and El-Dessouky et al. [7] have
used Le ¼ Sc=Pr, commonly used in heat and mass transfer literature. In this regard, we prefer to
stick to the notation of Kuehn et al. [15] that is considered as one of the standard references in
cooling tower literature. Combining Eqs. (1)–(4), we get, after some simplification [16],
dh
dW
¼ Le
ðhs;w À hÞ
ðWs;w À W Þ
þ ðhg;w À h0
gLeÞ ð5Þ
It should be noted that Eq. (5) describes the condition line on the psychometric chart for the
changes in state for moist air passing through the tower. For given water temperatures ðtw;i; tw;oÞ,
Lewis number (Le), inlet condition of air and mass flow rates, Eqs. (1) and (5) may be solved
numerically for the exit conditions of both the air and water stream. The solution is iterative with
respect to the air humidity ratio and temperatures (W , t and tw). At each iteration, Eqs. (1)–(5) can
Fig. 2. Mass and energy balance of a wet counter flow cooling tower [15,16].
2078 J.-U.-R. Khan et al. / Energy Conversion and Management 44 (2003) 2073–2091
be integrated numerically over the entire tower volume from air inlet to outlet by a procedure
similar to that described in Kuehn et al. [15] and Khan and Zubair [16].
In deriving Eqs. (1)–(5), it was assumed that there is no resistance to heat flow in the interface
between the air and water. In other words, the interface temperature was assumed to be equal to
the bulk water temperature. However, for heat transfer to take place between the air and water,
the temperature of the interface film must be less than the bulk water temperature, as shown in
Fig. 3. In that case, all the terms in Eqs. (1)–(5) with the subscripts (s, w) will be replaced by
subscript (s, int). Webb [5] assumed that tw is nearly equal to ðtint þ 0:5Þ.
Fig. 3 shows both the enthalpies of the saturated air–water vapor mixture and tower operating
line as a function of water temperature. Considering the short distance between hs;w and hs;int on
the saturation curve as a straight line, the following simple relationship can be easily deduced [7],
hs;w À h ¼ hs;w À hs;int þ Eðtw À tintÞ ð6Þ
where E is the slope of the tie line and is constant for a given cooling tower. This slope is given by
E ¼ Àhc;w=hD ð7Þ
The above equation can be used for obtaining the interface temperature. However, for large
values of E, the interface and bulk water temperatures are almost equal.
A computer program written by Khan and Zubair [16] is used for solving Eqs. (1)–(5) nu-
merically, and the flow chart of the program is shown in Fig. 4. In this program, the properties of
the air–water vapor mixture and moist air are needed at each step of the numerical calculation.
These properties are obtained from the property equations given in Hyland and Wexler [13,14],
which are also used by ASHRAE [17] in computing air–water vapor thermodynamic properties.
The program gives the dry bulb temperature, wet bulb temperature of air, water temperature and
humidity ratio of air at each step of the numerical calculation starting from the air inlet to the air
outlet values. If the value of ðhDAV Þ is known, the required tower volume may be obtained by
using [16]:
EnthalpykJ/kgdryair
0
100
200
Saturated Air
air operating line
10 50
hs,int
hs,w
h
E=
-
E=
hs,wh-
hs,int
h-
Water Temperature C
o
Ta
Tint
Tw
Tw > >Tint Ta
Dh
c,wh
Fig. 3. Water operating line on enthalpy–temperature diagram indicating the effect of tie line ðE ¼ Àhc;w=hDÞ on
saturated moist air enthalpy [16].
J.-U.-R. Khan et al. / Energy Conversion and Management 44 (2003) 2073–2091 2079
Fig. 4. Flow chart of the computer model.
2080 J.-U.-R. Khan et al. / Energy Conversion and Management 44 (2003) 2073–2091
V ¼
_mma
hDAV
Z Wo
Wi
dW
Ws;w À W
ð8Þ
The integral in the above equation is solved numerically. The number of transfer units of the
tower is calculated by
NTU ¼ hDAV V = _mma ¼
Z Wo
Wi
dW
Ws;w À W
ð9Þ
The cooling tower effectiveness ðeÞ is defined as the ratio of the actual energy transfer to the
maximum possible energy transfer
e ¼
ho À hi
hs;w;i À hi
ð10Þ
Correlations for the heat and mass transfer of cooling towers in terms of physical parameters do
not exist. It is usually necessary to correlate the tower performance data for specific tower designs.
Mass transfer data are typically correlated in the form [18]:
hDAV V
_mmw
¼ c
_mmw
_mma
!n
ð11Þ
where c and n are empirical constants specific to a particular tower design. Multiplying both sides
of the above equation by ð _mmw= _mmaÞ and considering the definition for NTU (refer to Eq. (9)) gives
the empirical value of NTU as
NTUem ¼ c
_mmw
_mma
!nþ1
ð12Þ
The coefficients c and n of the above equation were fit to the measurements of Simpson and
Sherwood [19] for four different tower designs over a range of performance conditions by Braun
et al. [6]. Their experimental values were also compared with the values obtained by our model,
and the results are discussed in Khan and Zubair [16]. It was shown that the calculated and
empirical values of NTU are well within acceptable limits. Also, the wet bulb temperature of the
outlet air ðtwb;oÞ calculated from the present model is compared with the experimental values
reported in Simpson and Sherwood [19], and the two values are very close to each other (within
Æ0.6%).
4. Performance characteristics
It is commonly believed that the evaporation heat transfer rate inside the cooling tower is much
greater than the convective heat transfer rate. To investigate the contribution of evaporation heat
transfer in a cooling tower, a study is conducted on a water droplet as it moves from the top to the
bottom of the tower, whereas the air that is used to cool the water is forced from the bottom of the
tower in a counter flow arrangement. In this regard, the heat transfer rates from a single water
droplet (of 3 mm diameter) inside the cooling tower due to convection and evaporation were
expressed, respectively, as
J.-U.-R. Khan et al. / Energy Conversion and Management 44 (2003) 2073–2091 2081
_QQconv ¼ hcAV ðtw À tdbÞ ð13Þ
_QQevap ¼ hDAV ðWs;w À WaÞhfg;w ð14Þ
The computer program for simulating the performance of the cooling tower, explained in the
previous section, was used for analyzing the heat transfer rates for the following set of input data:
tdb;i ¼ 29:0 °C, twb;i ¼ 21:11 °C, tw;i ¼ 28:72 °C, tw;o ¼ 24:22 °C, hDAV ¼ 3:025 kg/s m3
, Le ¼ 0:9
and _mma ¼ 1:187 kg/s. At each incremental control volume, measured from the top of the tower, the
program calculates the thermodynamic properties of the air–water mixture that are then used to
calculate the heat transfer rates from the water droplet by using Eqs. (13) and (14). The results
from the program are plotted in Figs. 5–19. In these figures, the effects of water to air mass flow
rate ratios on the air–water temperatures, as well as the driving potential for convective–evapo-
rative heat transfer rates are investigated. In this regard, the ratio of mass flow rate of water to
mass flow rate of air, _mmw= _mma, is varied from 0.5 to 1.5 at an interval of 0.5.
Fig. 5 is a plot of the air and water temperatures versus volume of tower. The water falls from
the top and its temperature, tw, decreases continuously as it approaches the bottom of the tower.
This is generally expected in a cooling tower because the water loses heat both by convection and
evaporation. It is interesting to see that the air, which enters from the bottom of the tower with
initial dry bulb temperature, tdb, decreases in temperature and then increases before leaving from
the top of the tower. This can be explained from the fact that the water, which enters from the top
of the tower, when it reaches the lower part, is cooled because of a predominantly evaporation
mechanism. In this region, the water temperature, tw, is much lower than the entering air dry bulb
temperature, tdb, however, as we note from Fig. 5, when the tower volume from the top reaches
0 0.2 0.4 0.6 0.8
20
22
24
26
28
30
tdb
tw
twb
Temperature(°C)
Volume of Tower "V" m3
Fig. 5. Variation of dry and wet bulb temperature of air and water temperature with volume of tower for _mmw= _mma ¼
0:50.
2082 J.-U.-R. Khan et al. / Energy Conversion and Management 44 (2003) 2073–2091
above 0.15 m3
, the water temperature is less than tdb. This results in heat transfer from the air to
the water (i.e. negative convection). The intersection point of the tdb and tw curves indicates no
20
22
24
26
28
30
tdb
tw
twb
0 0.2 0.4 0.6 0.8
Temperature(°C)
Volume of Tower "V" m3
Fig. 6. Variation of dry and wet bulb temperature of air and water temperature with volume of tower for
_mmw= _mma ¼ 1:00.
20
22
24
26
28
30
tdb
tw
twb
0 0.2 0.4 0.6 0.8
Temperature(°C)
Volume of Tower "V" m3
Fig. 7. Variation of dry and wet bulb temperature of air and water temperature with volume of tower for
_mmw= _mma ¼ 1:50.
J.-U.-R. Khan et al. / Energy Conversion and Management 44 (2003) 2073–2091 2083
temperature difference. At this point, there is no convection heat exchange between the water and
the air. Furthermore, below this point tdb is less than tw, which results in heat transfer from the
water to the air (i.e. positive convection). As expected, the wet bulb temperature of the air twb
Fig. 8. Variation of driving potential for convection and evaporation heat transfer with volume of tower for
_mmw= _mma ¼ 0:50.
Fig. 9. Variation of driving potential for convection and evaporation heat transfer with volume of tower for
_mmw= _mma ¼ 1:00.
2084 J.-U.-R. Khan et al. / Energy Conversion and Management 44 (2003) 2073–2091
decreases continuously in the tower from the top to the bottom. It approaches the water outlet
temperature at the bottom of the tower.
Fig. 10. Variation of driving potential for convection and evaporation heat transfer with volume of tower for
_mmw= _mma ¼ 1:50.
-1
0
1
2
3
Qevap
Qtotal
Qconv
0 0.2 0.4 0.6 0.8
HeatRates"Q"(Watts)
Volume of Tower "V" m3
Fig. 11. Variation of heat rates with volume of tower for _mmw= _mma ¼ 0:50.
J.-U.-R. Khan et al. / Energy Conversion and Management 44 (2003) 2073–2091 2085
The effect of mass flow rate ratio _mmw= _mma is investigated by varying the mass flow rate of water,
_mmw, while keeping the air flow rate, _mma, constant. The results are shown in Figs. 5–7. We note that
Qevap
Qtotal
Qconv
-1
0
1
2
3
0 0.2 0.4 0.6 0.8
HeatRates"Q"(Watts)
Volume of Tower "V" m3
Fig. 12. Variation of heat rates with volume of tower for _mmw= _mma ¼ 1:00.
Qevap
Qtotal
Qconv
-1
0
1
2
3
0 0.2 0.4 0.6 0.8
HeatRates"Q"(Watts)
Volume of Tower "V" m3
Fig. 13. Variation of heat rates with volume of tower for _mmw= _mma ¼ 1:50.
2086 J.-U.-R. Khan et al. / Energy Conversion and Management 44 (2003) 2073–2091
with the increase in water mass flow rate, the dry bulb temperature of the air decreases over a
relatively small height of the tower, and also the temperature drop of water is less with the in-
crease in _mmw. This can be explained from the fact that with an increase in mass flow rate ratio,
more water is to be cooled for a given tower volume. Therefore, one would expect that the surface
Fig. 14. Variation of percent heat rates with volume of tower for _mmw= _mma ¼ 0:50.
Fig. 15. Variation of percent heat rates with volume of tower for _mmw= _mma ¼ 1:00.
J.-U.-R. Khan et al. / Energy Conversion and Management 44 (2003) 2073–2091 2087
area required both for convection and evaporation will be reduced, resulting in higher water outlet
temperatures and reduced heat transfer rates.
The driving potentials for evaporative heat transfer ðWs;w À WaÞ and convective heat transfer
ðtw À tdbÞ versus tower volume are presented in Figs. 8–10 for _mmw= _mma varying from 0.5 to 1.5 at an
interval of 0.5. We note that the humidity ratio of saturated moist air, Ws;w decreases with tower
volume measured from the top because the water temperature decreases as it moves down, while
Fig. 16. Variation of percent heat rates with volume of tower for _mmw= _mma ¼ 1:50.
75
50
0
0.04
0.01
0.03
0.02
50
75
100
125
25 30
100
125
150
175
200
225
250
275
Enthalpy
(kJ/kg
of dry
air)
RH = 20%
0.08
0.06
0.04
0.02
0
Dry Bulb Temperature (°C)
10 20 30 40 50 60
HumidityRatio(kgofmoisture/kgofdryair)
Fig. 17. Process line of water cooling in cooling tower for _mmw= _mma ¼ 0:50.
2088 J.-U.-R. Khan et al. / Energy Conversion and Management 44 (2003) 2073–2091
the humidity ratio of moist air, Wa increases with tower volume measured from the bottom because
the air absorbs moisture as it move upwards. These figures show that the potential for evaporation
decreases first and then increases with the tower volume, particularly for _mmw= _mma ¼ 0:5. However,
for _mmw= _mma P 1:0, the potential increases with tower volume. On the other hand, the driving po-
tential for convection heat transfer ðtw À tdbÞ decreases with tower volume, and it becomes negative
after reaching some height of the tower. It, therefore, results in a negative convective heat transfer
in the tower (from water to air). As explained above, the negative convection in the tower occurs
when the water temperature is lower than the air dry bulb temperature.
75
50
0
0.04
0.01
0.03
0.02
50
75
100
125
25 30
100
125
150
175
200
225
250
275
Enthalpy
(kJ/kg
of dry
air)
RH = 20%
0.08
0.06
0.04
0.02
0
Dry Bulb Temperature (°C)
10 20 30 40 50 60
HumidityRatio(kgofmoisture/kgofdryair)
Fig. 18. Process line of water cooling in cooling tower for _mmw= _mma ¼ 1:00.
75
50
0
0.04
0.01
0.03
0.02
50
75
100
125
25 30
100
125
150
175
200
225
250
275
Enthalpy
(kJ/kg
of dry
air)
RH = 20%
0.08
0.06
0.04
0.02
0
Dry Bulb Temperature (°C)
10 20 30 40 50 60
HumidityRatio(kgofmoisture/kgofdryair)
Fig. 19. Process line of water cooling in cooling tower for _mmw= _mma ¼ 1:50.
J.-U.-R. Khan et al. / Energy Conversion and Management 44 (2003) 2073–2091 2089
The convection and evaporation heat transfer rates _QQconv, _QQevap and _QQtotalð¼ _QQconv þ _QQevapÞ are
plotted as a function of tower volume measured from the top of the tower in Figs. 11–13. These
figures show that the heat transfer rates are high in the top portions of the tower and decrease as
the water moves from the top to the bottom of the tower, particularly for _mmw= _mma 6 1. These
figures, however, indicate that the total heat rate increases for _mmw= _mma P 1 and is mainly controlled
by the evaporation mechanism. In the region where the heat transfer is taking place from air to
water; i.e. negative convection, the evaporation heat rates are generally high. These figures clearly
show that evaporation is basically controlling the total heat flow in a cooling tower.
The percentage heat rates due to convection and evaporation PQconv and PQevap, are plotted
in Figs. 14–16 as a function of tower volume for different mass flow rate ratios, _mmw= _mma. As
discussed above, _QQconv decreases with _mmw= _mma. Therefore, a high percentage is noted for _mmw= _mma less
than 1.0, particularly in the region where the convection is taking place from air to water, i.e. the
convection component is negative. These figures clearly show that the percentage of the evapo-
ration component is always positive and is highest for low mass flow rate ratios.
The process lines of the air on a psychometric chart are presented in Figs. 17–19 for different
values of _mmw= _mma. These curves show that the dry bulb temperature at the outlet of the tower is
always less than that at the inlet for the conditions investigated in this study. However, the relative
humidity and the specific humidity of the air increase as the air moves from the bottom to the top
of the tower. This implies that the air is also going to cool in the tower, along with the water,
because of evaporation of water in the tower. It should be noted that when water evaporates in the
tower, it needs heat that is taken from both water and air. Therefore, one would expect the
possibility of cooling both air and water in the tower.
5. Concluding remarks
A reliable computer model of a counter flow wet cooling tower has been used to study the heat
transfer mechanisms from a water droplet as it moves from the top to the bottom of the tower,
while the air is forced vertically upward. It is clearly demonstrated that the water temperature, tw,
decreases continuously as it approaches the bottom of the tower. However, air, which acts as a
coolant, enters from the bottom of the tower, initially at its dry bulb temperature, tdb, decreases in
temperature and then increases before leaving from the top of the tower. This cooling phenomenon
of the air, i.e. negative convection, in some parts of the tower, along with the water, is explained due
to evaporation of the water in the tower. It is demonstrated that in the negative convection region
of the tower, the evaporation rates are generally high. The effect of water to air mass flow rate ratio,
_mmw= _mma, is investigated by varying the mass flow rate of water, _mmw, while keeping the air flow rate,
_mma, constant. The results clearly demonstrate that with an increase in water mass flow rate for the
same fill packing, the surface area required both for convection and evaporation is reduced, re-
sulting in higher water outlet temperatures and reduced heat transfer rates.
Acknowledgements
The authors acknowledge the support provided by King Fahd University of Petroleum and
Minerals through the research project (ME/RISK-FOULING/230).
2090 J.-U.-R. Khan et al. / Energy Conversion and Management 44 (2003) 2073–2091
References
[1] Walker WH, Lewis WK, McAdams WH, Gilliland ER. Principles of chemical engineering. 3rd ed. New York:
McGraw-Hill Inc; 1923.
[2] Merkel F. Verdunstungshuhlung. Zeitschrift des Vereines Deutscher Ingenieure (VDI) 1925;70:123–8.
[3] Webb RL. A unified theoretical treatment for thermal analysis of cooling towers, evaporative condensers, and fluid
coolers. ASHRAE Trans 1984;90(2):398–415.
[4] Webb RL, Villacres A. Algorithms for performance simulation of cooling towers, evaporative condensers, and fluid
coolers. ASHRAE Trans 1984;90(2):416–58.
[5] Jaber H, Webb RL. Design of cooling towers by the effectiveness-NTU method. ASME J Heat Transf
1989;111(4):837–43.
[6] Braun JE, Klein SA, Mitchell JW. Effectiveness models for cooling towers and cooling coils. ASHRAE Trans
1989;95(2):164–74.
[7] El-Dessouky HTA, Al-Haddad A, Al-Juwayhel F. A modified analysis of counter flow cooling towers. ASME J
Heat Transf 1997;119(3):617–26.
[8] Jorge F, Armando CO. Thermal behavior of closed wet cooling towers for use with chilled ceilings. Appl Therm
Eng 2000;20:1225–36.
[9] Bernier MA. Cooling tower performance: theory and experiments. ASHRAE Trans 1994;100(2):114–21.
[10] Bernier MA. Thermal performance of cooling towers. ASHRAE J 1995;37(4):56–61.
[11] Nimr MA. Modeling the dynamic thermal behavior of cooling towers containing packing materials. Heat Transf
Eng 1999;20(1):91–6.
[12] Jose AS. The use of thermo-fluid dynamic efficiency in cooling towers. Heat Transf Eng 2002;23:22–30.
[13] Hyland RW, Wexler A. Formulations for the thermodynamic properties of the saturated phases of H2O from
173.15 to 473.15 K. ASHRAE Trans 1983;89(2):500–20.
[14] Hyland RW, Wexler A. Formulations for the thermodynamic properties of dry air from 173.15 to 473.15 K, and of
saturated moist air from 173.15 to 372.15 K, at pressure to 5 MPa. ASHRAE Trans 1983;89(2):520–35.
[15] Kuehn TH, Ramsey JW, Threlkeld JL. Thermal environmental engineering. 3rd ed. New Jersey: Prentice-Hall Inc;
1998.
[16] Khan JR, Zubair SM. An improved design and rating analyses of counter flow wet cooling towers. ASME J Heat
Transf 2001;123:770–8.
[17] ASHRAE handbook of fundamentals. Atlanta, GA: American Society of Heating, Refrigerating, and Air-
Conditioning Engineers, Inc; 1993, Chapter 6.
[18] ASHRAE equipment guide. Atlanta, GA: American Society of Heating, Refrigerating, and Air-Conditioning
Engineers, Inc; 1983, [chapter 3].
[19] Simpson WM, Sherwood TK. Performance of small mechanical draft cooling towers. Refrig Eng 1946;52(6):525–
43, 574–6.
J.-U.-R. Khan et al. / Energy Conversion and Management 44 (2003) 2073–2091 2091

More Related Content

What's hot

Modelling of a cooling tower in EES
Modelling of a cooling tower in EESModelling of a cooling tower in EES
Modelling of a cooling tower in EESShiyas Basheer
 
VARIOUS METHODS OF CENTRIFUGAL COMPRESSOR SURGE CONTROL
VARIOUS METHODS OF CENTRIFUGAL COMPRESSOR SURGE CONTROLVARIOUS METHODS OF CENTRIFUGAL COMPRESSOR SURGE CONTROL
VARIOUS METHODS OF CENTRIFUGAL COMPRESSOR SURGE CONTROLVijay Sarathy
 
Chapter 2-Shell & Tube Heat Exchangers.pdf
Chapter 2-Shell & Tube Heat Exchangers.pdfChapter 2-Shell & Tube Heat Exchangers.pdf
Chapter 2-Shell & Tube Heat Exchangers.pdfKAhmedRehman
 
Techniques of heat transfer enhancement and their application chapter 6
Techniques of heat transfer enhancement and their application chapter 6Techniques of heat transfer enhancement and their application chapter 6
Techniques of heat transfer enhancement and their application chapter 6ssusercf6d0e
 
Shell and tube heat exchanger design
Shell and tube heat exchanger designShell and tube heat exchanger design
Shell and tube heat exchanger designhossie
 
Design Considerations for Plate Type Heat Exchanger
Design Considerations for Plate Type Heat ExchangerDesign Considerations for Plate Type Heat Exchanger
Design Considerations for Plate Type Heat ExchangerArun Sarasan
 
Process Calculation - simple distillation
Process Calculation - simple distillationProcess Calculation - simple distillation
Process Calculation - simple distillationChandran Udumbasseri
 
Types of air preheaters and its advantages
Types of air preheaters and its advantagesTypes of air preheaters and its advantages
Types of air preheaters and its advantagesPreeti Agarwal
 
Selection and Design of Condensers
Selection and Design of CondensersSelection and Design of Condensers
Selection and Design of CondensersGerard B. Hawkins
 
EXH2200 Cooling Tower Design Guidelines.pdf
EXH2200 Cooling Tower Design Guidelines.pdfEXH2200 Cooling Tower Design Guidelines.pdf
EXH2200 Cooling Tower Design Guidelines.pdfZeeshanAlam90
 
Introduction to heat pumps
Introduction to heat pumpsIntroduction to heat pumps
Introduction to heat pumpsLeonardo ENERGY
 
Design & CFD Analysis of Heat Exchanger
Design & CFD Analysis of Heat ExchangerDesign & CFD Analysis of Heat Exchanger
Design & CFD Analysis of Heat ExchangerCPDLR
 

What's hot (20)

Condenser design
Condenser designCondenser design
Condenser design
 
Modelling of a cooling tower in EES
Modelling of a cooling tower in EESModelling of a cooling tower in EES
Modelling of a cooling tower in EES
 
VARIOUS METHODS OF CENTRIFUGAL COMPRESSOR SURGE CONTROL
VARIOUS METHODS OF CENTRIFUGAL COMPRESSOR SURGE CONTROLVARIOUS METHODS OF CENTRIFUGAL COMPRESSOR SURGE CONTROL
VARIOUS METHODS OF CENTRIFUGAL COMPRESSOR SURGE CONTROL
 
Chapter 2-Shell & Tube Heat Exchangers.pdf
Chapter 2-Shell & Tube Heat Exchangers.pdfChapter 2-Shell & Tube Heat Exchangers.pdf
Chapter 2-Shell & Tube Heat Exchangers.pdf
 
Techniques of heat transfer enhancement and their application chapter 6
Techniques of heat transfer enhancement and their application chapter 6Techniques of heat transfer enhancement and their application chapter 6
Techniques of heat transfer enhancement and their application chapter 6
 
Heat exchangers
Heat exchangersHeat exchangers
Heat exchangers
 
Recupretor
RecupretorRecupretor
Recupretor
 
Shell and tube heat exchanger design
Shell and tube heat exchanger designShell and tube heat exchanger design
Shell and tube heat exchanger design
 
FR MULTIPLE EFFECT EVAPORATION
FR MULTIPLE EFFECT EVAPORATIONFR MULTIPLE EFFECT EVAPORATION
FR MULTIPLE EFFECT EVAPORATION
 
Design Considerations for Plate Type Heat Exchanger
Design Considerations for Plate Type Heat ExchangerDesign Considerations for Plate Type Heat Exchanger
Design Considerations for Plate Type Heat Exchanger
 
Heat Exchangers
Heat ExchangersHeat Exchangers
Heat Exchangers
 
Process Calculation - simple distillation
Process Calculation - simple distillationProcess Calculation - simple distillation
Process Calculation - simple distillation
 
Types of air preheaters and its advantages
Types of air preheaters and its advantagesTypes of air preheaters and its advantages
Types of air preheaters and its advantages
 
Selection and Design of Condensers
Selection and Design of CondensersSelection and Design of Condensers
Selection and Design of Condensers
 
Heat Exchanger
Heat ExchangerHeat Exchanger
Heat Exchanger
 
EXH2200 Cooling Tower Design Guidelines.pdf
EXH2200 Cooling Tower Design Guidelines.pdfEXH2200 Cooling Tower Design Guidelines.pdf
EXH2200 Cooling Tower Design Guidelines.pdf
 
Introduction to heat pumps
Introduction to heat pumpsIntroduction to heat pumps
Introduction to heat pumps
 
Heat Exchange
Heat Exchange Heat Exchange
Heat Exchange
 
Chapter 7: Heat Exchanger
Chapter 7: Heat ExchangerChapter 7: Heat Exchanger
Chapter 7: Heat Exchanger
 
Design & CFD Analysis of Heat Exchanger
Design & CFD Analysis of Heat ExchangerDesign & CFD Analysis of Heat Exchanger
Design & CFD Analysis of Heat Exchanger
 

Similar to Performance characteristics of counter flow wet cooling towers

ayush balagopal final ppt
ayush balagopal final pptayush balagopal final ppt
ayush balagopal final pptAYUSH BALAGOPAL
 
CoolingTowerRewriteReport_A7 (1)
CoolingTowerRewriteReport_A7 (1)CoolingTowerRewriteReport_A7 (1)
CoolingTowerRewriteReport_A7 (1)Adam Rice
 
project cooling tower.docx
project cooling tower.docxproject cooling tower.docx
project cooling tower.docxMahamad Jawhar
 
Heat transfer enhancement_fusion reactor.pdf
Heat transfer enhancement_fusion reactor.pdfHeat transfer enhancement_fusion reactor.pdf
Heat transfer enhancement_fusion reactor.pdfSandeepRimza1
 
1 s2.0-s0306261910005465-main
1 s2.0-s0306261910005465-main1 s2.0-s0306261910005465-main
1 s2.0-s0306261910005465-mainLuis Calderon
 
EXPERIMENTAL AND THEORTICAL STUDY OF THE THERMAL PERFORMANCE OF HEAT PIPE HEA...
EXPERIMENTAL AND THEORTICAL STUDY OF THE THERMAL PERFORMANCE OF HEAT PIPE HEA...EXPERIMENTAL AND THEORTICAL STUDY OF THE THERMAL PERFORMANCE OF HEAT PIPE HEA...
EXPERIMENTAL AND THEORTICAL STUDY OF THE THERMAL PERFORMANCE OF HEAT PIPE HEA...IAEME Publication
 
Analysis of forced draft cooling tower performance using ansys fluent software
Analysis of forced draft cooling tower performance using ansys fluent softwareAnalysis of forced draft cooling tower performance using ansys fluent software
Analysis of forced draft cooling tower performance using ansys fluent softwareeSAT Journals
 
analysis of fins subjected to forced convection.
analysis of fins subjected to forced convection.analysis of fins subjected to forced convection.
analysis of fins subjected to forced convection.ChandraprabhuVyavhar
 
Cfd and conjugate heat transfer analysis of heat sinks with different fin geo...
Cfd and conjugate heat transfer analysis of heat sinks with different fin geo...Cfd and conjugate heat transfer analysis of heat sinks with different fin geo...
Cfd and conjugate heat transfer analysis of heat sinks with different fin geo...eSAT Journals
 
JIMEC Thermal modeling and Simulation of HX Conference Paper
JIMEC Thermal modeling and Simulation of HX Conference PaperJIMEC Thermal modeling and Simulation of HX Conference Paper
JIMEC Thermal modeling and Simulation of HX Conference PaperAhmed Sohail Izhar
 
Optimization of Air Preheater for compactness of shell by evaluating performa...
Optimization of Air Preheater for compactness of shell by evaluating performa...Optimization of Air Preheater for compactness of shell by evaluating performa...
Optimization of Air Preheater for compactness of shell by evaluating performa...Nemish Kanwar
 
Design_and_analysis_of_grooved_heat_pipe.pdf
Design_and_analysis_of_grooved_heat_pipe.pdfDesign_and_analysis_of_grooved_heat_pipe.pdf
Design_and_analysis_of_grooved_heat_pipe.pdfTHESEZAR1
 
zuk_masters_paper_final_
zuk_masters_paper_final_zuk_masters_paper_final_
zuk_masters_paper_final_Jonathan Zuk
 

Similar to Performance characteristics of counter flow wet cooling towers (20)

ayush balagopal final ppt
ayush balagopal final pptayush balagopal final ppt
ayush balagopal final ppt
 
Cooling Tower
Cooling TowerCooling Tower
Cooling Tower
 
CoolingTowerRewriteReport_A7 (1)
CoolingTowerRewriteReport_A7 (1)CoolingTowerRewriteReport_A7 (1)
CoolingTowerRewriteReport_A7 (1)
 
project cooling tower.docx
project cooling tower.docxproject cooling tower.docx
project cooling tower.docx
 
Heat transfer enhancement_fusion reactor.pdf
Heat transfer enhancement_fusion reactor.pdfHeat transfer enhancement_fusion reactor.pdf
Heat transfer enhancement_fusion reactor.pdf
 
1 s2.0-s0306261910005465-main
1 s2.0-s0306261910005465-main1 s2.0-s0306261910005465-main
1 s2.0-s0306261910005465-main
 
B013141316
B013141316B013141316
B013141316
 
EXPERIMENTAL AND THEORTICAL STUDY OF THE THERMAL PERFORMANCE OF HEAT PIPE HEA...
EXPERIMENTAL AND THEORTICAL STUDY OF THE THERMAL PERFORMANCE OF HEAT PIPE HEA...EXPERIMENTAL AND THEORTICAL STUDY OF THE THERMAL PERFORMANCE OF HEAT PIPE HEA...
EXPERIMENTAL AND THEORTICAL STUDY OF THE THERMAL PERFORMANCE OF HEAT PIPE HEA...
 
Cooling towers tech article v1r04
Cooling towers tech article v1r04Cooling towers tech article v1r04
Cooling towers tech article v1r04
 
D031201025031
D031201025031D031201025031
D031201025031
 
Analysis of forced draft cooling tower performance using ansys fluent software
Analysis of forced draft cooling tower performance using ansys fluent softwareAnalysis of forced draft cooling tower performance using ansys fluent software
Analysis of forced draft cooling tower performance using ansys fluent software
 
analysis of fins subjected to forced convection.
analysis of fins subjected to forced convection.analysis of fins subjected to forced convection.
analysis of fins subjected to forced convection.
 
report project.docx
report project.docxreport project.docx
report project.docx
 
Cfd and conjugate heat transfer analysis of heat sinks with different fin geo...
Cfd and conjugate heat transfer analysis of heat sinks with different fin geo...Cfd and conjugate heat transfer analysis of heat sinks with different fin geo...
Cfd and conjugate heat transfer analysis of heat sinks with different fin geo...
 
JIMEC Thermal modeling and Simulation of HX Conference Paper
JIMEC Thermal modeling and Simulation of HX Conference PaperJIMEC Thermal modeling and Simulation of HX Conference Paper
JIMEC Thermal modeling and Simulation of HX Conference Paper
 
Ijmet 10 01_051
Ijmet 10 01_051Ijmet 10 01_051
Ijmet 10 01_051
 
Optimization of Air Preheater for compactness of shell by evaluating performa...
Optimization of Air Preheater for compactness of shell by evaluating performa...Optimization of Air Preheater for compactness of shell by evaluating performa...
Optimization of Air Preheater for compactness of shell by evaluating performa...
 
IJIRSTV2I11104
IJIRSTV2I11104IJIRSTV2I11104
IJIRSTV2I11104
 
Design_and_analysis_of_grooved_heat_pipe.pdf
Design_and_analysis_of_grooved_heat_pipe.pdfDesign_and_analysis_of_grooved_heat_pipe.pdf
Design_and_analysis_of_grooved_heat_pipe.pdf
 
zuk_masters_paper_final_
zuk_masters_paper_final_zuk_masters_paper_final_
zuk_masters_paper_final_
 

Recently uploaded

Call Girls Service Nashik Vaishnavi 7001305949 Independent Escort Service Nashik
Call Girls Service Nashik Vaishnavi 7001305949 Independent Escort Service NashikCall Girls Service Nashik Vaishnavi 7001305949 Independent Escort Service Nashik
Call Girls Service Nashik Vaishnavi 7001305949 Independent Escort Service NashikCall Girls in Nagpur High Profile
 
College Call Girls Nashik Nehal 7001305949 Independent Escort Service Nashik
College Call Girls Nashik Nehal 7001305949 Independent Escort Service NashikCollege Call Girls Nashik Nehal 7001305949 Independent Escort Service Nashik
College Call Girls Nashik Nehal 7001305949 Independent Escort Service NashikCall Girls in Nagpur High Profile
 
(ANVI) Koregaon Park Call Girls Just Call 7001035870 [ Cash on Delivery ] Pun...
(ANVI) Koregaon Park Call Girls Just Call 7001035870 [ Cash on Delivery ] Pun...(ANVI) Koregaon Park Call Girls Just Call 7001035870 [ Cash on Delivery ] Pun...
(ANVI) Koregaon Park Call Girls Just Call 7001035870 [ Cash on Delivery ] Pun...ranjana rawat
 
UNIT-III FMM. DIMENSIONAL ANALYSIS
UNIT-III FMM.        DIMENSIONAL ANALYSISUNIT-III FMM.        DIMENSIONAL ANALYSIS
UNIT-III FMM. DIMENSIONAL ANALYSISrknatarajan
 
Software Development Life Cycle By Team Orange (Dept. of Pharmacy)
Software Development Life Cycle By  Team Orange (Dept. of Pharmacy)Software Development Life Cycle By  Team Orange (Dept. of Pharmacy)
Software Development Life Cycle By Team Orange (Dept. of Pharmacy)Suman Mia
 
Top Rated Pune Call Girls Budhwar Peth ⟟ 6297143586 ⟟ Call Me For Genuine Se...
Top Rated  Pune Call Girls Budhwar Peth ⟟ 6297143586 ⟟ Call Me For Genuine Se...Top Rated  Pune Call Girls Budhwar Peth ⟟ 6297143586 ⟟ Call Me For Genuine Se...
Top Rated Pune Call Girls Budhwar Peth ⟟ 6297143586 ⟟ Call Me For Genuine Se...Call Girls in Nagpur High Profile
 
Introduction to IEEE STANDARDS and its different types.pptx
Introduction to IEEE STANDARDS and its different types.pptxIntroduction to IEEE STANDARDS and its different types.pptx
Introduction to IEEE STANDARDS and its different types.pptxupamatechverse
 
KubeKraft presentation @CloudNativeHooghly
KubeKraft presentation @CloudNativeHooghlyKubeKraft presentation @CloudNativeHooghly
KubeKraft presentation @CloudNativeHooghlysanyuktamishra911
 
(MEERA) Dapodi Call Girls Just Call 7001035870 [ Cash on Delivery ] Pune Escorts
(MEERA) Dapodi Call Girls Just Call 7001035870 [ Cash on Delivery ] Pune Escorts(MEERA) Dapodi Call Girls Just Call 7001035870 [ Cash on Delivery ] Pune Escorts
(MEERA) Dapodi Call Girls Just Call 7001035870 [ Cash on Delivery ] Pune Escortsranjana rawat
 
Call Girls in Nagpur Suman Call 7001035870 Meet With Nagpur Escorts
Call Girls in Nagpur Suman Call 7001035870 Meet With Nagpur EscortsCall Girls in Nagpur Suman Call 7001035870 Meet With Nagpur Escorts
Call Girls in Nagpur Suman Call 7001035870 Meet With Nagpur EscortsCall Girls in Nagpur High Profile
 
VIP Call Girls Service Kondapur Hyderabad Call +91-8250192130
VIP Call Girls Service Kondapur Hyderabad Call +91-8250192130VIP Call Girls Service Kondapur Hyderabad Call +91-8250192130
VIP Call Girls Service Kondapur Hyderabad Call +91-8250192130Suhani Kapoor
 
Introduction and different types of Ethernet.pptx
Introduction and different types of Ethernet.pptxIntroduction and different types of Ethernet.pptx
Introduction and different types of Ethernet.pptxupamatechverse
 
UNIT-V FMM.HYDRAULIC TURBINE - Construction and working
UNIT-V FMM.HYDRAULIC TURBINE - Construction and workingUNIT-V FMM.HYDRAULIC TURBINE - Construction and working
UNIT-V FMM.HYDRAULIC TURBINE - Construction and workingrknatarajan
 
(ANJALI) Dange Chowk Call Girls Just Call 7001035870 [ Cash on Delivery ] Pun...
(ANJALI) Dange Chowk Call Girls Just Call 7001035870 [ Cash on Delivery ] Pun...(ANJALI) Dange Chowk Call Girls Just Call 7001035870 [ Cash on Delivery ] Pun...
(ANJALI) Dange Chowk Call Girls Just Call 7001035870 [ Cash on Delivery ] Pun...ranjana rawat
 
Introduction to Multiple Access Protocol.pptx
Introduction to Multiple Access Protocol.pptxIntroduction to Multiple Access Protocol.pptx
Introduction to Multiple Access Protocol.pptxupamatechverse
 
UNIT-II FMM-Flow Through Circular Conduits
UNIT-II FMM-Flow Through Circular ConduitsUNIT-II FMM-Flow Through Circular Conduits
UNIT-II FMM-Flow Through Circular Conduitsrknatarajan
 
MANUFACTURING PROCESS-II UNIT-5 NC MACHINE TOOLS
MANUFACTURING PROCESS-II UNIT-5 NC MACHINE TOOLSMANUFACTURING PROCESS-II UNIT-5 NC MACHINE TOOLS
MANUFACTURING PROCESS-II UNIT-5 NC MACHINE TOOLSSIVASHANKAR N
 
Call for Papers - African Journal of Biological Sciences, E-ISSN: 2663-2187, ...
Call for Papers - African Journal of Biological Sciences, E-ISSN: 2663-2187, ...Call for Papers - African Journal of Biological Sciences, E-ISSN: 2663-2187, ...
Call for Papers - African Journal of Biological Sciences, E-ISSN: 2663-2187, ...Christo Ananth
 

Recently uploaded (20)

Call Girls Service Nashik Vaishnavi 7001305949 Independent Escort Service Nashik
Call Girls Service Nashik Vaishnavi 7001305949 Independent Escort Service NashikCall Girls Service Nashik Vaishnavi 7001305949 Independent Escort Service Nashik
Call Girls Service Nashik Vaishnavi 7001305949 Independent Escort Service Nashik
 
College Call Girls Nashik Nehal 7001305949 Independent Escort Service Nashik
College Call Girls Nashik Nehal 7001305949 Independent Escort Service NashikCollege Call Girls Nashik Nehal 7001305949 Independent Escort Service Nashik
College Call Girls Nashik Nehal 7001305949 Independent Escort Service Nashik
 
(ANVI) Koregaon Park Call Girls Just Call 7001035870 [ Cash on Delivery ] Pun...
(ANVI) Koregaon Park Call Girls Just Call 7001035870 [ Cash on Delivery ] Pun...(ANVI) Koregaon Park Call Girls Just Call 7001035870 [ Cash on Delivery ] Pun...
(ANVI) Koregaon Park Call Girls Just Call 7001035870 [ Cash on Delivery ] Pun...
 
UNIT-III FMM. DIMENSIONAL ANALYSIS
UNIT-III FMM.        DIMENSIONAL ANALYSISUNIT-III FMM.        DIMENSIONAL ANALYSIS
UNIT-III FMM. DIMENSIONAL ANALYSIS
 
Software Development Life Cycle By Team Orange (Dept. of Pharmacy)
Software Development Life Cycle By  Team Orange (Dept. of Pharmacy)Software Development Life Cycle By  Team Orange (Dept. of Pharmacy)
Software Development Life Cycle By Team Orange (Dept. of Pharmacy)
 
Top Rated Pune Call Girls Budhwar Peth ⟟ 6297143586 ⟟ Call Me For Genuine Se...
Top Rated  Pune Call Girls Budhwar Peth ⟟ 6297143586 ⟟ Call Me For Genuine Se...Top Rated  Pune Call Girls Budhwar Peth ⟟ 6297143586 ⟟ Call Me For Genuine Se...
Top Rated Pune Call Girls Budhwar Peth ⟟ 6297143586 ⟟ Call Me For Genuine Se...
 
Introduction to IEEE STANDARDS and its different types.pptx
Introduction to IEEE STANDARDS and its different types.pptxIntroduction to IEEE STANDARDS and its different types.pptx
Introduction to IEEE STANDARDS and its different types.pptx
 
Roadmap to Membership of RICS - Pathways and Routes
Roadmap to Membership of RICS - Pathways and RoutesRoadmap to Membership of RICS - Pathways and Routes
Roadmap to Membership of RICS - Pathways and Routes
 
KubeKraft presentation @CloudNativeHooghly
KubeKraft presentation @CloudNativeHooghlyKubeKraft presentation @CloudNativeHooghly
KubeKraft presentation @CloudNativeHooghly
 
(MEERA) Dapodi Call Girls Just Call 7001035870 [ Cash on Delivery ] Pune Escorts
(MEERA) Dapodi Call Girls Just Call 7001035870 [ Cash on Delivery ] Pune Escorts(MEERA) Dapodi Call Girls Just Call 7001035870 [ Cash on Delivery ] Pune Escorts
(MEERA) Dapodi Call Girls Just Call 7001035870 [ Cash on Delivery ] Pune Escorts
 
Call Girls in Nagpur Suman Call 7001035870 Meet With Nagpur Escorts
Call Girls in Nagpur Suman Call 7001035870 Meet With Nagpur EscortsCall Girls in Nagpur Suman Call 7001035870 Meet With Nagpur Escorts
Call Girls in Nagpur Suman Call 7001035870 Meet With Nagpur Escorts
 
VIP Call Girls Service Kondapur Hyderabad Call +91-8250192130
VIP Call Girls Service Kondapur Hyderabad Call +91-8250192130VIP Call Girls Service Kondapur Hyderabad Call +91-8250192130
VIP Call Girls Service Kondapur Hyderabad Call +91-8250192130
 
Introduction and different types of Ethernet.pptx
Introduction and different types of Ethernet.pptxIntroduction and different types of Ethernet.pptx
Introduction and different types of Ethernet.pptx
 
UNIT-V FMM.HYDRAULIC TURBINE - Construction and working
UNIT-V FMM.HYDRAULIC TURBINE - Construction and workingUNIT-V FMM.HYDRAULIC TURBINE - Construction and working
UNIT-V FMM.HYDRAULIC TURBINE - Construction and working
 
(ANJALI) Dange Chowk Call Girls Just Call 7001035870 [ Cash on Delivery ] Pun...
(ANJALI) Dange Chowk Call Girls Just Call 7001035870 [ Cash on Delivery ] Pun...(ANJALI) Dange Chowk Call Girls Just Call 7001035870 [ Cash on Delivery ] Pun...
(ANJALI) Dange Chowk Call Girls Just Call 7001035870 [ Cash on Delivery ] Pun...
 
Introduction to Multiple Access Protocol.pptx
Introduction to Multiple Access Protocol.pptxIntroduction to Multiple Access Protocol.pptx
Introduction to Multiple Access Protocol.pptx
 
UNIT-II FMM-Flow Through Circular Conduits
UNIT-II FMM-Flow Through Circular ConduitsUNIT-II FMM-Flow Through Circular Conduits
UNIT-II FMM-Flow Through Circular Conduits
 
DJARUM4D - SLOT GACOR ONLINE | SLOT DEMO ONLINE
DJARUM4D - SLOT GACOR ONLINE | SLOT DEMO ONLINEDJARUM4D - SLOT GACOR ONLINE | SLOT DEMO ONLINE
DJARUM4D - SLOT GACOR ONLINE | SLOT DEMO ONLINE
 
MANUFACTURING PROCESS-II UNIT-5 NC MACHINE TOOLS
MANUFACTURING PROCESS-II UNIT-5 NC MACHINE TOOLSMANUFACTURING PROCESS-II UNIT-5 NC MACHINE TOOLS
MANUFACTURING PROCESS-II UNIT-5 NC MACHINE TOOLS
 
Call for Papers - African Journal of Biological Sciences, E-ISSN: 2663-2187, ...
Call for Papers - African Journal of Biological Sciences, E-ISSN: 2663-2187, ...Call for Papers - African Journal of Biological Sciences, E-ISSN: 2663-2187, ...
Call for Papers - African Journal of Biological Sciences, E-ISSN: 2663-2187, ...
 

Performance characteristics of counter flow wet cooling towers

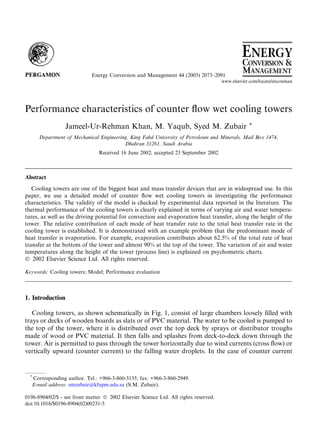
  • 1. Performance characteristics of counter flow wet cooling towers Jameel-Ur-Rehman Khan, M. Yaqub, Syed M. Zubair * Department of Mechanical Engineering, King Fahd University of Petroleum and Minerals, Mail Box 1474, Dhahran 31261, Saudi Arabia Received 16 June 2002; accepted 23 September 2002 Abstract Cooling towers are one of the biggest heat and mass transfer devices that are in widespread use. In this paper, we use a detailed model of counter flow wet cooling towers in investigating the performance characteristics. The validity of the model is checked by experimental data reported in the literature. The thermal performance of the cooling towers is clearly explained in terms of varying air and water tempera- tures, as well as the driving potential for convection and evaporation heat transfer, along the height of the tower. The relative contribution of each mode of heat transfer rate to the total heat transfer rate in the cooling tower is established. It is demonstrated with an example problem that the predominant mode of heat transfer is evaporation. For example, evaporation contributes about 62.5% of the total rate of heat transfer at the bottom of the tower and almost 90% at the top of the tower. The variation of air and water temperatures along the height of the tower (process line) is explained on psychometric charts. Ó 2002 Elsevier Science Ltd. All rights reserved. Keywords: Cooling towers; Model; Performance evaluation 1. Introduction Cooling towers, as shown schematically in Fig. 1, consist of large chambers loosely filled with trays or decks of wooden boards as slats or of PVC material. The water to be cooled is pumped to the top of the tower, where it is distributed over the top deck by sprays or distributor troughs made of wood or PVC material. It then falls and splashes from deck-to-deck down through the tower. Air is permitted to pass through the tower horizontally due to wind currents (cross flow) or vertically upward (counter current) to the falling water droplets. In the case of counter current Energy Conversion and Management 44 (2003) 2073–2091 www.elsevier.com/locate/enconman * Corresponding author. Tel.: +966-3-860-3135; fax: +966-3-860-2949. E-mail address: smzubair@kfupm.edu.sa (S.M. Zubair). 0196-8904/02/$ - see front matter Ó 2002 Elsevier Science Ltd. All rights reserved. doi:10.1016/S0196-8904(02)00231-5
  • 2. Nomenclature AV surface area of water droplets per unit volume of tower, m2 /m3 cpa specific heat at constant pressure of moist air, kJ/kga K cw specific heat of water, kJ/kgw K E slope of the ‘‘tie’’ line, kJ/kgw K h enthalpy of moist air, kJ/kga hc convective heat transfer coefficient of air, kW/m2 K hc;w convective heat transfer coefficient of water, kW/m2 K hD convective mass transfer coefficient, kgw/m2 s hf specific enthalpy of saturated liquid water, kJ/kgw hf;w specific enthalpy of water evaluated at tw, kJ/kgw hg specific enthalpy of saturated water vapor, kJ/kgw h0 g specific enthalpy of saturated water vapor evaluated at 0 °C, kJ/kgw hfg;w change of phase enthalpy ðhfg;w ¼ hg;w À hf;wÞ, kJ/kgw hs;w enthalpy of saturated moist air evaluated at tw, kJ/kga hs;int enthalpy of saturated moist air evaluated at tint, kJ/kga Le Lewis number ðLe ¼ hc=hDcp;aÞ _mma mass flow rate of dry air, kga/s _mmw mass flow rate of water, kgw/s NTU number of transfer units PQ percentage heat rate(Q=Qtot) Pr Prandtl number Sc Schmidt number t dry bulb temperature of moist air, °C tint air–water interface temperature, °C tw water temperature, °C V volume of tower, m3 W humidity ratio of moist air, kgw/kga Ws;w humidity ratio of saturated moist air evaluated at tw, kgw/kga e effectiveness Subscripts a moist air db dry bulb em empirical g,w vapor at water temperature i inlet int air–water interface max maximum o outlet s,w saturated moist air at water temperature w water 2074 J.-U.-R. Khan et al. / Energy Conversion and Management 44 (2003) 2073–2091
  • 3. towers, the air motion is due to the natural chimney effect of the warm moist air in the tower or may be caused by fans at the bottom (forced draft) or at the top (induced draft) of the tower. Walker et al. [1] was the first to propose a basic theory of cooling tower operation. The practical use of basic differential equations, however, was first presented by Merkel [2], in which he combined the equations for heat and water vapor transfer. He showed the utility of total heat or enthalpy difference as a driving force to allow for both sensible and latent heats. The basic postulations and approximations that are inherent in MerkelÕs theory are: • the resistance for heat transfer in the liquid film is negligible; • the mass flow rate of water per unit cross sectional area of the tower is constant, i.e. there is no loss of water due to evaporation; w,i water inlet w,o water outlet wb,i wet bulb inlet wb,o wet bulb outlet Superscripts cal calculated exp experimental Fig. 1. Schematic of a wet counter flow cooling tower. J.-U.-R. Khan et al. / Energy Conversion and Management 44 (2003) 2073–2091 2075
  • 4. • the specific heat of the air–steam mixture at constant pressure is the same as that of dry air; • the Lewis number for humid air is unity. It should be noted that the formulation and implementation of MerkelÕs theory in cooling tower design and performance evaluation is presented and discussed in most unit operations and process heat transfer textbooks. 2. Literature review Webb [3] performed a unified theoretical treatment for thermal analysis of cooling towers, evaporative condensers and evaporative fluid coolers. In this paper, specific calculation proce- dures are explained for sizing and rating each type of evaporative exchanger. In another paper, Webb and Villacres [4] described three computer algorithms that have been developed to perform rating calculations of three evaporatively cooled heat exchangers. The algorithms are particularly useful for rating commercially available heat exchangers at part load conditions. The heat and mass transfer ‘‘characteristic equation’’ of one of the heat exchangers is derived from the manu- facturerÕs rating data at the design point. Jaber and Webb [5] presented an analysis that shows how the theory of heat exchanger design may be applied to cooling towers. They demonstrated that the effectiveness ðeÞ and NTUs defi- nitions are in very good agreement with those used for heat exchanger design and are applicable to all cooling tower operating conditions. It is important to note that they did not consider heat transfer resistance in the air–water interface and the effect of water evaporation on the air process states along the vertical length of the tower. The results are only applicable for Lewis number equal to one. Furthermore, they used MerkelÕs approximation of replacing the sum of the single phase heat transfer from the water–air interface to the air and the mass transfer (evaporation of water) at the interface with the enthalpy as a driving potential. Braun et al. [6] presented effectiveness models for cooling towers and cooling coils. The models utilize existing thermal effectiveness relationships developed for sensible heat exchangers with modified definitions for the number of transfer units and the fluid capacitance rate ratio. The results of the models were compared with those of more detailed numerical solutions to the basic heat and mass transfer equations and experimental data. They also did not consider the effect of air–water interface temperature, however, they did consider the effect of water evaporation on the air process states along the vertical length of the tower. The results are only presented for a Lewis number equal to unity. Dessouky et al. [7] presented a solution for the steady state counter flow wet cooling tower with new definitions of tower effectiveness and number of transfer units. Their model is essentially a modified version of Jaber and WebbÕs model with the inclusion of Lewis number, which appears as a multiplication factor to the enthalpy driving potential. They did consider the effect of in- terface temperature and Lewis number, however, the effect of water evaporation on the air process states along the vertical length is not considered. Furthermore, they used an approximate equa- tion for calculating the moist air enthalpy, which was obtained by curve fitting the tabu- lated thermodynamic properties of saturated air–water vapor mixtures. It is important to note that the calculation of moist air properties should be accurate to obtain reliable results. Jorge and 2076 J.-U.-R. Khan et al. / Energy Conversion and Management 44 (2003) 2073–2091
  • 5. Armando [8] tested a new closed wet cooling tower for use in chilled ceilings in buildings. They also obtained experimental correlations for the heat and mass transfer coefficients and concluded that existing thermal models were found to predict reliably the thermal performance of cooling towers. Bernier [9,10] explained the performance of a cooling tower by examining the heat and mass transfer mechanism from a single water droplet to the ambient air. He did not consider the effect of air temperature as it moved from the bottom to the top of the tower. Nimr [11] presented a mathematical model to describe the thermal behavior of cooling towers that contain packing materials. The model takes into account both sensible and latent effects on the tower performance. A closed form solution was obtained for both the transient and steady temperature distribution in a cooling tower. Jose [12] defined a new parameter ‘‘thermo fluid dynamic efficiency’’, to quantify the performances of cooling tower fills and concluded that it is independent of the cooling tower height. The objective of this paper is to investigate the heat and mass transfer mechanisms from a water droplet in a cooling tower as the air moves in the vertical direction. In this regard, for the sake of completeness, we first discuss briefly the model of the tower, in which we have used reliable air– water thermodynamic property equations that are formulated by Hyland and Wexler [13,14]. It is then followed by results and discussions related to the heat and mass transfer mechanisms of a water droplet as it travels from the top to the bottom of the tower. 3. Analysis of a cooling tower A schematic of a counter flow cooling tower, showing the important states, is presented in Fig. 2. The major assumptions that are used to derive the basic modeling equations may be summarized as [15,16]: • heat and mass transfer is in a direction normal to the flows only; • negligible heat and mass transfer through the tower walls to the environment; • negligible heat transfer from the tower fans to the air or water streams; • constant water and dry air specific heats; • constant heat and mass transfer coefficients throughout the tower; • constant value of Lewis number throughout the tower; • water lost by drift is negligible; • uniform temperature throughout the water stream at each cross section; and • uniform cross sectional area of the tower. From the steady state energy and mass balances on an incremental volume (refer to Fig. 2), the following equation may be written [16] _mma dh ¼ _mmw dhf;w þ _mma dW hf;w ð1Þ We may also write the water energy balance in terms of the heat and mass transfer coefficients, hc and hD, respectively, as _mmw dhf;w ¼ hcAV dV ðtw À tÞ þ hDAV dV ðWs;w À W Þhfg;w ð2Þ J.-U.-R. Khan et al. / Energy Conversion and Management 44 (2003) 2073–2091 2077
  • 6. and the air side water vapor mass balance as _mma dW ¼ hDAV dV ðWs;w À W Þ ð3Þ By substitution of the Lewis number as Le ¼ hc=hDcpa in Eq. (2), we get, after simplification, _mmw dhf;w ¼ hDAV dV ½Lecpaðtw À tÞ þ ðWs;w À W Þhfg;wŠ ð4Þ Notice that we have defined Lewis number in Eq. (4) similar to the definition that is used by Braun et al. [6] and Kuehn et al. [15], however, Jaber and Webb [5] and El-Dessouky et al. [7] have used Le ¼ Sc=Pr, commonly used in heat and mass transfer literature. In this regard, we prefer to stick to the notation of Kuehn et al. [15] that is considered as one of the standard references in cooling tower literature. Combining Eqs. (1)–(4), we get, after some simplification [16], dh dW ¼ Le ðhs;w À hÞ ðWs;w À W Þ þ ðhg;w À h0 gLeÞ ð5Þ It should be noted that Eq. (5) describes the condition line on the psychometric chart for the changes in state for moist air passing through the tower. For given water temperatures ðtw;i; tw;oÞ, Lewis number (Le), inlet condition of air and mass flow rates, Eqs. (1) and (5) may be solved numerically for the exit conditions of both the air and water stream. The solution is iterative with respect to the air humidity ratio and temperatures (W , t and tw). At each iteration, Eqs. (1)–(5) can Fig. 2. Mass and energy balance of a wet counter flow cooling tower [15,16]. 2078 J.-U.-R. Khan et al. / Energy Conversion and Management 44 (2003) 2073–2091
  • 7. be integrated numerically over the entire tower volume from air inlet to outlet by a procedure similar to that described in Kuehn et al. [15] and Khan and Zubair [16]. In deriving Eqs. (1)–(5), it was assumed that there is no resistance to heat flow in the interface between the air and water. In other words, the interface temperature was assumed to be equal to the bulk water temperature. However, for heat transfer to take place between the air and water, the temperature of the interface film must be less than the bulk water temperature, as shown in Fig. 3. In that case, all the terms in Eqs. (1)–(5) with the subscripts (s, w) will be replaced by subscript (s, int). Webb [5] assumed that tw is nearly equal to ðtint þ 0:5Þ. Fig. 3 shows both the enthalpies of the saturated air–water vapor mixture and tower operating line as a function of water temperature. Considering the short distance between hs;w and hs;int on the saturation curve as a straight line, the following simple relationship can be easily deduced [7], hs;w À h ¼ hs;w À hs;int þ Eðtw À tintÞ ð6Þ where E is the slope of the tie line and is constant for a given cooling tower. This slope is given by E ¼ Àhc;w=hD ð7Þ The above equation can be used for obtaining the interface temperature. However, for large values of E, the interface and bulk water temperatures are almost equal. A computer program written by Khan and Zubair [16] is used for solving Eqs. (1)–(5) nu- merically, and the flow chart of the program is shown in Fig. 4. In this program, the properties of the air–water vapor mixture and moist air are needed at each step of the numerical calculation. These properties are obtained from the property equations given in Hyland and Wexler [13,14], which are also used by ASHRAE [17] in computing air–water vapor thermodynamic properties. The program gives the dry bulb temperature, wet bulb temperature of air, water temperature and humidity ratio of air at each step of the numerical calculation starting from the air inlet to the air outlet values. If the value of ðhDAV Þ is known, the required tower volume may be obtained by using [16]: EnthalpykJ/kgdryair 0 100 200 Saturated Air air operating line 10 50 hs,int hs,w h E= - E= hs,wh- hs,int h- Water Temperature C o Ta Tint Tw Tw > >Tint Ta Dh c,wh Fig. 3. Water operating line on enthalpy–temperature diagram indicating the effect of tie line ðE ¼ Àhc;w=hDÞ on saturated moist air enthalpy [16]. J.-U.-R. Khan et al. / Energy Conversion and Management 44 (2003) 2073–2091 2079
  • 8. Fig. 4. Flow chart of the computer model. 2080 J.-U.-R. Khan et al. / Energy Conversion and Management 44 (2003) 2073–2091
  • 9. V ¼ _mma hDAV Z Wo Wi dW Ws;w À W ð8Þ The integral in the above equation is solved numerically. The number of transfer units of the tower is calculated by NTU ¼ hDAV V = _mma ¼ Z Wo Wi dW Ws;w À W ð9Þ The cooling tower effectiveness ðeÞ is defined as the ratio of the actual energy transfer to the maximum possible energy transfer e ¼ ho À hi hs;w;i À hi ð10Þ Correlations for the heat and mass transfer of cooling towers in terms of physical parameters do not exist. It is usually necessary to correlate the tower performance data for specific tower designs. Mass transfer data are typically correlated in the form [18]: hDAV V _mmw ¼ c _mmw _mma !n ð11Þ where c and n are empirical constants specific to a particular tower design. Multiplying both sides of the above equation by ð _mmw= _mmaÞ and considering the definition for NTU (refer to Eq. (9)) gives the empirical value of NTU as NTUem ¼ c _mmw _mma !nþ1 ð12Þ The coefficients c and n of the above equation were fit to the measurements of Simpson and Sherwood [19] for four different tower designs over a range of performance conditions by Braun et al. [6]. Their experimental values were also compared with the values obtained by our model, and the results are discussed in Khan and Zubair [16]. It was shown that the calculated and empirical values of NTU are well within acceptable limits. Also, the wet bulb temperature of the outlet air ðtwb;oÞ calculated from the present model is compared with the experimental values reported in Simpson and Sherwood [19], and the two values are very close to each other (within Æ0.6%). 4. Performance characteristics It is commonly believed that the evaporation heat transfer rate inside the cooling tower is much greater than the convective heat transfer rate. To investigate the contribution of evaporation heat transfer in a cooling tower, a study is conducted on a water droplet as it moves from the top to the bottom of the tower, whereas the air that is used to cool the water is forced from the bottom of the tower in a counter flow arrangement. In this regard, the heat transfer rates from a single water droplet (of 3 mm diameter) inside the cooling tower due to convection and evaporation were expressed, respectively, as J.-U.-R. Khan et al. / Energy Conversion and Management 44 (2003) 2073–2091 2081
  • 10. _QQconv ¼ hcAV ðtw À tdbÞ ð13Þ _QQevap ¼ hDAV ðWs;w À WaÞhfg;w ð14Þ The computer program for simulating the performance of the cooling tower, explained in the previous section, was used for analyzing the heat transfer rates for the following set of input data: tdb;i ¼ 29:0 °C, twb;i ¼ 21:11 °C, tw;i ¼ 28:72 °C, tw;o ¼ 24:22 °C, hDAV ¼ 3:025 kg/s m3 , Le ¼ 0:9 and _mma ¼ 1:187 kg/s. At each incremental control volume, measured from the top of the tower, the program calculates the thermodynamic properties of the air–water mixture that are then used to calculate the heat transfer rates from the water droplet by using Eqs. (13) and (14). The results from the program are plotted in Figs. 5–19. In these figures, the effects of water to air mass flow rate ratios on the air–water temperatures, as well as the driving potential for convective–evapo- rative heat transfer rates are investigated. In this regard, the ratio of mass flow rate of water to mass flow rate of air, _mmw= _mma, is varied from 0.5 to 1.5 at an interval of 0.5. Fig. 5 is a plot of the air and water temperatures versus volume of tower. The water falls from the top and its temperature, tw, decreases continuously as it approaches the bottom of the tower. This is generally expected in a cooling tower because the water loses heat both by convection and evaporation. It is interesting to see that the air, which enters from the bottom of the tower with initial dry bulb temperature, tdb, decreases in temperature and then increases before leaving from the top of the tower. This can be explained from the fact that the water, which enters from the top of the tower, when it reaches the lower part, is cooled because of a predominantly evaporation mechanism. In this region, the water temperature, tw, is much lower than the entering air dry bulb temperature, tdb, however, as we note from Fig. 5, when the tower volume from the top reaches 0 0.2 0.4 0.6 0.8 20 22 24 26 28 30 tdb tw twb Temperature(°C) Volume of Tower "V" m3 Fig. 5. Variation of dry and wet bulb temperature of air and water temperature with volume of tower for _mmw= _mma ¼ 0:50. 2082 J.-U.-R. Khan et al. / Energy Conversion and Management 44 (2003) 2073–2091
  • 11. above 0.15 m3 , the water temperature is less than tdb. This results in heat transfer from the air to the water (i.e. negative convection). The intersection point of the tdb and tw curves indicates no 20 22 24 26 28 30 tdb tw twb 0 0.2 0.4 0.6 0.8 Temperature(°C) Volume of Tower "V" m3 Fig. 6. Variation of dry and wet bulb temperature of air and water temperature with volume of tower for _mmw= _mma ¼ 1:00. 20 22 24 26 28 30 tdb tw twb 0 0.2 0.4 0.6 0.8 Temperature(°C) Volume of Tower "V" m3 Fig. 7. Variation of dry and wet bulb temperature of air and water temperature with volume of tower for _mmw= _mma ¼ 1:50. J.-U.-R. Khan et al. / Energy Conversion and Management 44 (2003) 2073–2091 2083
  • 12. temperature difference. At this point, there is no convection heat exchange between the water and the air. Furthermore, below this point tdb is less than tw, which results in heat transfer from the water to the air (i.e. positive convection). As expected, the wet bulb temperature of the air twb Fig. 8. Variation of driving potential for convection and evaporation heat transfer with volume of tower for _mmw= _mma ¼ 0:50. Fig. 9. Variation of driving potential for convection and evaporation heat transfer with volume of tower for _mmw= _mma ¼ 1:00. 2084 J.-U.-R. Khan et al. / Energy Conversion and Management 44 (2003) 2073–2091
  • 13. decreases continuously in the tower from the top to the bottom. It approaches the water outlet temperature at the bottom of the tower. Fig. 10. Variation of driving potential for convection and evaporation heat transfer with volume of tower for _mmw= _mma ¼ 1:50. -1 0 1 2 3 Qevap Qtotal Qconv 0 0.2 0.4 0.6 0.8 HeatRates"Q"(Watts) Volume of Tower "V" m3 Fig. 11. Variation of heat rates with volume of tower for _mmw= _mma ¼ 0:50. J.-U.-R. Khan et al. / Energy Conversion and Management 44 (2003) 2073–2091 2085
  • 14. The effect of mass flow rate ratio _mmw= _mma is investigated by varying the mass flow rate of water, _mmw, while keeping the air flow rate, _mma, constant. The results are shown in Figs. 5–7. We note that Qevap Qtotal Qconv -1 0 1 2 3 0 0.2 0.4 0.6 0.8 HeatRates"Q"(Watts) Volume of Tower "V" m3 Fig. 12. Variation of heat rates with volume of tower for _mmw= _mma ¼ 1:00. Qevap Qtotal Qconv -1 0 1 2 3 0 0.2 0.4 0.6 0.8 HeatRates"Q"(Watts) Volume of Tower "V" m3 Fig. 13. Variation of heat rates with volume of tower for _mmw= _mma ¼ 1:50. 2086 J.-U.-R. Khan et al. / Energy Conversion and Management 44 (2003) 2073–2091
  • 15. with the increase in water mass flow rate, the dry bulb temperature of the air decreases over a relatively small height of the tower, and also the temperature drop of water is less with the in- crease in _mmw. This can be explained from the fact that with an increase in mass flow rate ratio, more water is to be cooled for a given tower volume. Therefore, one would expect that the surface Fig. 14. Variation of percent heat rates with volume of tower for _mmw= _mma ¼ 0:50. Fig. 15. Variation of percent heat rates with volume of tower for _mmw= _mma ¼ 1:00. J.-U.-R. Khan et al. / Energy Conversion and Management 44 (2003) 2073–2091 2087
  • 16. area required both for convection and evaporation will be reduced, resulting in higher water outlet temperatures and reduced heat transfer rates. The driving potentials for evaporative heat transfer ðWs;w À WaÞ and convective heat transfer ðtw À tdbÞ versus tower volume are presented in Figs. 8–10 for _mmw= _mma varying from 0.5 to 1.5 at an interval of 0.5. We note that the humidity ratio of saturated moist air, Ws;w decreases with tower volume measured from the top because the water temperature decreases as it moves down, while Fig. 16. Variation of percent heat rates with volume of tower for _mmw= _mma ¼ 1:50. 75 50 0 0.04 0.01 0.03 0.02 50 75 100 125 25 30 100 125 150 175 200 225 250 275 Enthalpy (kJ/kg of dry air) RH = 20% 0.08 0.06 0.04 0.02 0 Dry Bulb Temperature (°C) 10 20 30 40 50 60 HumidityRatio(kgofmoisture/kgofdryair) Fig. 17. Process line of water cooling in cooling tower for _mmw= _mma ¼ 0:50. 2088 J.-U.-R. Khan et al. / Energy Conversion and Management 44 (2003) 2073–2091
  • 17. the humidity ratio of moist air, Wa increases with tower volume measured from the bottom because the air absorbs moisture as it move upwards. These figures show that the potential for evaporation decreases first and then increases with the tower volume, particularly for _mmw= _mma ¼ 0:5. However, for _mmw= _mma P 1:0, the potential increases with tower volume. On the other hand, the driving po- tential for convection heat transfer ðtw À tdbÞ decreases with tower volume, and it becomes negative after reaching some height of the tower. It, therefore, results in a negative convective heat transfer in the tower (from water to air). As explained above, the negative convection in the tower occurs when the water temperature is lower than the air dry bulb temperature. 75 50 0 0.04 0.01 0.03 0.02 50 75 100 125 25 30 100 125 150 175 200 225 250 275 Enthalpy (kJ/kg of dry air) RH = 20% 0.08 0.06 0.04 0.02 0 Dry Bulb Temperature (°C) 10 20 30 40 50 60 HumidityRatio(kgofmoisture/kgofdryair) Fig. 18. Process line of water cooling in cooling tower for _mmw= _mma ¼ 1:00. 75 50 0 0.04 0.01 0.03 0.02 50 75 100 125 25 30 100 125 150 175 200 225 250 275 Enthalpy (kJ/kg of dry air) RH = 20% 0.08 0.06 0.04 0.02 0 Dry Bulb Temperature (°C) 10 20 30 40 50 60 HumidityRatio(kgofmoisture/kgofdryair) Fig. 19. Process line of water cooling in cooling tower for _mmw= _mma ¼ 1:50. J.-U.-R. Khan et al. / Energy Conversion and Management 44 (2003) 2073–2091 2089
  • 18. The convection and evaporation heat transfer rates _QQconv, _QQevap and _QQtotalð¼ _QQconv þ _QQevapÞ are plotted as a function of tower volume measured from the top of the tower in Figs. 11–13. These figures show that the heat transfer rates are high in the top portions of the tower and decrease as the water moves from the top to the bottom of the tower, particularly for _mmw= _mma 6 1. These figures, however, indicate that the total heat rate increases for _mmw= _mma P 1 and is mainly controlled by the evaporation mechanism. In the region where the heat transfer is taking place from air to water; i.e. negative convection, the evaporation heat rates are generally high. These figures clearly show that evaporation is basically controlling the total heat flow in a cooling tower. The percentage heat rates due to convection and evaporation PQconv and PQevap, are plotted in Figs. 14–16 as a function of tower volume for different mass flow rate ratios, _mmw= _mma. As discussed above, _QQconv decreases with _mmw= _mma. Therefore, a high percentage is noted for _mmw= _mma less than 1.0, particularly in the region where the convection is taking place from air to water, i.e. the convection component is negative. These figures clearly show that the percentage of the evapo- ration component is always positive and is highest for low mass flow rate ratios. The process lines of the air on a psychometric chart are presented in Figs. 17–19 for different values of _mmw= _mma. These curves show that the dry bulb temperature at the outlet of the tower is always less than that at the inlet for the conditions investigated in this study. However, the relative humidity and the specific humidity of the air increase as the air moves from the bottom to the top of the tower. This implies that the air is also going to cool in the tower, along with the water, because of evaporation of water in the tower. It should be noted that when water evaporates in the tower, it needs heat that is taken from both water and air. Therefore, one would expect the possibility of cooling both air and water in the tower. 5. Concluding remarks A reliable computer model of a counter flow wet cooling tower has been used to study the heat transfer mechanisms from a water droplet as it moves from the top to the bottom of the tower, while the air is forced vertically upward. It is clearly demonstrated that the water temperature, tw, decreases continuously as it approaches the bottom of the tower. However, air, which acts as a coolant, enters from the bottom of the tower, initially at its dry bulb temperature, tdb, decreases in temperature and then increases before leaving from the top of the tower. This cooling phenomenon of the air, i.e. negative convection, in some parts of the tower, along with the water, is explained due to evaporation of the water in the tower. It is demonstrated that in the negative convection region of the tower, the evaporation rates are generally high. The effect of water to air mass flow rate ratio, _mmw= _mma, is investigated by varying the mass flow rate of water, _mmw, while keeping the air flow rate, _mma, constant. The results clearly demonstrate that with an increase in water mass flow rate for the same fill packing, the surface area required both for convection and evaporation is reduced, re- sulting in higher water outlet temperatures and reduced heat transfer rates. Acknowledgements The authors acknowledge the support provided by King Fahd University of Petroleum and Minerals through the research project (ME/RISK-FOULING/230). 2090 J.-U.-R. Khan et al. / Energy Conversion and Management 44 (2003) 2073–2091
  • 19. References [1] Walker WH, Lewis WK, McAdams WH, Gilliland ER. Principles of chemical engineering. 3rd ed. New York: McGraw-Hill Inc; 1923. [2] Merkel F. Verdunstungshuhlung. Zeitschrift des Vereines Deutscher Ingenieure (VDI) 1925;70:123–8. [3] Webb RL. A unified theoretical treatment for thermal analysis of cooling towers, evaporative condensers, and fluid coolers. ASHRAE Trans 1984;90(2):398–415. [4] Webb RL, Villacres A. Algorithms for performance simulation of cooling towers, evaporative condensers, and fluid coolers. ASHRAE Trans 1984;90(2):416–58. [5] Jaber H, Webb RL. Design of cooling towers by the effectiveness-NTU method. ASME J Heat Transf 1989;111(4):837–43. [6] Braun JE, Klein SA, Mitchell JW. Effectiveness models for cooling towers and cooling coils. ASHRAE Trans 1989;95(2):164–74. [7] El-Dessouky HTA, Al-Haddad A, Al-Juwayhel F. A modified analysis of counter flow cooling towers. ASME J Heat Transf 1997;119(3):617–26. [8] Jorge F, Armando CO. Thermal behavior of closed wet cooling towers for use with chilled ceilings. Appl Therm Eng 2000;20:1225–36. [9] Bernier MA. Cooling tower performance: theory and experiments. ASHRAE Trans 1994;100(2):114–21. [10] Bernier MA. Thermal performance of cooling towers. ASHRAE J 1995;37(4):56–61. [11] Nimr MA. Modeling the dynamic thermal behavior of cooling towers containing packing materials. Heat Transf Eng 1999;20(1):91–6. [12] Jose AS. The use of thermo-fluid dynamic efficiency in cooling towers. Heat Transf Eng 2002;23:22–30. [13] Hyland RW, Wexler A. Formulations for the thermodynamic properties of the saturated phases of H2O from 173.15 to 473.15 K. ASHRAE Trans 1983;89(2):500–20. [14] Hyland RW, Wexler A. Formulations for the thermodynamic properties of dry air from 173.15 to 473.15 K, and of saturated moist air from 173.15 to 372.15 K, at pressure to 5 MPa. ASHRAE Trans 1983;89(2):520–35. [15] Kuehn TH, Ramsey JW, Threlkeld JL. Thermal environmental engineering. 3rd ed. New Jersey: Prentice-Hall Inc; 1998. [16] Khan JR, Zubair SM. An improved design and rating analyses of counter flow wet cooling towers. ASME J Heat Transf 2001;123:770–8. [17] ASHRAE handbook of fundamentals. Atlanta, GA: American Society of Heating, Refrigerating, and Air- Conditioning Engineers, Inc; 1993, Chapter 6. [18] ASHRAE equipment guide. Atlanta, GA: American Society of Heating, Refrigerating, and Air-Conditioning Engineers, Inc; 1983, [chapter 3]. [19] Simpson WM, Sherwood TK. Performance of small mechanical draft cooling towers. Refrig Eng 1946;52(6):525– 43, 574–6. J.-U.-R. Khan et al. / Energy Conversion and Management 44 (2003) 2073–2091 2091