SlideShare a Scribd company logo
1 of 62
Download to read offline
Introduction to MachineIntroduction to Machine
Learning on IBM WatsonLearning on IBM Watson
StudioStudio
Upkar Lidder 
 
Developer Advocate, IBM  
 
 
> ulidder@us.ibm.com 
> @lidderupk 
> upkar.dev  http://bit.ly/waston-ml-sign
PrerequisitesPrerequisites
@lidderupkIBM Developer
1. Create IBM Cloud Account using THIS URL
3. If you already have an account, use the above URL to sign into your
IBM Cloud account.
2. Check your email and activate your account. Once activated, log back
into your IBM Cloud account using the link above.
http://bit.ly/waston-ml-sign
Watson Studio & Watson Machine LearningWatson Studio & Watson Machine Learning
@lidderupkIBM Developer
Watson StudioWatson Studio
IBM Watson Studio IBM Watson Studio 
@lidderupkIBM Developer
IBM Watson Studio IBM Watson Studio 
@lidderupkIBM Developer
Workshop -Workshop - GoalsGoals
@lidderupkIBM Developer
Successfully Create, Store and 
Deploy a Linear Regression Model 
on IBM Cloud using Watson Studio 
and Watson Machine Learning 
Services.
Question -Question - predict median house price for Boston areapredict median house price for Boston area
@lidderupkIBM Developer
Linear regressionLinear regression - Simple- Simple
@lidderupkIBM Developer
Median
HousePrice
Another Variable
Y = ⍺ + βx
StepsSteps
@lidderupkIBM Developer
1. Sign up / Log into IBM Cloud - http://bit.ly/waston-ml-sign
2. Create Watson Studio Service.
3. Sign into Watson Studio and create a new Data Science
Project. It also creates a Cloud Object Store for you.
4. Associate a Machine Learning Service with your project.
5. Upload csv data to your project.
6. Add a new Machine Learning Model to your project.
7. Create a Linear Regression Model and save it to IBM Cloud.
8. Create a new deployment on IBM Cloud.
9. Test your model !
Step 1 -Step 1 - sign up/ log into IBM Cloudsign up/ log into IBM Cloud
@lidderupkIBM Developer
http://bit.ly/waston-ml-sign
Step 2 -Step 2 - locate Watson Studio in Cataloglocate Watson Studio in Catalog
@lidderupkIBM Developer
Step 3 -Step 3 - create Watson Studio instancecreate Watson Studio instance
@lidderupkIBM Developer
Step 4 -Step 4 - launch Watson Studiolaunch Watson Studio
@lidderupkIBM Developer
Step 5 -Step 5 - create a new projectcreate a new project
@lidderupkIBM Developer
Step 6 -Step 6 - pick Data Science starterpick Data Science starter
@lidderupkIBM Developer
Step 7 -Step 7 - give the project a name and assign COSgive the project a name and assign COS
@lidderupkIBM Developer
Step 8 -Step 8 - open asset tabopen asset tab
@lidderupkIBM Developer
Step 9 -Step 9 - drag and drop data file into Load Assetsdrag and drop data file into Load Assets
@lidderupkIBM Developer
http://bit.ly/boston-house-csv
Step 10 -Step 10 - add Machine Learning model to the projectadd Machine Learning model to the project
@lidderupkIBM Developer
Step 11 - associate a ML instanceStep 11 - associate a ML instance
@lidderupkIBM Developer
Step 12a -Step 12a - create ML instance if you don't have onecreate ML instance if you don't have one
@lidderupkIBM Developer
Step 12b -Step 12b - create a new lite ML instancecreate a new lite ML instance
@lidderupkIBM Developer
Step 12c -Step 12c - create a new lite ML instancecreate a new lite ML instance
Step 12d -Step 12d - reload the ML service sectionreload the ML service section
@lidderupkIBM Developer
Step 13 -Step 13 - pick new service and create a model manuallypick new service and create a model manually
@lidderupkIBM Developer
Step 14 -Step 14 - pick the Boston data file aspick the Boston data file as data assetdata asset
@lidderupkIBM Developer
Step 15 -Step 15 - pick target, input features and model typepick target, input features and model type
@lidderupkIBM Developer
Step 16 -Step 16 - add estimator(s)add estimator(s)
@lidderupkIBM Developer
Step 17 -Step 17 - change hyperparameters (optional)change hyperparameters (optional)
@lidderupkIBM Developer
Step 18 -Step 18 - save/store the trained model on IBM Cloudsave/store the trained model on IBM Cloud
@lidderupkIBM Developer
Step 19 -Step 19 - add a new deploymentadd a new deployment
@lidderupkIBM Developer
1
2
Step 20 -Step 20 - ensure that deployment is successfulensure that deployment is successful
@lidderupkIBM Developer
Step 21a -Step 21a - implementation / test the deployed modelimplementation / test the deployed model
@lidderupkIBM Developer
{
"fields": ["CRIM", "ZN", "INDUS", "CHAS", "NOX", "RM", "AGE", "DIS", "RAD", "TAX", "PTRATIO", "B", "LSTAT"],
"values": [
[0.00632, 18, 2.31, 0, 0.538, 6.575, 66, 4.09, 1, 296, 15.3, 396.9, 4.99]
]
}
1
2
3
4
5
6
Step 21b -Step 21b - implementation / test the deployed modelimplementation / test the deployed model
@lidderupkIBM Developer
Watson Studio - Binary ClassificationWatson Studio - Binary Classification
@lidderupkIBM Developer
Watson Studio - Multiclass ClassificationWatson Studio - Multiclass Classification
@lidderupkIBM Developer
Watson Studio - RegressionWatson Studio - Regression
Watson Machine LearningWatson Machine Learning
WML -WML - Supported Frameworks as of 06.21.19Supported Frameworks as of 06.21.19
@lidderupkIBM Developer
IBM Watson Machine Learning IBM Watson Machine Learning 
@lidderupkIBM Developer
IBM Watson Machine Learning Client IBM Watson Machine Learning Client 
@lidderupkIBM Developer http://wml-api-pyclient.mybluemix.net/index.html
WML -WML - create scikit-learn linear regression modelcreate scikit-learn linear regression model
@lidderupkIBM Developer
from sklearn.linear_model import LinearRegression
from sklearn.datasets import load_boston
import matplotlib.pyplot as plt
from sklearn.model_selection import train_test_split
from sklearn.metrics import mean_squared_error, r2_score
1
2
3
4
5
6
boston = load_boston()7
X_train, X_test, y_train, y_test = train_test_split(boston.data, boston.target)8
9
# Create a new Linear Regression Model10
LR_model = LinearRegression()11
12
# Train the model13
LR_model.fit(X_train, y_train)14
15
# store actual and predited data to draw chart16
predicted = LR_model.predict(X_test)17
actual = y_test18
19
20
# The coefficients21
print('Coefficients: n', LR_model.coef_)22
# The mean squared error23
print("Mean squared error: %.2f"24
% mean_squared_error(actual, predicted))25
# Explained variance score: 1 is perfect prediction26
print('Variance score: %.2f' % r2_score(actual, predicted))27
Output
WML -WML - create scikit-learn linear regression modelcreate scikit-learn linear regression model
@lidderupkIBM Developer
from sklearn.linear_model import LinearRegression
from sklearn.datasets import load_boston
import matplotlib.pyplot as plt
from sklearn.model_selection import train_test_split
from sklearn.metrics import mean_squared_error, r2_score
1
2
3
4
5
6
boston = load_boston()7
X_train, X_test, y_train, y_test = train_test_split(boston.data, boston.target)8
9
# Create a new Linear Regression Model10
LR_model = LinearRegression()11
12
# Train the model13
LR_model.fit(X_train, y_train)14
15
# store actual and predited data to draw chart16
predicted = LR_model.predict(X_test)17
actual = y_test18
19
20
# The coefficients21
print('Coefficients: n', LR_model.coef_)22
# The mean squared error23
print("Mean squared error: %.2f"24
% mean_squared_error(actual, predicted))25
# Explained variance score: 1 is perfect prediction26
print('Variance score: %.2f' % r2_score(actual, predicted))27
boston = load_boston()
X_train, X_test, y_train, y_test = train_test_split(boston.data, boston.target)
from sklearn.linear_model import LinearRegression1
from sklearn.datasets import load_boston2
import matplotlib.pyplot as plt3
from sklearn.model_selection import train_test_split4
from sklearn.metrics import mean_squared_error, r2_score5
6
7
8
9
# Create a new Linear Regression Model10
LR_model = LinearRegression()11
12
# Train the model13
LR_model.fit(X_train, y_train)14
15
# store actual and predited data to draw chart16
predicted = LR_model.predict(X_test)17
actual = y_test18
19
20
# The coefficients21
print('Coefficients: n', LR_model.coef_)22
# The mean squared error23
print("Mean squared error: %.2f"24
% mean_squared_error(actual, predicted))25
# Explained variance score: 1 is perfect prediction26
print('Variance score: %.2f' % r2_score(actual, predicted))27
# Create a new Linear Regression Model
LR_model = LinearRegression()
from sklearn.linear_model import LinearRegression1
from sklearn.datasets import load_boston2
import matplotlib.pyplot as plt3
from sklearn.model_selection import train_test_split4
from sklearn.metrics import mean_squared_error, r2_score5
6
boston = load_boston()7
X_train, X_test, y_train, y_test = train_test_split(boston.data, boston.target)8
9
10
11
12
# Train the model13
LR_model.fit(X_train, y_train)14
15
# store actual and predited data to draw chart16
predicted = LR_model.predict(X_test)17
actual = y_test18
19
20
# The coefficients21
print('Coefficients: n', LR_model.coef_)22
# The mean squared error23
print("Mean squared error: %.2f"24
% mean_squared_error(actual, predicted))25
# Explained variance score: 1 is perfect prediction26
print('Variance score: %.2f' % r2_score(actual, predicted))27
# Train the model
LR_model.fit(X_train, y_train)
from sklearn.linear_model import LinearRegression1
from sklearn.datasets import load_boston2
import matplotlib.pyplot as plt3
from sklearn.model_selection import train_test_split4
from sklearn.metrics import mean_squared_error, r2_score5
6
boston = load_boston()7
X_train, X_test, y_train, y_test = train_test_split(boston.data, boston.target)8
9
# Create a new Linear Regression Model10
LR_model = LinearRegression()11
12
13
14
15
# store actual and predited data to draw chart16
predicted = LR_model.predict(X_test)17
actual = y_test18
19
20
# The coefficients21
print('Coefficients: n', LR_model.coef_)22
# The mean squared error23
print("Mean squared error: %.2f"24
% mean_squared_error(actual, predicted))25
# Explained variance score: 1 is perfect prediction26
print('Variance score: %.2f' % r2_score(actual, predicted))27
# store actual and predited data to draw chart
predicted = LR_model.predict(X_test)
actual = y_test
from sklearn.linear_model import LinearRegression1
from sklearn.datasets import load_boston2
import matplotlib.pyplot as plt3
from sklearn.model_selection import train_test_split4
from sklearn.metrics import mean_squared_error, r2_score5
6
boston = load_boston()7
X_train, X_test, y_train, y_test = train_test_split(boston.data, boston.target)8
9
# Create a new Linear Regression Model10
LR_model = LinearRegression()11
12
# Train the model13
LR_model.fit(X_train, y_train)14
15
16
17
18
19
20
# The coefficients21
print('Coefficients: n', LR_model.coef_)22
# The mean squared error23
print("Mean squared error: %.2f"24
% mean_squared_error(actual, predicted))25
# Explained variance score: 1 is perfect prediction26
print('Variance score: %.2f' % r2_score(actual, predicted))27
# The coefficients
print('Coefficients: n', LR_model.coef_)
# The mean squared error
print("Mean squared error: %.2f"
% mean_squared_error(actual, predicted))
# Explained variance score: 1 is perfect prediction
print('Variance score: %.2f' % r2_score(actual, predicted))
from sklearn.linear_model import LinearRegression1
from sklearn.datasets import load_boston2
import matplotlib.pyplot as plt3
from sklearn.model_selection import train_test_split4
from sklearn.metrics import mean_squared_error, r2_score5
6
boston = load_boston()7
X_train, X_test, y_train, y_test = train_test_split(boston.data, boston.target)8
9
# Create a new Linear Regression Model10
LR_model = LinearRegression()11
12
# Train the model13
LR_model.fit(X_train, y_train)14
15
# store actual and predited data to draw chart16
predicted = LR_model.predict(X_test)17
actual = y_test18
19
20
21
22
23
24
25
26
27
Output
WML -WML - evaluation metricsevaluation metrics
@lidderupkIBM Developer
WML -WML - get Machine Learning service credentialsget Machine Learning service credentials
@lidderupkIBM Developer
WML -WML - save scikit-learn linear regression modelsave scikit-learn linear regression model
@lidderupkIBM Developer
# we will use WML to work with IBM Machine Learning Service1
from watson_machine_learning_client import WatsonMachineLearningAPIClient2
3
# Grab your credentials from the Watson Service section in Watson Studio or IBM Cloud Dashboard4
wml_credentials = {5
}6
7
# Instantiate WatsonMachineLearningAPIClient8
from watson_machine_learning_client import WatsonMachineLearningAPIClient9
client = WatsonMachineLearningAPIClient( wml_credentials )10
11
# store the model12
published_model = client.repository.store_model(model=LR_model,13
meta_props={'name':'upkar-housing-linear-reg'},14
training_data=X_train, training_target=y_train)15
# Grab your credentials from the Watson Service section in Watson Studio or IBM Cloud Dashboard
wml_credentials = {
}
# we will use WML to work with IBM Machine Learning Service1
from watson_machine_learning_client import WatsonMachineLearningAPIClient2
3
4
5
6
7
# Instantiate WatsonMachineLearningAPIClient8
from watson_machine_learning_client import WatsonMachineLearningAPIClient9
client = WatsonMachineLearningAPIClient( wml_credentials )10
11
# store the model12
published_model = client.repository.store_model(model=LR_model,13
meta_props={'name':'upkar-housing-linear-reg'},14
training_data=X_train, training_target=y_train)15
# Instantiate WatsonMachineLearningAPIClient
from watson_machine_learning_client import WatsonMachineLearningAPIClient
client = WatsonMachineLearningAPIClient( wml_credentials )
# we will use WML to work with IBM Machine Learning Service1
from watson_machine_learning_client import WatsonMachineLearningAPIClient2
3
# Grab your credentials from the Watson Service section in Watson Studio or IBM Cloud Dashboard4
wml_credentials = {5
}6
7
8
9
10
11
# store the model12
published_model = client.repository.store_model(model=LR_model,13
meta_props={'name':'upkar-housing-linear-reg'},14
training_data=X_train, training_target=y_train)15
# store the model
published_model = client.repository.store_model(model=LR_model,
meta_props={'name':'upkar-housing-linear-reg'},
training_data=X_train, training_target=y_train)
# we will use WML to work with IBM Machine Learning Service1
from watson_machine_learning_client import WatsonMachineLearningAPIClient2
3
# Grab your credentials from the Watson Service section in Watson Studio or IBM Cloud Dashboard4
wml_credentials = {5
}6
7
# Instantiate WatsonMachineLearningAPIClient8
from watson_machine_learning_client import WatsonMachineLearningAPIClient9
client = WatsonMachineLearningAPIClient( wml_credentials )10
11
12
13
14
15
WML -WML - deploy scikit-learn linear regression modeldeploy scikit-learn linear regression model
@lidderupkIBM Developer
import json1
2
# grab the model from IBM Cloud3
published_model_uid = client.repository.get_model_uid(published_model)4
5
# create a new deployment for the model6
model_deployed = client.deployments.create(published_model_uid, "Deployment of scikit model")7
8
#get the scoring endpoint9
scoring_endpoint = client.deployments.get_scoring_url(model_deployed)10
print(scoring_endpoint)11
12
#use the scoring endpoint to predict house median price some test data13
scoring_payload = {"values": [list(X_test[0]), list(X_test[1])]}14
predictions = client.deployments.score(scoring_endpoint, scoring_payload)15
print(json.dumps(predictions, indent=2))16
# grab the model from IBM Cloud
published_model_uid = client.repository.get_model_uid(published_model)
# create a new deployment for the model
model_deployed = client.deployments.create(published_model_uid, "Deployment of scikit model")
import json1
2
3
4
5
6
7
8
#get the scoring endpoint9
scoring_endpoint = client.deployments.get_scoring_url(model_deployed)10
print(scoring_endpoint)11
12
#use the scoring endpoint to predict house median price some test data13
scoring_payload = {"values": [list(X_test[0]), list(X_test[1])]}14
predictions = client.deployments.score(scoring_endpoint, scoring_payload)15
print(json.dumps(predictions, indent=2))16
#get the scoring endpoint
scoring_endpoint = client.deployments.get_scoring_url(model_deployed)
print(scoring_endpoint)
import json1
2
# grab the model from IBM Cloud3
published_model_uid = client.repository.get_model_uid(published_model)4
5
# create a new deployment for the model6
model_deployed = client.deployments.create(published_model_uid, "Deployment of scikit model")7
8
9
10
11
12
#use the scoring endpoint to predict house median price some test data13
scoring_payload = {"values": [list(X_test[0]), list(X_test[1])]}14
predictions = client.deployments.score(scoring_endpoint, scoring_payload)15
print(json.dumps(predictions, indent=2))16
#use the scoring endpoint to predict house median price some test data
scoring_payload = {"values": [list(X_test[0]), list(X_test[1])]}
predictions = client.deployments.score(scoring_endpoint, scoring_payload)
print(json.dumps(predictions, indent=2))
import json1
2
# grab the model from IBM Cloud3
published_model_uid = client.repository.get_model_uid(published_model)4
5
# create a new deployment for the model6
model_deployed = client.deployments.create(published_model_uid, "Deployment of scikit model")7
8
#get the scoring endpoint9
scoring_endpoint = client.deployments.get_scoring_url(model_deployed)10
print(scoring_endpoint)11
12
13
14
15
16
WML -WML - deploy scikit-learn linear regression modeldeploy scikit-learn linear regression model
@lidderupkIBM Developer
WML -WML - try it out on your own !try it out on your own !
@lidderupkIBM Developer
http://bit.ly/waston-ml-sign
@lidderupkIBM Developer
WML -WML - create a new notebook from URLcreate a new notebook from URL
Grab the FULL URL from : http://bit.ly/boston-house-notebook
Thank youThank you
 
Let's chat !Let's chat !
@lidderupkIBM Developer
Upkar Lidder, IBM
 
@lidderupk
https://github.com/lidderupk/
ulidder@us.ibm.com

More Related Content

What's hot

Spring framework Controllers and Annotations
Spring framework   Controllers and AnnotationsSpring framework   Controllers and Annotations
Spring framework Controllers and AnnotationsAnuj Singh Rajput
 
Overview of JPA (Java Persistence API) v2.0
Overview of JPA (Java Persistence API) v2.0Overview of JPA (Java Persistence API) v2.0
Overview of JPA (Java Persistence API) v2.0Bryan Basham
 
Simulated Binary Crossover
Simulated Binary CrossoverSimulated Binary Crossover
Simulated Binary Crossoverpaskorn
 
Building Random Forest at Scale
Building Random Forest at ScaleBuilding Random Forest at Scale
Building Random Forest at ScaleSri Ambati
 
Inference in Bayesian Networks
Inference in Bayesian NetworksInference in Bayesian Networks
Inference in Bayesian Networksguestfee8698
 
Generative adversarial networks slides- Auckland AI & ML Meetup
Generative adversarial networks slides- Auckland AI & ML MeetupGenerative adversarial networks slides- Auckland AI & ML Meetup
Generative adversarial networks slides- Auckland AI & ML MeetupShamane Siriwardhana
 
Regulating Generative AI - LLMOps pipelines with Transparency
Regulating Generative AI - LLMOps pipelines with TransparencyRegulating Generative AI - LLMOps pipelines with Transparency
Regulating Generative AI - LLMOps pipelines with TransparencyDebmalya Biswas
 
Ai lecture 07(unit03)
Ai lecture  07(unit03)Ai lecture  07(unit03)
Ai lecture 07(unit03)vikas dhakane
 
Artificial Neural Network | Deep Neural Network Explained | Artificial Neural...
Artificial Neural Network | Deep Neural Network Explained | Artificial Neural...Artificial Neural Network | Deep Neural Network Explained | Artificial Neural...
Artificial Neural Network | Deep Neural Network Explained | Artificial Neural...Simplilearn
 
Machine Learning with Azure Cognitive Services - Face Recognition and Deep Fa...
Machine Learning with Azure Cognitive Services - Face Recognition and Deep Fa...Machine Learning with Azure Cognitive Services - Face Recognition and Deep Fa...
Machine Learning with Azure Cognitive Services - Face Recognition and Deep Fa...CodeOps Technologies LLP
 
An introduction to computer vision with Hugging Face
An introduction to computer vision with Hugging FaceAn introduction to computer vision with Hugging Face
An introduction to computer vision with Hugging FaceJulien SIMON
 
AWS Summit London 2019 - Containers on AWS
AWS Summit London 2019 - Containers on AWSAWS Summit London 2019 - Containers on AWS
AWS Summit London 2019 - Containers on AWSMassimo Ferre'
 
Large Language Models Bootcamp
Large Language Models BootcampLarge Language Models Bootcamp
Large Language Models BootcampData Science Dojo
 
Explainable AI in Industry (KDD 2019 Tutorial)
Explainable AI in Industry (KDD 2019 Tutorial)Explainable AI in Industry (KDD 2019 Tutorial)
Explainable AI in Industry (KDD 2019 Tutorial)Krishnaram Kenthapadi
 
Feature Engineering
Feature Engineering Feature Engineering
Feature Engineering odsc
 
Explainable AI (XAI) - A Perspective
Explainable AI (XAI) - A Perspective Explainable AI (XAI) - A Perspective
Explainable AI (XAI) - A Perspective Saurabh Kaushik
 
Trusted, Transparent and Fair AI using Open Source
Trusted, Transparent and Fair AI using Open SourceTrusted, Transparent and Fair AI using Open Source
Trusted, Transparent and Fair AI using Open SourceAnimesh Singh
 

What's hot (20)

Spring framework Controllers and Annotations
Spring framework   Controllers and AnnotationsSpring framework   Controllers and Annotations
Spring framework Controllers and Annotations
 
Overview of JPA (Java Persistence API) v2.0
Overview of JPA (Java Persistence API) v2.0Overview of JPA (Java Persistence API) v2.0
Overview of JPA (Java Persistence API) v2.0
 
Simulated Binary Crossover
Simulated Binary CrossoverSimulated Binary Crossover
Simulated Binary Crossover
 
Building Random Forest at Scale
Building Random Forest at ScaleBuilding Random Forest at Scale
Building Random Forest at Scale
 
Inference in Bayesian Networks
Inference in Bayesian NetworksInference in Bayesian Networks
Inference in Bayesian Networks
 
Generative adversarial networks slides- Auckland AI & ML Meetup
Generative adversarial networks slides- Auckland AI & ML MeetupGenerative adversarial networks slides- Auckland AI & ML Meetup
Generative adversarial networks slides- Auckland AI & ML Meetup
 
Regulating Generative AI - LLMOps pipelines with Transparency
Regulating Generative AI - LLMOps pipelines with TransparencyRegulating Generative AI - LLMOps pipelines with Transparency
Regulating Generative AI - LLMOps pipelines with Transparency
 
Ai lecture 07(unit03)
Ai lecture  07(unit03)Ai lecture  07(unit03)
Ai lecture 07(unit03)
 
AI Lecture 7 (uncertainty)
AI Lecture 7 (uncertainty)AI Lecture 7 (uncertainty)
AI Lecture 7 (uncertainty)
 
Artificial Neural Network | Deep Neural Network Explained | Artificial Neural...
Artificial Neural Network | Deep Neural Network Explained | Artificial Neural...Artificial Neural Network | Deep Neural Network Explained | Artificial Neural...
Artificial Neural Network | Deep Neural Network Explained | Artificial Neural...
 
Machine Learning with Azure Cognitive Services - Face Recognition and Deep Fa...
Machine Learning with Azure Cognitive Services - Face Recognition and Deep Fa...Machine Learning with Azure Cognitive Services - Face Recognition and Deep Fa...
Machine Learning with Azure Cognitive Services - Face Recognition and Deep Fa...
 
Ch 6 final
Ch 6 finalCh 6 final
Ch 6 final
 
An introduction to computer vision with Hugging Face
An introduction to computer vision with Hugging FaceAn introduction to computer vision with Hugging Face
An introduction to computer vision with Hugging Face
 
Broadleaf Presents Thymeleaf
Broadleaf Presents ThymeleafBroadleaf Presents Thymeleaf
Broadleaf Presents Thymeleaf
 
AWS Summit London 2019 - Containers on AWS
AWS Summit London 2019 - Containers on AWSAWS Summit London 2019 - Containers on AWS
AWS Summit London 2019 - Containers on AWS
 
Large Language Models Bootcamp
Large Language Models BootcampLarge Language Models Bootcamp
Large Language Models Bootcamp
 
Explainable AI in Industry (KDD 2019 Tutorial)
Explainable AI in Industry (KDD 2019 Tutorial)Explainable AI in Industry (KDD 2019 Tutorial)
Explainable AI in Industry (KDD 2019 Tutorial)
 
Feature Engineering
Feature Engineering Feature Engineering
Feature Engineering
 
Explainable AI (XAI) - A Perspective
Explainable AI (XAI) - A Perspective Explainable AI (XAI) - A Perspective
Explainable AI (XAI) - A Perspective
 
Trusted, Transparent and Fair AI using Open Source
Trusted, Transparent and Fair AI using Open SourceTrusted, Transparent and Fair AI using Open Source
Trusted, Transparent and Fair AI using Open Source
 

Similar to Machine Learning on IBM Watson Studio

PVS-Studio and Continuous Integration: TeamCity. Analysis of the Open RollerC...
PVS-Studio and Continuous Integration: TeamCity. Analysis of the Open RollerC...PVS-Studio and Continuous Integration: TeamCity. Analysis of the Open RollerC...
PVS-Studio and Continuous Integration: TeamCity. Analysis of the Open RollerC...Andrey Karpov
 
A case study in using ibm watson studio machine learning services ibm devel...
A case study in using ibm watson studio machine learning services   ibm devel...A case study in using ibm watson studio machine learning services   ibm devel...
A case study in using ibm watson studio machine learning services ibm devel...Einar Karlsen
 
MVC Design Pattern in JavaScript by ADMEC Multimedia Institute
MVC Design Pattern in JavaScript by ADMEC Multimedia InstituteMVC Design Pattern in JavaScript by ADMEC Multimedia Institute
MVC Design Pattern in JavaScript by ADMEC Multimedia InstituteRavi Bhadauria
 
Cis 247 all i labs
Cis 247 all i labsCis 247 all i labs
Cis 247 all i labsccis224477
 
Call For Code: 시각인식을 활용한 피해상황 파악하기 by 맹개발
Call For Code: 시각인식을 활용한 피해상황 파악하기 by 맹개발Call For Code: 시각인식을 활용한 피해상황 파악하기 by 맹개발
Call For Code: 시각인식을 활용한 피해상황 파악하기 by 맹개발Yunho Maeng
 
Yufeng Guo | Coding the 7 steps of machine learning | Codemotion Madrid 2018
Yufeng Guo |  Coding the 7 steps of machine learning | Codemotion Madrid 2018 Yufeng Guo |  Coding the 7 steps of machine learning | Codemotion Madrid 2018
Yufeng Guo | Coding the 7 steps of machine learning | Codemotion Madrid 2018 Codemotion
 
What’s New in Spring Data MongoDB
What’s New in Spring Data MongoDBWhat’s New in Spring Data MongoDB
What’s New in Spring Data MongoDBVMware Tanzu
 
QSDA2022: Qlik Sense Data Architect | Q & A
QSDA2022: Qlik Sense Data Architect | Q & AQSDA2022: Qlik Sense Data Architect | Q & A
QSDA2022: Qlik Sense Data Architect | Q & APalakMazumdar1
 
Getting started-with-oracle-so a-viii
Getting started-with-oracle-so a-viiiGetting started-with-oracle-so a-viii
Getting started-with-oracle-so a-viiiAmit Sharma
 
Enterprise AI by using IBM DB2
Enterprise AI by using IBM DB2Enterprise AI by using IBM DB2
Enterprise AI by using IBM DB2Object Automation
 
Weather data meets ibm cloud. part 4 analysis and visualization of weather ...
Weather data meets ibm cloud. part 4   analysis and visualization of weather ...Weather data meets ibm cloud. part 4   analysis and visualization of weather ...
Weather data meets ibm cloud. part 4 analysis and visualization of weather ...Einar Karlsen
 
Web Systems Architecture by Moshe Kaplan
Web Systems Architecture by Moshe KaplanWeb Systems Architecture by Moshe Kaplan
Web Systems Architecture by Moshe KaplanMoshe Kaplan
 
AWS DevDay Vienna - Automating building blocks choices you will face with con...
AWS DevDay Vienna - Automating building blocks choices you will face with con...AWS DevDay Vienna - Automating building blocks choices you will face with con...
AWS DevDay Vienna - Automating building blocks choices you will face with con...Cobus Bernard
 
Competition 1 (blog 1)
Competition 1 (blog 1)Competition 1 (blog 1)
Competition 1 (blog 1)TarunPaparaju
 
Cis407 a ilab 3 web application development devry university
Cis407 a ilab 3 web application development devry universityCis407 a ilab 3 web application development devry university
Cis407 a ilab 3 web application development devry universitylhkslkdh89009
 
PVS-Studio Is Now in Chocolatey: Checking Chocolatey under Azure DevOps
PVS-Studio Is Now in Chocolatey: Checking Chocolatey under Azure DevOpsPVS-Studio Is Now in Chocolatey: Checking Chocolatey under Azure DevOps
PVS-Studio Is Now in Chocolatey: Checking Chocolatey under Azure DevOpsAndrey Karpov
 
Big Data Seminar: Analytics, Hadoop, Map Reduce, Mongo and other great stuff
Big Data Seminar: Analytics, Hadoop, Map Reduce, Mongo and other great stuffBig Data Seminar: Analytics, Hadoop, Map Reduce, Mongo and other great stuff
Big Data Seminar: Analytics, Hadoop, Map Reduce, Mongo and other great stuffMoshe Kaplan
 
PVS-Studio in the Clouds: Azure DevOps
PVS-Studio in the Clouds: Azure DevOpsPVS-Studio in the Clouds: Azure DevOps
PVS-Studio in the Clouds: Azure DevOpsAndrey Karpov
 

Similar to Machine Learning on IBM Watson Studio (20)

PVS-Studio and Continuous Integration: TeamCity. Analysis of the Open RollerC...
PVS-Studio and Continuous Integration: TeamCity. Analysis of the Open RollerC...PVS-Studio and Continuous Integration: TeamCity. Analysis of the Open RollerC...
PVS-Studio and Continuous Integration: TeamCity. Analysis of the Open RollerC...
 
A case study in using ibm watson studio machine learning services ibm devel...
A case study in using ibm watson studio machine learning services   ibm devel...A case study in using ibm watson studio machine learning services   ibm devel...
A case study in using ibm watson studio machine learning services ibm devel...
 
MVC Design Pattern in JavaScript by ADMEC Multimedia Institute
MVC Design Pattern in JavaScript by ADMEC Multimedia InstituteMVC Design Pattern in JavaScript by ADMEC Multimedia Institute
MVC Design Pattern in JavaScript by ADMEC Multimedia Institute
 
Cis 247 all i labs
Cis 247 all i labsCis 247 all i labs
Cis 247 all i labs
 
Call For Code: 시각인식을 활용한 피해상황 파악하기 by 맹개발
Call For Code: 시각인식을 활용한 피해상황 파악하기 by 맹개발Call For Code: 시각인식을 활용한 피해상황 파악하기 by 맹개발
Call For Code: 시각인식을 활용한 피해상황 파악하기 by 맹개발
 
Yufeng Guo | Coding the 7 steps of machine learning | Codemotion Madrid 2018
Yufeng Guo |  Coding the 7 steps of machine learning | Codemotion Madrid 2018 Yufeng Guo |  Coding the 7 steps of machine learning | Codemotion Madrid 2018
Yufeng Guo | Coding the 7 steps of machine learning | Codemotion Madrid 2018
 
What’s New in Spring Data MongoDB
What’s New in Spring Data MongoDBWhat’s New in Spring Data MongoDB
What’s New in Spring Data MongoDB
 
QSDA2022: Qlik Sense Data Architect | Q & A
QSDA2022: Qlik Sense Data Architect | Q & AQSDA2022: Qlik Sense Data Architect | Q & A
QSDA2022: Qlik Sense Data Architect | Q & A
 
Enterprise AI using DB2
Enterprise AI using DB2Enterprise AI using DB2
Enterprise AI using DB2
 
Getting started-with-oracle-so a-viii
Getting started-with-oracle-so a-viiiGetting started-with-oracle-so a-viii
Getting started-with-oracle-so a-viii
 
Building richwebapplicationsusingasp
Building richwebapplicationsusingaspBuilding richwebapplicationsusingasp
Building richwebapplicationsusingasp
 
Enterprise AI by using IBM DB2
Enterprise AI by using IBM DB2Enterprise AI by using IBM DB2
Enterprise AI by using IBM DB2
 
Weather data meets ibm cloud. part 4 analysis and visualization of weather ...
Weather data meets ibm cloud. part 4   analysis and visualization of weather ...Weather data meets ibm cloud. part 4   analysis and visualization of weather ...
Weather data meets ibm cloud. part 4 analysis and visualization of weather ...
 
Web Systems Architecture by Moshe Kaplan
Web Systems Architecture by Moshe KaplanWeb Systems Architecture by Moshe Kaplan
Web Systems Architecture by Moshe Kaplan
 
AWS DevDay Vienna - Automating building blocks choices you will face with con...
AWS DevDay Vienna - Automating building blocks choices you will face with con...AWS DevDay Vienna - Automating building blocks choices you will face with con...
AWS DevDay Vienna - Automating building blocks choices you will face with con...
 
Competition 1 (blog 1)
Competition 1 (blog 1)Competition 1 (blog 1)
Competition 1 (blog 1)
 
Cis407 a ilab 3 web application development devry university
Cis407 a ilab 3 web application development devry universityCis407 a ilab 3 web application development devry university
Cis407 a ilab 3 web application development devry university
 
PVS-Studio Is Now in Chocolatey: Checking Chocolatey under Azure DevOps
PVS-Studio Is Now in Chocolatey: Checking Chocolatey under Azure DevOpsPVS-Studio Is Now in Chocolatey: Checking Chocolatey under Azure DevOps
PVS-Studio Is Now in Chocolatey: Checking Chocolatey under Azure DevOps
 
Big Data Seminar: Analytics, Hadoop, Map Reduce, Mongo and other great stuff
Big Data Seminar: Analytics, Hadoop, Map Reduce, Mongo and other great stuffBig Data Seminar: Analytics, Hadoop, Map Reduce, Mongo and other great stuff
Big Data Seminar: Analytics, Hadoop, Map Reduce, Mongo and other great stuff
 
PVS-Studio in the Clouds: Azure DevOps
PVS-Studio in the Clouds: Azure DevOpsPVS-Studio in the Clouds: Azure DevOps
PVS-Studio in the Clouds: Azure DevOps
 

Recently uploaded

The basics of sentences session 2pptx copy.pptx
The basics of sentences session 2pptx copy.pptxThe basics of sentences session 2pptx copy.pptx
The basics of sentences session 2pptx copy.pptxheathfieldcps1
 
Introduction to ArtificiaI Intelligence in Higher Education
Introduction to ArtificiaI Intelligence in Higher EducationIntroduction to ArtificiaI Intelligence in Higher Education
Introduction to ArtificiaI Intelligence in Higher Educationpboyjonauth
 
Software Engineering Methodologies (overview)
Software Engineering Methodologies (overview)Software Engineering Methodologies (overview)
Software Engineering Methodologies (overview)eniolaolutunde
 
Incoming and Outgoing Shipments in 1 STEP Using Odoo 17
Incoming and Outgoing Shipments in 1 STEP Using Odoo 17Incoming and Outgoing Shipments in 1 STEP Using Odoo 17
Incoming and Outgoing Shipments in 1 STEP Using Odoo 17Celine George
 
Alper Gobel In Media Res Media Component
Alper Gobel In Media Res Media ComponentAlper Gobel In Media Res Media Component
Alper Gobel In Media Res Media ComponentInMediaRes1
 
Sanyam Choudhary Chemistry practical.pdf
Sanyam Choudhary Chemistry practical.pdfSanyam Choudhary Chemistry practical.pdf
Sanyam Choudhary Chemistry practical.pdfsanyamsingh5019
 
A Critique of the Proposed National Education Policy Reform
A Critique of the Proposed National Education Policy ReformA Critique of the Proposed National Education Policy Reform
A Critique of the Proposed National Education Policy ReformChameera Dedduwage
 
Hybridoma Technology ( Production , Purification , and Application )
Hybridoma Technology  ( Production , Purification , and Application  ) Hybridoma Technology  ( Production , Purification , and Application  )
Hybridoma Technology ( Production , Purification , and Application ) Sakshi Ghasle
 
Employee wellbeing at the workplace.pptx
Employee wellbeing at the workplace.pptxEmployee wellbeing at the workplace.pptx
Employee wellbeing at the workplace.pptxNirmalaLoungPoorunde1
 
The Most Excellent Way | 1 Corinthians 13
The Most Excellent Way | 1 Corinthians 13The Most Excellent Way | 1 Corinthians 13
The Most Excellent Way | 1 Corinthians 13Steve Thomason
 
How to Make a Pirate ship Primary Education.pptx
How to Make a Pirate ship Primary Education.pptxHow to Make a Pirate ship Primary Education.pptx
How to Make a Pirate ship Primary Education.pptxmanuelaromero2013
 
MENTAL STATUS EXAMINATION format.docx
MENTAL     STATUS EXAMINATION format.docxMENTAL     STATUS EXAMINATION format.docx
MENTAL STATUS EXAMINATION format.docxPoojaSen20
 
Kisan Call Centre - To harness potential of ICT in Agriculture by answer farm...
Kisan Call Centre - To harness potential of ICT in Agriculture by answer farm...Kisan Call Centre - To harness potential of ICT in Agriculture by answer farm...
Kisan Call Centre - To harness potential of ICT in Agriculture by answer farm...Krashi Coaching
 
URLs and Routing in the Odoo 17 Website App
URLs and Routing in the Odoo 17 Website AppURLs and Routing in the Odoo 17 Website App
URLs and Routing in the Odoo 17 Website AppCeline George
 
Contemporary philippine arts from the regions_PPT_Module_12 [Autosaved] (1).pptx
Contemporary philippine arts from the regions_PPT_Module_12 [Autosaved] (1).pptxContemporary philippine arts from the regions_PPT_Module_12 [Autosaved] (1).pptx
Contemporary philippine arts from the regions_PPT_Module_12 [Autosaved] (1).pptxRoyAbrique
 
PSYCHIATRIC History collection FORMAT.pptx
PSYCHIATRIC   History collection FORMAT.pptxPSYCHIATRIC   History collection FORMAT.pptx
PSYCHIATRIC History collection FORMAT.pptxPoojaSen20
 
Micromeritics - Fundamental and Derived Properties of Powders
Micromeritics - Fundamental and Derived Properties of PowdersMicromeritics - Fundamental and Derived Properties of Powders
Micromeritics - Fundamental and Derived Properties of PowdersChitralekhaTherkar
 
18-04-UA_REPORT_MEDIALITERAСY_INDEX-DM_23-1-final-eng.pdf
18-04-UA_REPORT_MEDIALITERAСY_INDEX-DM_23-1-final-eng.pdf18-04-UA_REPORT_MEDIALITERAСY_INDEX-DM_23-1-final-eng.pdf
18-04-UA_REPORT_MEDIALITERAСY_INDEX-DM_23-1-final-eng.pdfssuser54595a
 

Recently uploaded (20)

The basics of sentences session 2pptx copy.pptx
The basics of sentences session 2pptx copy.pptxThe basics of sentences session 2pptx copy.pptx
The basics of sentences session 2pptx copy.pptx
 
Introduction to ArtificiaI Intelligence in Higher Education
Introduction to ArtificiaI Intelligence in Higher EducationIntroduction to ArtificiaI Intelligence in Higher Education
Introduction to ArtificiaI Intelligence in Higher Education
 
Software Engineering Methodologies (overview)
Software Engineering Methodologies (overview)Software Engineering Methodologies (overview)
Software Engineering Methodologies (overview)
 
Incoming and Outgoing Shipments in 1 STEP Using Odoo 17
Incoming and Outgoing Shipments in 1 STEP Using Odoo 17Incoming and Outgoing Shipments in 1 STEP Using Odoo 17
Incoming and Outgoing Shipments in 1 STEP Using Odoo 17
 
Alper Gobel In Media Res Media Component
Alper Gobel In Media Res Media ComponentAlper Gobel In Media Res Media Component
Alper Gobel In Media Res Media Component
 
Sanyam Choudhary Chemistry practical.pdf
Sanyam Choudhary Chemistry practical.pdfSanyam Choudhary Chemistry practical.pdf
Sanyam Choudhary Chemistry practical.pdf
 
A Critique of the Proposed National Education Policy Reform
A Critique of the Proposed National Education Policy ReformA Critique of the Proposed National Education Policy Reform
A Critique of the Proposed National Education Policy Reform
 
TataKelola dan KamSiber Kecerdasan Buatan v022.pdf
TataKelola dan KamSiber Kecerdasan Buatan v022.pdfTataKelola dan KamSiber Kecerdasan Buatan v022.pdf
TataKelola dan KamSiber Kecerdasan Buatan v022.pdf
 
Hybridoma Technology ( Production , Purification , and Application )
Hybridoma Technology  ( Production , Purification , and Application  ) Hybridoma Technology  ( Production , Purification , and Application  )
Hybridoma Technology ( Production , Purification , and Application )
 
Employee wellbeing at the workplace.pptx
Employee wellbeing at the workplace.pptxEmployee wellbeing at the workplace.pptx
Employee wellbeing at the workplace.pptx
 
The Most Excellent Way | 1 Corinthians 13
The Most Excellent Way | 1 Corinthians 13The Most Excellent Way | 1 Corinthians 13
The Most Excellent Way | 1 Corinthians 13
 
How to Make a Pirate ship Primary Education.pptx
How to Make a Pirate ship Primary Education.pptxHow to Make a Pirate ship Primary Education.pptx
How to Make a Pirate ship Primary Education.pptx
 
MENTAL STATUS EXAMINATION format.docx
MENTAL     STATUS EXAMINATION format.docxMENTAL     STATUS EXAMINATION format.docx
MENTAL STATUS EXAMINATION format.docx
 
Kisan Call Centre - To harness potential of ICT in Agriculture by answer farm...
Kisan Call Centre - To harness potential of ICT in Agriculture by answer farm...Kisan Call Centre - To harness potential of ICT in Agriculture by answer farm...
Kisan Call Centre - To harness potential of ICT in Agriculture by answer farm...
 
URLs and Routing in the Odoo 17 Website App
URLs and Routing in the Odoo 17 Website AppURLs and Routing in the Odoo 17 Website App
URLs and Routing in the Odoo 17 Website App
 
Contemporary philippine arts from the regions_PPT_Module_12 [Autosaved] (1).pptx
Contemporary philippine arts from the regions_PPT_Module_12 [Autosaved] (1).pptxContemporary philippine arts from the regions_PPT_Module_12 [Autosaved] (1).pptx
Contemporary philippine arts from the regions_PPT_Module_12 [Autosaved] (1).pptx
 
Staff of Color (SOC) Retention Efforts DDSD
Staff of Color (SOC) Retention Efforts DDSDStaff of Color (SOC) Retention Efforts DDSD
Staff of Color (SOC) Retention Efforts DDSD
 
PSYCHIATRIC History collection FORMAT.pptx
PSYCHIATRIC   History collection FORMAT.pptxPSYCHIATRIC   History collection FORMAT.pptx
PSYCHIATRIC History collection FORMAT.pptx
 
Micromeritics - Fundamental and Derived Properties of Powders
Micromeritics - Fundamental and Derived Properties of PowdersMicromeritics - Fundamental and Derived Properties of Powders
Micromeritics - Fundamental and Derived Properties of Powders
 
18-04-UA_REPORT_MEDIALITERAСY_INDEX-DM_23-1-final-eng.pdf
18-04-UA_REPORT_MEDIALITERAСY_INDEX-DM_23-1-final-eng.pdf18-04-UA_REPORT_MEDIALITERAСY_INDEX-DM_23-1-final-eng.pdf
18-04-UA_REPORT_MEDIALITERAСY_INDEX-DM_23-1-final-eng.pdf
 

Machine Learning on IBM Watson Studio

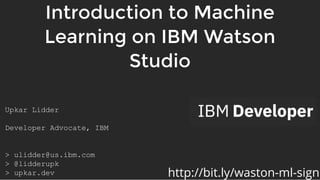
  • 1. Introduction to MachineIntroduction to Machine Learning on IBM WatsonLearning on IBM Watson StudioStudio Upkar Lidder    Developer Advocate, IBM       > ulidder@us.ibm.com  > @lidderupk  > upkar.dev  http://bit.ly/waston-ml-sign
  • 2. PrerequisitesPrerequisites @lidderupkIBM Developer 1. Create IBM Cloud Account using THIS URL 3. If you already have an account, use the above URL to sign into your IBM Cloud account. 2. Check your email and activate your account. Once activated, log back into your IBM Cloud account using the link above. http://bit.ly/waston-ml-sign
  • 3. Watson Studio & Watson Machine LearningWatson Studio & Watson Machine Learning @lidderupkIBM Developer
  • 5. IBM Watson Studio IBM Watson Studio  @lidderupkIBM Developer
  • 6. IBM Watson Studio IBM Watson Studio  @lidderupkIBM Developer
  • 7. Workshop -Workshop - GoalsGoals @lidderupkIBM Developer Successfully Create, Store and  Deploy a Linear Regression Model  on IBM Cloud using Watson Studio  and Watson Machine Learning  Services.
  • 8. Question -Question - predict median house price for Boston areapredict median house price for Boston area @lidderupkIBM Developer
  • 9. Linear regressionLinear regression - Simple- Simple @lidderupkIBM Developer Median HousePrice Another Variable Y = ⍺ + βx
  • 10. StepsSteps @lidderupkIBM Developer 1. Sign up / Log into IBM Cloud - http://bit.ly/waston-ml-sign 2. Create Watson Studio Service. 3. Sign into Watson Studio and create a new Data Science Project. It also creates a Cloud Object Store for you. 4. Associate a Machine Learning Service with your project. 5. Upload csv data to your project. 6. Add a new Machine Learning Model to your project. 7. Create a Linear Regression Model and save it to IBM Cloud. 8. Create a new deployment on IBM Cloud. 9. Test your model !
  • 11. Step 1 -Step 1 - sign up/ log into IBM Cloudsign up/ log into IBM Cloud @lidderupkIBM Developer http://bit.ly/waston-ml-sign
  • 12. Step 2 -Step 2 - locate Watson Studio in Cataloglocate Watson Studio in Catalog @lidderupkIBM Developer
  • 13. Step 3 -Step 3 - create Watson Studio instancecreate Watson Studio instance @lidderupkIBM Developer
  • 14. Step 4 -Step 4 - launch Watson Studiolaunch Watson Studio @lidderupkIBM Developer
  • 15. Step 5 -Step 5 - create a new projectcreate a new project @lidderupkIBM Developer
  • 16. Step 6 -Step 6 - pick Data Science starterpick Data Science starter @lidderupkIBM Developer
  • 17. Step 7 -Step 7 - give the project a name and assign COSgive the project a name and assign COS @lidderupkIBM Developer
  • 18. Step 8 -Step 8 - open asset tabopen asset tab @lidderupkIBM Developer
  • 19. Step 9 -Step 9 - drag and drop data file into Load Assetsdrag and drop data file into Load Assets @lidderupkIBM Developer http://bit.ly/boston-house-csv
  • 20. Step 10 -Step 10 - add Machine Learning model to the projectadd Machine Learning model to the project @lidderupkIBM Developer
  • 21. Step 11 - associate a ML instanceStep 11 - associate a ML instance @lidderupkIBM Developer
  • 22. Step 12a -Step 12a - create ML instance if you don't have onecreate ML instance if you don't have one @lidderupkIBM Developer
  • 23. Step 12b -Step 12b - create a new lite ML instancecreate a new lite ML instance @lidderupkIBM Developer
  • 24. @lidderupkIBM Developer Step 12c -Step 12c - create a new lite ML instancecreate a new lite ML instance
  • 25. Step 12d -Step 12d - reload the ML service sectionreload the ML service section @lidderupkIBM Developer
  • 26. Step 13 -Step 13 - pick new service and create a model manuallypick new service and create a model manually @lidderupkIBM Developer
  • 27. Step 14 -Step 14 - pick the Boston data file aspick the Boston data file as data assetdata asset @lidderupkIBM Developer
  • 28. @lidderupkIBM Developer Step 15 -Step 15 - pick target, input features and model typepick target, input features and model type
  • 29. @lidderupkIBM Developer Step 16 -Step 16 - add estimator(s)add estimator(s)
  • 30. @lidderupkIBM Developer Step 17 -Step 17 - change hyperparameters (optional)change hyperparameters (optional)
  • 31. @lidderupkIBM Developer Step 18 -Step 18 - save/store the trained model on IBM Cloudsave/store the trained model on IBM Cloud
  • 32. @lidderupkIBM Developer Step 19 -Step 19 - add a new deploymentadd a new deployment
  • 33. @lidderupkIBM Developer 1 2 Step 20 -Step 20 - ensure that deployment is successfulensure that deployment is successful
  • 34. @lidderupkIBM Developer Step 21a -Step 21a - implementation / test the deployed modelimplementation / test the deployed model
  • 35. @lidderupkIBM Developer { "fields": ["CRIM", "ZN", "INDUS", "CHAS", "NOX", "RM", "AGE", "DIS", "RAD", "TAX", "PTRATIO", "B", "LSTAT"], "values": [ [0.00632, 18, 2.31, 0, 0.538, 6.575, 66, 4.09, 1, 296, 15.3, 396.9, 4.99] ] } 1 2 3 4 5 6 Step 21b -Step 21b - implementation / test the deployed modelimplementation / test the deployed model
  • 36. @lidderupkIBM Developer Watson Studio - Binary ClassificationWatson Studio - Binary Classification
  • 37. @lidderupkIBM Developer Watson Studio - Multiclass ClassificationWatson Studio - Multiclass Classification
  • 38. @lidderupkIBM Developer Watson Studio - RegressionWatson Studio - Regression
  • 39. Watson Machine LearningWatson Machine Learning
  • 40. WML -WML - Supported Frameworks as of 06.21.19Supported Frameworks as of 06.21.19 @lidderupkIBM Developer
  • 41. IBM Watson Machine Learning IBM Watson Machine Learning  @lidderupkIBM Developer
  • 42. IBM Watson Machine Learning Client IBM Watson Machine Learning Client  @lidderupkIBM Developer http://wml-api-pyclient.mybluemix.net/index.html
  • 43. WML -WML - create scikit-learn linear regression modelcreate scikit-learn linear regression model @lidderupkIBM Developer from sklearn.linear_model import LinearRegression from sklearn.datasets import load_boston import matplotlib.pyplot as plt from sklearn.model_selection import train_test_split from sklearn.metrics import mean_squared_error, r2_score 1 2 3 4 5 6 boston = load_boston()7 X_train, X_test, y_train, y_test = train_test_split(boston.data, boston.target)8 9 # Create a new Linear Regression Model10 LR_model = LinearRegression()11 12 # Train the model13 LR_model.fit(X_train, y_train)14 15 # store actual and predited data to draw chart16 predicted = LR_model.predict(X_test)17 actual = y_test18 19 20 # The coefficients21 print('Coefficients: n', LR_model.coef_)22 # The mean squared error23 print("Mean squared error: %.2f"24 % mean_squared_error(actual, predicted))25 # Explained variance score: 1 is perfect prediction26 print('Variance score: %.2f' % r2_score(actual, predicted))27 Output
  • 44. WML -WML - create scikit-learn linear regression modelcreate scikit-learn linear regression model @lidderupkIBM Developer from sklearn.linear_model import LinearRegression from sklearn.datasets import load_boston import matplotlib.pyplot as plt from sklearn.model_selection import train_test_split from sklearn.metrics import mean_squared_error, r2_score 1 2 3 4 5 6 boston = load_boston()7 X_train, X_test, y_train, y_test = train_test_split(boston.data, boston.target)8 9 # Create a new Linear Regression Model10 LR_model = LinearRegression()11 12 # Train the model13 LR_model.fit(X_train, y_train)14 15 # store actual and predited data to draw chart16 predicted = LR_model.predict(X_test)17 actual = y_test18 19 20 # The coefficients21 print('Coefficients: n', LR_model.coef_)22 # The mean squared error23 print("Mean squared error: %.2f"24 % mean_squared_error(actual, predicted))25 # Explained variance score: 1 is perfect prediction26 print('Variance score: %.2f' % r2_score(actual, predicted))27 boston = load_boston() X_train, X_test, y_train, y_test = train_test_split(boston.data, boston.target) from sklearn.linear_model import LinearRegression1 from sklearn.datasets import load_boston2 import matplotlib.pyplot as plt3 from sklearn.model_selection import train_test_split4 from sklearn.metrics import mean_squared_error, r2_score5 6 7 8 9 # Create a new Linear Regression Model10 LR_model = LinearRegression()11 12 # Train the model13 LR_model.fit(X_train, y_train)14 15 # store actual and predited data to draw chart16 predicted = LR_model.predict(X_test)17 actual = y_test18 19 20 # The coefficients21 print('Coefficients: n', LR_model.coef_)22 # The mean squared error23 print("Mean squared error: %.2f"24 % mean_squared_error(actual, predicted))25 # Explained variance score: 1 is perfect prediction26 print('Variance score: %.2f' % r2_score(actual, predicted))27 Output
  • 45. WML -WML - create scikit-learn linear regression modelcreate scikit-learn linear regression model @lidderupkIBM Developer from sklearn.linear_model import LinearRegression from sklearn.datasets import load_boston import matplotlib.pyplot as plt from sklearn.model_selection import train_test_split from sklearn.metrics import mean_squared_error, r2_score 1 2 3 4 5 6 boston = load_boston()7 X_train, X_test, y_train, y_test = train_test_split(boston.data, boston.target)8 9 # Create a new Linear Regression Model10 LR_model = LinearRegression()11 12 # Train the model13 LR_model.fit(X_train, y_train)14 15 # store actual and predited data to draw chart16 predicted = LR_model.predict(X_test)17 actual = y_test18 19 20 # The coefficients21 print('Coefficients: n', LR_model.coef_)22 # The mean squared error23 print("Mean squared error: %.2f"24 % mean_squared_error(actual, predicted))25 # Explained variance score: 1 is perfect prediction26 print('Variance score: %.2f' % r2_score(actual, predicted))27 boston = load_boston() X_train, X_test, y_train, y_test = train_test_split(boston.data, boston.target) from sklearn.linear_model import LinearRegression1 from sklearn.datasets import load_boston2 import matplotlib.pyplot as plt3 from sklearn.model_selection import train_test_split4 from sklearn.metrics import mean_squared_error, r2_score5 6 7 8 9 # Create a new Linear Regression Model10 LR_model = LinearRegression()11 12 # Train the model13 LR_model.fit(X_train, y_train)14 15 # store actual and predited data to draw chart16 predicted = LR_model.predict(X_test)17 actual = y_test18 19 20 # The coefficients21 print('Coefficients: n', LR_model.coef_)22 # The mean squared error23 print("Mean squared error: %.2f"24 % mean_squared_error(actual, predicted))25 # Explained variance score: 1 is perfect prediction26 print('Variance score: %.2f' % r2_score(actual, predicted))27 # Create a new Linear Regression Model LR_model = LinearRegression() from sklearn.linear_model import LinearRegression1 from sklearn.datasets import load_boston2 import matplotlib.pyplot as plt3 from sklearn.model_selection import train_test_split4 from sklearn.metrics import mean_squared_error, r2_score5 6 boston = load_boston()7 X_train, X_test, y_train, y_test = train_test_split(boston.data, boston.target)8 9 10 11 12 # Train the model13 LR_model.fit(X_train, y_train)14 15 # store actual and predited data to draw chart16 predicted = LR_model.predict(X_test)17 actual = y_test18 19 20 # The coefficients21 print('Coefficients: n', LR_model.coef_)22 # The mean squared error23 print("Mean squared error: %.2f"24 % mean_squared_error(actual, predicted))25 # Explained variance score: 1 is perfect prediction26 print('Variance score: %.2f' % r2_score(actual, predicted))27 Output
  • 46. WML -WML - create scikit-learn linear regression modelcreate scikit-learn linear regression model @lidderupkIBM Developer from sklearn.linear_model import LinearRegression from sklearn.datasets import load_boston import matplotlib.pyplot as plt from sklearn.model_selection import train_test_split from sklearn.metrics import mean_squared_error, r2_score 1 2 3 4 5 6 boston = load_boston()7 X_train, X_test, y_train, y_test = train_test_split(boston.data, boston.target)8 9 # Create a new Linear Regression Model10 LR_model = LinearRegression()11 12 # Train the model13 LR_model.fit(X_train, y_train)14 15 # store actual and predited data to draw chart16 predicted = LR_model.predict(X_test)17 actual = y_test18 19 20 # The coefficients21 print('Coefficients: n', LR_model.coef_)22 # The mean squared error23 print("Mean squared error: %.2f"24 % mean_squared_error(actual, predicted))25 # Explained variance score: 1 is perfect prediction26 print('Variance score: %.2f' % r2_score(actual, predicted))27 boston = load_boston() X_train, X_test, y_train, y_test = train_test_split(boston.data, boston.target) from sklearn.linear_model import LinearRegression1 from sklearn.datasets import load_boston2 import matplotlib.pyplot as plt3 from sklearn.model_selection import train_test_split4 from sklearn.metrics import mean_squared_error, r2_score5 6 7 8 9 # Create a new Linear Regression Model10 LR_model = LinearRegression()11 12 # Train the model13 LR_model.fit(X_train, y_train)14 15 # store actual and predited data to draw chart16 predicted = LR_model.predict(X_test)17 actual = y_test18 19 20 # The coefficients21 print('Coefficients: n', LR_model.coef_)22 # The mean squared error23 print("Mean squared error: %.2f"24 % mean_squared_error(actual, predicted))25 # Explained variance score: 1 is perfect prediction26 print('Variance score: %.2f' % r2_score(actual, predicted))27 # Create a new Linear Regression Model LR_model = LinearRegression() from sklearn.linear_model import LinearRegression1 from sklearn.datasets import load_boston2 import matplotlib.pyplot as plt3 from sklearn.model_selection import train_test_split4 from sklearn.metrics import mean_squared_error, r2_score5 6 boston = load_boston()7 X_train, X_test, y_train, y_test = train_test_split(boston.data, boston.target)8 9 10 11 12 # Train the model13 LR_model.fit(X_train, y_train)14 15 # store actual and predited data to draw chart16 predicted = LR_model.predict(X_test)17 actual = y_test18 19 20 # The coefficients21 print('Coefficients: n', LR_model.coef_)22 # The mean squared error23 print("Mean squared error: %.2f"24 % mean_squared_error(actual, predicted))25 # Explained variance score: 1 is perfect prediction26 print('Variance score: %.2f' % r2_score(actual, predicted))27 # Train the model LR_model.fit(X_train, y_train) from sklearn.linear_model import LinearRegression1 from sklearn.datasets import load_boston2 import matplotlib.pyplot as plt3 from sklearn.model_selection import train_test_split4 from sklearn.metrics import mean_squared_error, r2_score5 6 boston = load_boston()7 X_train, X_test, y_train, y_test = train_test_split(boston.data, boston.target)8 9 # Create a new Linear Regression Model10 LR_model = LinearRegression()11 12 13 14 15 # store actual and predited data to draw chart16 predicted = LR_model.predict(X_test)17 actual = y_test18 19 20 # The coefficients21 print('Coefficients: n', LR_model.coef_)22 # The mean squared error23 print("Mean squared error: %.2f"24 % mean_squared_error(actual, predicted))25 # Explained variance score: 1 is perfect prediction26 print('Variance score: %.2f' % r2_score(actual, predicted))27 Output
  • 47. WML -WML - create scikit-learn linear regression modelcreate scikit-learn linear regression model @lidderupkIBM Developer from sklearn.linear_model import LinearRegression from sklearn.datasets import load_boston import matplotlib.pyplot as plt from sklearn.model_selection import train_test_split from sklearn.metrics import mean_squared_error, r2_score 1 2 3 4 5 6 boston = load_boston()7 X_train, X_test, y_train, y_test = train_test_split(boston.data, boston.target)8 9 # Create a new Linear Regression Model10 LR_model = LinearRegression()11 12 # Train the model13 LR_model.fit(X_train, y_train)14 15 # store actual and predited data to draw chart16 predicted = LR_model.predict(X_test)17 actual = y_test18 19 20 # The coefficients21 print('Coefficients: n', LR_model.coef_)22 # The mean squared error23 print("Mean squared error: %.2f"24 % mean_squared_error(actual, predicted))25 # Explained variance score: 1 is perfect prediction26 print('Variance score: %.2f' % r2_score(actual, predicted))27 boston = load_boston() X_train, X_test, y_train, y_test = train_test_split(boston.data, boston.target) from sklearn.linear_model import LinearRegression1 from sklearn.datasets import load_boston2 import matplotlib.pyplot as plt3 from sklearn.model_selection import train_test_split4 from sklearn.metrics import mean_squared_error, r2_score5 6 7 8 9 # Create a new Linear Regression Model10 LR_model = LinearRegression()11 12 # Train the model13 LR_model.fit(X_train, y_train)14 15 # store actual and predited data to draw chart16 predicted = LR_model.predict(X_test)17 actual = y_test18 19 20 # The coefficients21 print('Coefficients: n', LR_model.coef_)22 # The mean squared error23 print("Mean squared error: %.2f"24 % mean_squared_error(actual, predicted))25 # Explained variance score: 1 is perfect prediction26 print('Variance score: %.2f' % r2_score(actual, predicted))27 # Create a new Linear Regression Model LR_model = LinearRegression() from sklearn.linear_model import LinearRegression1 from sklearn.datasets import load_boston2 import matplotlib.pyplot as plt3 from sklearn.model_selection import train_test_split4 from sklearn.metrics import mean_squared_error, r2_score5 6 boston = load_boston()7 X_train, X_test, y_train, y_test = train_test_split(boston.data, boston.target)8 9 10 11 12 # Train the model13 LR_model.fit(X_train, y_train)14 15 # store actual and predited data to draw chart16 predicted = LR_model.predict(X_test)17 actual = y_test18 19 20 # The coefficients21 print('Coefficients: n', LR_model.coef_)22 # The mean squared error23 print("Mean squared error: %.2f"24 % mean_squared_error(actual, predicted))25 # Explained variance score: 1 is perfect prediction26 print('Variance score: %.2f' % r2_score(actual, predicted))27 # Train the model LR_model.fit(X_train, y_train) from sklearn.linear_model import LinearRegression1 from sklearn.datasets import load_boston2 import matplotlib.pyplot as plt3 from sklearn.model_selection import train_test_split4 from sklearn.metrics import mean_squared_error, r2_score5 6 boston = load_boston()7 X_train, X_test, y_train, y_test = train_test_split(boston.data, boston.target)8 9 # Create a new Linear Regression Model10 LR_model = LinearRegression()11 12 13 14 15 # store actual and predited data to draw chart16 predicted = LR_model.predict(X_test)17 actual = y_test18 19 20 # The coefficients21 print('Coefficients: n', LR_model.coef_)22 # The mean squared error23 print("Mean squared error: %.2f"24 % mean_squared_error(actual, predicted))25 # Explained variance score: 1 is perfect prediction26 print('Variance score: %.2f' % r2_score(actual, predicted))27 # store actual and predited data to draw chart predicted = LR_model.predict(X_test) actual = y_test from sklearn.linear_model import LinearRegression1 from sklearn.datasets import load_boston2 import matplotlib.pyplot as plt3 from sklearn.model_selection import train_test_split4 from sklearn.metrics import mean_squared_error, r2_score5 6 boston = load_boston()7 X_train, X_test, y_train, y_test = train_test_split(boston.data, boston.target)8 9 # Create a new Linear Regression Model10 LR_model = LinearRegression()11 12 # Train the model13 LR_model.fit(X_train, y_train)14 15 16 17 18 19 20 # The coefficients21 print('Coefficients: n', LR_model.coef_)22 # The mean squared error23 print("Mean squared error: %.2f"24 % mean_squared_error(actual, predicted))25 # Explained variance score: 1 is perfect prediction26 print('Variance score: %.2f' % r2_score(actual, predicted))27 Output
  • 48. WML -WML - create scikit-learn linear regression modelcreate scikit-learn linear regression model @lidderupkIBM Developer from sklearn.linear_model import LinearRegression from sklearn.datasets import load_boston import matplotlib.pyplot as plt from sklearn.model_selection import train_test_split from sklearn.metrics import mean_squared_error, r2_score 1 2 3 4 5 6 boston = load_boston()7 X_train, X_test, y_train, y_test = train_test_split(boston.data, boston.target)8 9 # Create a new Linear Regression Model10 LR_model = LinearRegression()11 12 # Train the model13 LR_model.fit(X_train, y_train)14 15 # store actual and predited data to draw chart16 predicted = LR_model.predict(X_test)17 actual = y_test18 19 20 # The coefficients21 print('Coefficients: n', LR_model.coef_)22 # The mean squared error23 print("Mean squared error: %.2f"24 % mean_squared_error(actual, predicted))25 # Explained variance score: 1 is perfect prediction26 print('Variance score: %.2f' % r2_score(actual, predicted))27 boston = load_boston() X_train, X_test, y_train, y_test = train_test_split(boston.data, boston.target) from sklearn.linear_model import LinearRegression1 from sklearn.datasets import load_boston2 import matplotlib.pyplot as plt3 from sklearn.model_selection import train_test_split4 from sklearn.metrics import mean_squared_error, r2_score5 6 7 8 9 # Create a new Linear Regression Model10 LR_model = LinearRegression()11 12 # Train the model13 LR_model.fit(X_train, y_train)14 15 # store actual and predited data to draw chart16 predicted = LR_model.predict(X_test)17 actual = y_test18 19 20 # The coefficients21 print('Coefficients: n', LR_model.coef_)22 # The mean squared error23 print("Mean squared error: %.2f"24 % mean_squared_error(actual, predicted))25 # Explained variance score: 1 is perfect prediction26 print('Variance score: %.2f' % r2_score(actual, predicted))27 # Create a new Linear Regression Model LR_model = LinearRegression() from sklearn.linear_model import LinearRegression1 from sklearn.datasets import load_boston2 import matplotlib.pyplot as plt3 from sklearn.model_selection import train_test_split4 from sklearn.metrics import mean_squared_error, r2_score5 6 boston = load_boston()7 X_train, X_test, y_train, y_test = train_test_split(boston.data, boston.target)8 9 10 11 12 # Train the model13 LR_model.fit(X_train, y_train)14 15 # store actual and predited data to draw chart16 predicted = LR_model.predict(X_test)17 actual = y_test18 19 20 # The coefficients21 print('Coefficients: n', LR_model.coef_)22 # The mean squared error23 print("Mean squared error: %.2f"24 % mean_squared_error(actual, predicted))25 # Explained variance score: 1 is perfect prediction26 print('Variance score: %.2f' % r2_score(actual, predicted))27 # Train the model LR_model.fit(X_train, y_train) from sklearn.linear_model import LinearRegression1 from sklearn.datasets import load_boston2 import matplotlib.pyplot as plt3 from sklearn.model_selection import train_test_split4 from sklearn.metrics import mean_squared_error, r2_score5 6 boston = load_boston()7 X_train, X_test, y_train, y_test = train_test_split(boston.data, boston.target)8 9 # Create a new Linear Regression Model10 LR_model = LinearRegression()11 12 13 14 15 # store actual and predited data to draw chart16 predicted = LR_model.predict(X_test)17 actual = y_test18 19 20 # The coefficients21 print('Coefficients: n', LR_model.coef_)22 # The mean squared error23 print("Mean squared error: %.2f"24 % mean_squared_error(actual, predicted))25 # Explained variance score: 1 is perfect prediction26 print('Variance score: %.2f' % r2_score(actual, predicted))27 # store actual and predited data to draw chart predicted = LR_model.predict(X_test) actual = y_test from sklearn.linear_model import LinearRegression1 from sklearn.datasets import load_boston2 import matplotlib.pyplot as plt3 from sklearn.model_selection import train_test_split4 from sklearn.metrics import mean_squared_error, r2_score5 6 boston = load_boston()7 X_train, X_test, y_train, y_test = train_test_split(boston.data, boston.target)8 9 # Create a new Linear Regression Model10 LR_model = LinearRegression()11 12 # Train the model13 LR_model.fit(X_train, y_train)14 15 16 17 18 19 20 # The coefficients21 print('Coefficients: n', LR_model.coef_)22 # The mean squared error23 print("Mean squared error: %.2f"24 % mean_squared_error(actual, predicted))25 # Explained variance score: 1 is perfect prediction26 print('Variance score: %.2f' % r2_score(actual, predicted))27 # The coefficients print('Coefficients: n', LR_model.coef_) # The mean squared error print("Mean squared error: %.2f" % mean_squared_error(actual, predicted)) # Explained variance score: 1 is perfect prediction print('Variance score: %.2f' % r2_score(actual, predicted)) from sklearn.linear_model import LinearRegression1 from sklearn.datasets import load_boston2 import matplotlib.pyplot as plt3 from sklearn.model_selection import train_test_split4 from sklearn.metrics import mean_squared_error, r2_score5 6 boston = load_boston()7 X_train, X_test, y_train, y_test = train_test_split(boston.data, boston.target)8 9 # Create a new Linear Regression Model10 LR_model = LinearRegression()11 12 # Train the model13 LR_model.fit(X_train, y_train)14 15 # store actual and predited data to draw chart16 predicted = LR_model.predict(X_test)17 actual = y_test18 19 20 21 22 23 24 25 26 27 Output
  • 49. WML -WML - evaluation metricsevaluation metrics @lidderupkIBM Developer
  • 50. WML -WML - get Machine Learning service credentialsget Machine Learning service credentials @lidderupkIBM Developer
  • 51. WML -WML - save scikit-learn linear regression modelsave scikit-learn linear regression model @lidderupkIBM Developer # we will use WML to work with IBM Machine Learning Service1 from watson_machine_learning_client import WatsonMachineLearningAPIClient2 3 # Grab your credentials from the Watson Service section in Watson Studio or IBM Cloud Dashboard4 wml_credentials = {5 }6 7 # Instantiate WatsonMachineLearningAPIClient8 from watson_machine_learning_client import WatsonMachineLearningAPIClient9 client = WatsonMachineLearningAPIClient( wml_credentials )10 11 # store the model12 published_model = client.repository.store_model(model=LR_model,13 meta_props={'name':'upkar-housing-linear-reg'},14 training_data=X_train, training_target=y_train)15
  • 52. WML -WML - save scikit-learn linear regression modelsave scikit-learn linear regression model @lidderupkIBM Developer # we will use WML to work with IBM Machine Learning Service1 from watson_machine_learning_client import WatsonMachineLearningAPIClient2 3 # Grab your credentials from the Watson Service section in Watson Studio or IBM Cloud Dashboard4 wml_credentials = {5 }6 7 # Instantiate WatsonMachineLearningAPIClient8 from watson_machine_learning_client import WatsonMachineLearningAPIClient9 client = WatsonMachineLearningAPIClient( wml_credentials )10 11 # store the model12 published_model = client.repository.store_model(model=LR_model,13 meta_props={'name':'upkar-housing-linear-reg'},14 training_data=X_train, training_target=y_train)15 # Grab your credentials from the Watson Service section in Watson Studio or IBM Cloud Dashboard wml_credentials = { } # we will use WML to work with IBM Machine Learning Service1 from watson_machine_learning_client import WatsonMachineLearningAPIClient2 3 4 5 6 7 # Instantiate WatsonMachineLearningAPIClient8 from watson_machine_learning_client import WatsonMachineLearningAPIClient9 client = WatsonMachineLearningAPIClient( wml_credentials )10 11 # store the model12 published_model = client.repository.store_model(model=LR_model,13 meta_props={'name':'upkar-housing-linear-reg'},14 training_data=X_train, training_target=y_train)15
  • 53. WML -WML - save scikit-learn linear regression modelsave scikit-learn linear regression model @lidderupkIBM Developer # we will use WML to work with IBM Machine Learning Service1 from watson_machine_learning_client import WatsonMachineLearningAPIClient2 3 # Grab your credentials from the Watson Service section in Watson Studio or IBM Cloud Dashboard4 wml_credentials = {5 }6 7 # Instantiate WatsonMachineLearningAPIClient8 from watson_machine_learning_client import WatsonMachineLearningAPIClient9 client = WatsonMachineLearningAPIClient( wml_credentials )10 11 # store the model12 published_model = client.repository.store_model(model=LR_model,13 meta_props={'name':'upkar-housing-linear-reg'},14 training_data=X_train, training_target=y_train)15 # Grab your credentials from the Watson Service section in Watson Studio or IBM Cloud Dashboard wml_credentials = { } # we will use WML to work with IBM Machine Learning Service1 from watson_machine_learning_client import WatsonMachineLearningAPIClient2 3 4 5 6 7 # Instantiate WatsonMachineLearningAPIClient8 from watson_machine_learning_client import WatsonMachineLearningAPIClient9 client = WatsonMachineLearningAPIClient( wml_credentials )10 11 # store the model12 published_model = client.repository.store_model(model=LR_model,13 meta_props={'name':'upkar-housing-linear-reg'},14 training_data=X_train, training_target=y_train)15 # Instantiate WatsonMachineLearningAPIClient from watson_machine_learning_client import WatsonMachineLearningAPIClient client = WatsonMachineLearningAPIClient( wml_credentials ) # we will use WML to work with IBM Machine Learning Service1 from watson_machine_learning_client import WatsonMachineLearningAPIClient2 3 # Grab your credentials from the Watson Service section in Watson Studio or IBM Cloud Dashboard4 wml_credentials = {5 }6 7 8 9 10 11 # store the model12 published_model = client.repository.store_model(model=LR_model,13 meta_props={'name':'upkar-housing-linear-reg'},14 training_data=X_train, training_target=y_train)15
  • 54. WML -WML - save scikit-learn linear regression modelsave scikit-learn linear regression model @lidderupkIBM Developer # we will use WML to work with IBM Machine Learning Service1 from watson_machine_learning_client import WatsonMachineLearningAPIClient2 3 # Grab your credentials from the Watson Service section in Watson Studio or IBM Cloud Dashboard4 wml_credentials = {5 }6 7 # Instantiate WatsonMachineLearningAPIClient8 from watson_machine_learning_client import WatsonMachineLearningAPIClient9 client = WatsonMachineLearningAPIClient( wml_credentials )10 11 # store the model12 published_model = client.repository.store_model(model=LR_model,13 meta_props={'name':'upkar-housing-linear-reg'},14 training_data=X_train, training_target=y_train)15 # Grab your credentials from the Watson Service section in Watson Studio or IBM Cloud Dashboard wml_credentials = { } # we will use WML to work with IBM Machine Learning Service1 from watson_machine_learning_client import WatsonMachineLearningAPIClient2 3 4 5 6 7 # Instantiate WatsonMachineLearningAPIClient8 from watson_machine_learning_client import WatsonMachineLearningAPIClient9 client = WatsonMachineLearningAPIClient( wml_credentials )10 11 # store the model12 published_model = client.repository.store_model(model=LR_model,13 meta_props={'name':'upkar-housing-linear-reg'},14 training_data=X_train, training_target=y_train)15 # Instantiate WatsonMachineLearningAPIClient from watson_machine_learning_client import WatsonMachineLearningAPIClient client = WatsonMachineLearningAPIClient( wml_credentials ) # we will use WML to work with IBM Machine Learning Service1 from watson_machine_learning_client import WatsonMachineLearningAPIClient2 3 # Grab your credentials from the Watson Service section in Watson Studio or IBM Cloud Dashboard4 wml_credentials = {5 }6 7 8 9 10 11 # store the model12 published_model = client.repository.store_model(model=LR_model,13 meta_props={'name':'upkar-housing-linear-reg'},14 training_data=X_train, training_target=y_train)15 # store the model published_model = client.repository.store_model(model=LR_model, meta_props={'name':'upkar-housing-linear-reg'}, training_data=X_train, training_target=y_train) # we will use WML to work with IBM Machine Learning Service1 from watson_machine_learning_client import WatsonMachineLearningAPIClient2 3 # Grab your credentials from the Watson Service section in Watson Studio or IBM Cloud Dashboard4 wml_credentials = {5 }6 7 # Instantiate WatsonMachineLearningAPIClient8 from watson_machine_learning_client import WatsonMachineLearningAPIClient9 client = WatsonMachineLearningAPIClient( wml_credentials )10 11 12 13 14 15
  • 55. WML -WML - deploy scikit-learn linear regression modeldeploy scikit-learn linear regression model @lidderupkIBM Developer import json1 2 # grab the model from IBM Cloud3 published_model_uid = client.repository.get_model_uid(published_model)4 5 # create a new deployment for the model6 model_deployed = client.deployments.create(published_model_uid, "Deployment of scikit model")7 8 #get the scoring endpoint9 scoring_endpoint = client.deployments.get_scoring_url(model_deployed)10 print(scoring_endpoint)11 12 #use the scoring endpoint to predict house median price some test data13 scoring_payload = {"values": [list(X_test[0]), list(X_test[1])]}14 predictions = client.deployments.score(scoring_endpoint, scoring_payload)15 print(json.dumps(predictions, indent=2))16
  • 56. WML -WML - deploy scikit-learn linear regression modeldeploy scikit-learn linear regression model @lidderupkIBM Developer import json1 2 # grab the model from IBM Cloud3 published_model_uid = client.repository.get_model_uid(published_model)4 5 # create a new deployment for the model6 model_deployed = client.deployments.create(published_model_uid, "Deployment of scikit model")7 8 #get the scoring endpoint9 scoring_endpoint = client.deployments.get_scoring_url(model_deployed)10 print(scoring_endpoint)11 12 #use the scoring endpoint to predict house median price some test data13 scoring_payload = {"values": [list(X_test[0]), list(X_test[1])]}14 predictions = client.deployments.score(scoring_endpoint, scoring_payload)15 print(json.dumps(predictions, indent=2))16 # grab the model from IBM Cloud published_model_uid = client.repository.get_model_uid(published_model) # create a new deployment for the model model_deployed = client.deployments.create(published_model_uid, "Deployment of scikit model") import json1 2 3 4 5 6 7 8 #get the scoring endpoint9 scoring_endpoint = client.deployments.get_scoring_url(model_deployed)10 print(scoring_endpoint)11 12 #use the scoring endpoint to predict house median price some test data13 scoring_payload = {"values": [list(X_test[0]), list(X_test[1])]}14 predictions = client.deployments.score(scoring_endpoint, scoring_payload)15 print(json.dumps(predictions, indent=2))16
  • 57. WML -WML - deploy scikit-learn linear regression modeldeploy scikit-learn linear regression model @lidderupkIBM Developer import json1 2 # grab the model from IBM Cloud3 published_model_uid = client.repository.get_model_uid(published_model)4 5 # create a new deployment for the model6 model_deployed = client.deployments.create(published_model_uid, "Deployment of scikit model")7 8 #get the scoring endpoint9 scoring_endpoint = client.deployments.get_scoring_url(model_deployed)10 print(scoring_endpoint)11 12 #use the scoring endpoint to predict house median price some test data13 scoring_payload = {"values": [list(X_test[0]), list(X_test[1])]}14 predictions = client.deployments.score(scoring_endpoint, scoring_payload)15 print(json.dumps(predictions, indent=2))16 # grab the model from IBM Cloud published_model_uid = client.repository.get_model_uid(published_model) # create a new deployment for the model model_deployed = client.deployments.create(published_model_uid, "Deployment of scikit model") import json1 2 3 4 5 6 7 8 #get the scoring endpoint9 scoring_endpoint = client.deployments.get_scoring_url(model_deployed)10 print(scoring_endpoint)11 12 #use the scoring endpoint to predict house median price some test data13 scoring_payload = {"values": [list(X_test[0]), list(X_test[1])]}14 predictions = client.deployments.score(scoring_endpoint, scoring_payload)15 print(json.dumps(predictions, indent=2))16 #get the scoring endpoint scoring_endpoint = client.deployments.get_scoring_url(model_deployed) print(scoring_endpoint) import json1 2 # grab the model from IBM Cloud3 published_model_uid = client.repository.get_model_uid(published_model)4 5 # create a new deployment for the model6 model_deployed = client.deployments.create(published_model_uid, "Deployment of scikit model")7 8 9 10 11 12 #use the scoring endpoint to predict house median price some test data13 scoring_payload = {"values": [list(X_test[0]), list(X_test[1])]}14 predictions = client.deployments.score(scoring_endpoint, scoring_payload)15 print(json.dumps(predictions, indent=2))16
  • 58. WML -WML - deploy scikit-learn linear regression modeldeploy scikit-learn linear regression model @lidderupkIBM Developer import json1 2 # grab the model from IBM Cloud3 published_model_uid = client.repository.get_model_uid(published_model)4 5 # create a new deployment for the model6 model_deployed = client.deployments.create(published_model_uid, "Deployment of scikit model")7 8 #get the scoring endpoint9 scoring_endpoint = client.deployments.get_scoring_url(model_deployed)10 print(scoring_endpoint)11 12 #use the scoring endpoint to predict house median price some test data13 scoring_payload = {"values": [list(X_test[0]), list(X_test[1])]}14 predictions = client.deployments.score(scoring_endpoint, scoring_payload)15 print(json.dumps(predictions, indent=2))16 # grab the model from IBM Cloud published_model_uid = client.repository.get_model_uid(published_model) # create a new deployment for the model model_deployed = client.deployments.create(published_model_uid, "Deployment of scikit model") import json1 2 3 4 5 6 7 8 #get the scoring endpoint9 scoring_endpoint = client.deployments.get_scoring_url(model_deployed)10 print(scoring_endpoint)11 12 #use the scoring endpoint to predict house median price some test data13 scoring_payload = {"values": [list(X_test[0]), list(X_test[1])]}14 predictions = client.deployments.score(scoring_endpoint, scoring_payload)15 print(json.dumps(predictions, indent=2))16 #get the scoring endpoint scoring_endpoint = client.deployments.get_scoring_url(model_deployed) print(scoring_endpoint) import json1 2 # grab the model from IBM Cloud3 published_model_uid = client.repository.get_model_uid(published_model)4 5 # create a new deployment for the model6 model_deployed = client.deployments.create(published_model_uid, "Deployment of scikit model")7 8 9 10 11 12 #use the scoring endpoint to predict house median price some test data13 scoring_payload = {"values": [list(X_test[0]), list(X_test[1])]}14 predictions = client.deployments.score(scoring_endpoint, scoring_payload)15 print(json.dumps(predictions, indent=2))16 #use the scoring endpoint to predict house median price some test data scoring_payload = {"values": [list(X_test[0]), list(X_test[1])]} predictions = client.deployments.score(scoring_endpoint, scoring_payload) print(json.dumps(predictions, indent=2)) import json1 2 # grab the model from IBM Cloud3 published_model_uid = client.repository.get_model_uid(published_model)4 5 # create a new deployment for the model6 model_deployed = client.deployments.create(published_model_uid, "Deployment of scikit model")7 8 #get the scoring endpoint9 scoring_endpoint = client.deployments.get_scoring_url(model_deployed)10 print(scoring_endpoint)11 12 13 14 15 16
  • 59. WML -WML - deploy scikit-learn linear regression modeldeploy scikit-learn linear regression model @lidderupkIBM Developer
  • 60. WML -WML - try it out on your own !try it out on your own ! @lidderupkIBM Developer http://bit.ly/waston-ml-sign
  • 61. @lidderupkIBM Developer WML -WML - create a new notebook from URLcreate a new notebook from URL Grab the FULL URL from : http://bit.ly/boston-house-notebook
  • 62. Thank youThank you   Let's chat !Let's chat ! @lidderupkIBM Developer Upkar Lidder, IBM   @lidderupk https://github.com/lidderupk/ ulidder@us.ibm.com